Universidade de Lisboa
Faculdade de Ciências
Departamento de Informática
Analysis of RNA-seq data from the interaction
of
Coffea spp. - Colletotrichum kahawae
Joana Rita Vieira Fino
Dissertação
Mestrado em Bioinformática e Biologia Computacional
Especialização em Bioinformática
Universidade de Lisboa
Faculdade de Ciências
Departamento de Informática
Analysis of RNA-seq data from the interaction
of Coffea spp. - Colletotrichum kahawae
Joana Rita Vieira Fino
Dissertação
Mestrado em Bioinformática e Biologia Computacional
Especialização em Bioinformática
Orientadores:
Prof. Doutor Octávio Fernando de Sousa Salgueiro Godinho Paulo
Doutora Dora Cristina Vicente Batista Lyon de Castro
Agradecimentos
Em primeiro lugar, gostaria de agradecer ao Professor Doutor Octávio Paulo e à Doutora Dora Batista por me terem orientado durante este longo percurso. Ao Professor Octávio pelo constante otimismo, entusiasmo, e confiança que me transmitiu mesmo nas alturas mais difíceis. À Doutora Dora pelo apoio e conhecimento que me transmitiu, que me ajudou a tornar uma melhor cientista.
Agradeço também a toda a equipa do CIFC, que apesar do pouco tempo que passei com eles, me fizeram sentir sempre em casa. À Doutora Maria do Céu pela sua simpatia e conhecimento cientifico que ajudou a tornar esta tese muito mais rica do que eu pensei que poderia ser.
À Doutora Andreia Figueiredo agradeço a amizade, o espírito critico e o conhecimento sobre expressão génica tão importante desde o inicio de todo este trabalho.
A todo o CoBiG² que durante os últimos dois anos foram praticamente uma segunda família para mim. A constante boa disposição, amizade e entreajuda torna-vos mesmo especiais. Em especial ao Francisco Pina-Martins por todo o conhecimento informático que me transmitiu e a constante disponibilidade para quando os scripts teimosamente não funcionavam. Prometo continuar a ser uma boa padawan.
À Telma, que passou de apenas uma colega, a uma verdadeira amiga. A forma critica com que olhou para todo o trabalho, o seu dom na construção de figuras explicativas, e a sua constante má disposição sarcástica tornou tudo mais fácil.
Ao João Pedro pelo seu constante apoio e encorajamento até quando tudo parecia impossível. Tudo isto tinha sido mais difícil sem a tua paciência e compreensão. Tu bem dizias que eu conseguia.
Por fim, mas não menos importante, à minha família. Aos meus pais, pela educação e apoio que sempre me deram, independentemente do caminho que escolhi. Vocês deram-me asas para voar. Ao Ricardo e à Rute, por serem simplesmente os meus irmãos mais velhos.
Em suma, obrigada a todos, sem vocês não seria possível ter chegado onde cheguei. Esta tese é dedicada a ti avô.
Nota prévia
A escrita desta tese de mestrado encontra-se em língua Inglesa uma vez que esta é a língua científica universal. Por esta razão, o conhecimento e treino da sua escrita e gramática revestem-se de uma importância acrescida para quem tenciona seguir uma carreira em investigação científica. A escrita da presente tese nesta língua representa assim um exercício apropriado que poder-se-á revelar proveitoso no futuro.
No decorrer deste mestrado foram reunidas as condições para a escrita de artigos científicos baseados nos resultados aqui obtidos. Esta foi a razão pela qual esta tese foi escrita em formato de publicação científica. Desta forma, visa-se acelerar o processo de elaboração dos manuscritos e suas subsequentes publicações. Como os resultados aqui obtidos têm de ser complementados com as subsequentes validações biológicas dos dados de expressão genética, o manuscrito encontra-se escrito de acordo com as instruções para autores de uma das revistas de referência da área: “Molecular Ecology”. No entanto, para facilitar a leitura, as figuras e tabelas foram incluídas ao longo do texto.
As referências bibliográficas da Introdução Geral foram também elaboradas segundo os parâmetros da revista científica internacional, “Molecular Ecology”. Trata-se de uma revista relevante com um sistema de citações cómodo para a leitura de textos de revisão científica. Adicionando o seu elevado fator de impacto na sociedade científica, pareceu apropriada a escolha desta revista como referência para a apresentação da bibliografia.
Resumo
O café é um dos produtos mais comercializados no mundo, com extrema importância económica e social, influenciando milhões de pessoas que dependem direta ou indiretamente desta indústria. No entanto, a cultura do café é extremamente afetada por agentes patogénicos, nomeadamente fungos. Colletotrichum kahawae Waller and Bridge é um desses agentes, sendo responsável pela antracnose dos frutos verdes do cafeeiro, conhecida como “Coffee Berry Disease”. Esta doença afeta a espécie Coffea arabica L., a espécie de maior importância no mercado, apresentando os maiores volumes de produção. Atualmente, a antracnose dos frutos verdes do cafeeiro incide sobretudo em zonas de alta altitude, encontrando-se confinada ao continente africano. Contudo tal não significa que não se possa dispersar para outras zonas de cultivo onde as condições de desenvolvimento, tanto para a planta como para o fungo, sejam favoráveis. Foram desenvolvidas várias estratégias de melhoramento para o combate à doença, levando ao desenvolvimento de algumas variedades resistentes no Quénia. Apesar de já serem atualmente conhecidos vários genótipos com um carácter de resistência a esta doença, as bases genéticas e moleculares da mesma são ainda desconhecidas. Com o intuito de compreender as bases subjacentes ao processo de resistência, recorreu-se à sequenciação comparativa do transcriptoma de dois genótipos de cafeeiro, um susceptível (Caturra) e outro resistente (Catimor 88) durante as primeiras horas de interação de C. kahawae, através da plataforma Illumina. A análise destes dados visou a identificação de genes diferencialmente expressos, envolvidos na resistência da planta à doença. Os dados desta sequenciação foram previamente analisados pela empresa ARK genomics (UK), embora utilizando softwares e parâmetros padronizados, normalmente aplicados para todo o tipo de análises deste género, desde bactérias a plantas. Com o objetivo de melhorar e aprofundar a análise, foi desenvolvida uma nova análise customizada, que aqui se apresenta, em comparação com a análise anterior. Várias ferramentas e abordagens foram aplicadas nesta nova análise, tendo em conta a inexistência de um geno ma de referência. Neste trabalho foi possível identificar vários problemas e cuidados a ter desde o tratamento das “reads”, até ao cálculo de diferenças de expressão, bem como simples diferenças entre softwares. Neste novo estudo de expressão teve-se ainda em conta análises comparativas a diferentes níveis que não tinham sido efetuadas na análise anterior. A anotação de “unigenes” diferencialmente expressos indica uma tendência para categorias funcionais
diretamente relacionadas com a produção de energia, envolvida no crescimento e desenvolvimento da planta, e com processos já identificados como envolvidos na resposta de defesa a agentes patogénicos tais como o metabolismo de açucares ou a biosíntese de fenilalanina e fenilpropanoides.
De um modo geral, os objetivos deste trabalho foram cumpridos, tendo-se desenvolvido uma linha de análise que permitiu uma melhor e mais adequada exploração dos dados gerados por sequenciação de transcriptoma. Espera-se assim que os resultados obtidos venha a contribuir para o aumento do conhecimento científico sobre a resposta de defesa por parte da planta, gerando informações úteis para o estabelecimento de programas de melhoramento que apoiem a produção sustentável de uma cultura tão relevante a nível económico e social. Por outro lado, espera-se que este trabalho mostre a necessidade de uma análise cuidada de dados de “next generation sequencing”, em especial dados resultantes da sequenciação de RNA, tecnologia ainda bastante recente e sem um processo universalmente aceite para a análise correta dos dados gerados.
Palavras-Chave: Cafeeiro.; Antracnose dos frutos verdes ; Mecanismos de defesa;
Abstract
Coffee is one of the most traded products in the world, with extremely social and economic importance, and millions of people who depend directly or indirectly on it. Coffee berry disease (CBD), caused by the fungus Colletotrichum kahawae Waller & Bridge, is considered the biggest threat to Arabica coffee production in Africa at high altitude. In Coffea arabica L. plantations, CBD can cause up to 20-50% of crop losses, reaching 80% in years of severe epidemics if chemical control is not applied. In order to control this disease, several coffee improvement strategies were developed which leaded to the selection of few hybrid commercial resistant varieties in Kenya. Therefore, breeding for coffee resistance remains a powerful strategy to fight CBD, in an economic and sustainable manner. With the purpose of gaining some insights on coffee resistance process, a RNA Illumina sequencing approach was used to characterize the transcriptional profile of two coffee genotypes, respectively susceptible (Caturra) and resistant (Catimor 88) to C. kahawae, during the early stages of the infection process. The differential expression analysis of this data aimed to identify genes putatively involved in the resistance process. Although a previous analysis was made by the sequencing company ARK genomics (UK), this was only based on non-specific methods generally applied to a wide range of organisms. To improve the analysis and consequently the results obtained, a new approach was taken aiming to produce a more customized workflow. Comparatively with the previous analysis, the present approach showed some improvement regarding the transcriptome assembly quality and size, or the level of confidence of the differential expression results, despite the CPU and RAM limitations. It was possible to account for additional comparative analyses for the differential expression assessment and to identify the enriched functional categories representing the differential expressed unigenes. Regarding the biological results, the resistant genotype showed a high effective response to the infection while the susceptible genotype showed an early stress-leaded response by the infection. The KOG and KEGG annotation of the differential expressed unigenes, was able to identify two main domains: plant development and defense response. It is expected that the results obtained here will contribute to increase the scientific knowledge on the plant defense response , generating useful information able to guide the establishment of breeding programs that support sustainable production.
Moreover, it is expected that this study show the necessity of careful analysis of next generation sequencing data, especially when dealing with recent methods like RNA-seq, for which there is no clear consensus about the best analysis practices.
Keywords: Coffee plant; Anthracnose; Plant Defense mechanisms; Transcriptome assembly; Differential expression; Comparative analyses
Table of Contents
Agradecimentos...I Nota prévia...II Resumo...III Abstract...V Chapter I I. General introduction...11. The Host – Coffee Plants...3
1.1. General Characteristics...3
1.2. History...4
1.3. Production and Commercialization...5
2. Colletotrichum kahawae, the agent of coffee Berry Disease...6
2.1. Origin and Distribution...6
2.2. Infection process and disease symptoms:...7
2.3. Dissemination:...8
2.4. Economical impact...9
2.5. Control...9
3. Coffee – C. kahawae interaction...10
3.1. Coffee resistance mechanisms to C. kahawae...11
4. RNA-sequencing and data analysis...12
4.1. NGS technologies...12 4.2. RNA-Seq...13 4.3. Data Analysis...15 Objectives...18 Chapter II 1. Introduction...21
2. Material and Methods...23
3. Results...28 4. Discussion...44 5. Conclusions...53 References...54 Supplementary material...59 Chapter III Concluding Remarks...70 References...71
I. General introduction
Coffee is one of the most valuable agricultural products in the world, and one of the greatest economic income generators for several developing countries where a considerable percentage of the population depends on coffee-related activities such as production, processing, transport and commercialization. The worlds' consumption of coffee is constantly growing, which makes the coffee industry prosperous. Nevertheless, recurrent rock bottom prices cause immense hardship both to countries where coffee is a key economic activity, and to the farmers involved in coffee production. The origin of this situation lies on the oscillation of prices due to the current imbalance between supply and demand. Meanwhile, the costs of production, transport, machinery and disease control continue to grow. The subsequent effects force the coffee farmers to economize and this has often led to a reduction in the use of agricultural inputs necessary for optimal coffee production. On the other hand, the occurrence of major severe diseases is one of the main limiting factors of coffee production. Coffee berry disease (CBD) caused by the fungus Colletotrichum kahawae Waller and Bridge, is the most devastating threat to Coffea arabica L. production in Africa at high altitude, and its dispersal to Latin America and Asia represents a serious concern. This pathogen is a highly destructive specialist that infects expanding green berries, leading to their premature dropping and mummification. Despite the existence of effective methods for CBD control such as chemical control, their prices and the application procedures can be too high and complex especially for small producers. Thus, the utilization of methods such as the cultivation of disease resistant varieties seems to be the most reliable way to manage disease control. In order to accomplish long-lasting resistance using breeding strategies, a better knowledge of the molecular bases of coffee resistance is essential, so that a sustainable system of coffee production can be created.
Deep transcriptome sequencing studies are becoming more and more common, presenting inumerous advantages towards the unprecedent amount of knowledge that can generate, but the bioinformatics analysis of the data is still a major limitation. RNA-Seq analysis is mostly used for expression studies, and is suitable for the understanding of transcriptomic dynamics between conditions.
In the present work, a RNA-seq comparative analysis was made between a susceptible and a resistant genotype of coffee when infected with C. kahawae, with the aim of identifying genes potentially involved in the resistance response. Before presenting this work, a brief introduction is made on the host, Coffea spp., the pathogen C. kahawae and the plant-pathogen interaction in order to highlight the most relevant aspects of the pathosystem studied. It is also presented a little introduction to the NGS technology, methods of analysis and software used.
1. The Host – Coffee Plants
1.1. General Characteristics
Coffee plants belong to the genus Coffea from the Rubiaceae family. This classification encounters 103 described species, with the most economically relevant species belonging to the subgenus Coffea, including the three species that are commercially explored: Coffea
arabica L. (Arabica coffee), Coffea canephora Pierre ex
A.Froehner (Robusta coffee) and Coffea liberica Hiernwith a marginal expression in total coffee production, grown only at a regional scale (Bridson 1994; Davis 2003; Davis et al. 2006).
Coffea spp. are evergreen,
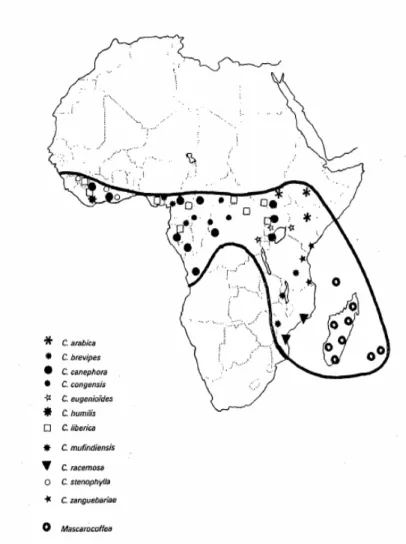
glossy-leaved shrubs or trees 5–10 m high from tropical and sub-tropical forest habitats. Native of the African continent, Coffea spp. occur mostly in humid, evergreen forests, but their habitat also includes other forest types (Waller et al. 2007) The three commercially relevant species are better adapted to different kinds of forests: C. arabica need cool and humid environmental conditions at high altitudes, while C.canephora and C. liberica are usually found in humid and relatively warmer environments, typical of the lowlands (Wrigley 1988; Lashermes & Anthony 2007). The natural distribution of Coffea spp. is represented in Figure 1. Coffee plants features include elliptical leaves with pointed tips, which occur in pairs. They have short petioles with small
Figure 1 - The distribution of native species of Coffea spp. adapted from Charrier & Berthaud 1985
stipules, and domatia (small pits) are present on the undersides of leaves at the junction of the main veins. Flower clusters are produced in leaf axils. The fruit is a two-seeded drupe with a fleshy epicarp. The stems exhibit dimorphic branching due to the different development of two buds that occur, one above the other in each leaf axil of the main stem (Waller et al. 2007).
As common in the family Rubiaceae, most of the species of the genus Coffea are diploid with 2n=22 chromosomes, except C. arabica which is allotetraploid (2n=44 chromosomes), resulting from a natural hybridization between C. eugenioides and C. canephora genomes (Lashermes et al. 1999). C. arabica is further considered a relatively new species, due to the lack of differentiation from its parental species (Raina et al. 1998; Lashermes & Anthony 2007).C. arabica also differs from the other species due to being self-fertile, which is a trait that is not present in other species (self-incompatible) (Charrier & Berthaud 1985).
C. arabica, is one of the most important species in coffee industry, since the best quality
coffee, with low caffeine content is produced from its fruits, however is highly susceptible to various diseases.
1.2. History
The history of the coffee plant is not accurate, since it dates back to ancient times, and covers so many episodes that the version presented here is most likely a mix of facts and fiction that cannot be easily dissociated from each other.
According to Ferrão, 1993, coffee has its origin in the mountainous area of Abyssinia (actual Ethiopia) from where it spread to South-East Arabia possibly carried by pilgrims to Mecca, which used coffee berries for its stimulating effect. These pilgrims later introduced the plant in India around the 16th or 17th century (Bigger 2006; Ukers 1935), but their cultivation was known to be first started as early as 575 AD in Yemen (Anthony et al. 2002; Topik 2004; Bigger 2006; Lécolier et al. 2009)
In the 16th century, the Europeans become aware of coffee cultivation and use as beverage, which led to their dissemination around the colonies (Anthony et al. 2002; Topik 2004; Bigger 2006), turning coffee into one of the major sources of income, as it remained until today. The Dutch were the first to recognize the potential of coffee, and manage to ship a coffee plant from Yemen to Java (Ferrão 1993; Topik 2004; Bigger 2006; Ukers 1935). In
1706 the first coffee plants were received at the Amsterdam botanical gardens, from Java, and soon they were being shipped to other gardens all around Europe (Ferrão 1993; Topik 2004; Bigger 2006; Ukers 1935). The French soon started the dispersion along the West Indies, between 1715 and 1730, introducing coffee into places like the Dominican Republic, Haiti, Martinique, Jamaica and Reunion island (Bigger 2006; Ukers 1935). The dispersion continued to Central America, including Costa Rica, Cuba, Mexico and Venezuela, due to Spanish intervention (Topik 2004; Bigger 2006; Ukers 1935). The Portuguese seems to be responsible for the introduction of coffee in Brazil, and later on, in other colonies, such as the African colonies of São Tomé, Mozambique and Cape Verde, on the 17-18th century (Ferrão 1993). Just like Portugal, other European Countries introduced coffee on their African colonies: in the 19th century, the Dutch, established plantations on Gana and the French in the Ivory Cost (Bigger 2006).
The dissemination and domestication of coffee was thus mainly conducted from the 16th to
the 19th century and was subjected to an intensive selection of phenotypes, optimized for
better economic performance (Stukenbrock & McDonald 2008). This new and rapidly created agro-ecosytem provided genetically uniform populations, ideal as a host for the emergence and dispersal of plant pathogens (Anthony et al. 2002). This apparent lack of genetic variation in C. arabica crops makes them highly vulnerable to disease outbreaks since virulent pathogen genotypes adapted to a particular host genotype can increase very rapidly in frequency, quickly generating a degree of host specificity or race specificity rarely seen in natural ecosystems(Friesen et al. 2006; Butler et al. 2009).
1.3. Production and Commercialization
Nowadays, coffee is one of the world’s most valuable export commodities, ranking second on the world market after petroleum products and a primary export of many developing countries that rely, to a greater or lesser extent, on the revenues generated. This means that any decline on coffee trading earnings can have major economic repercussions in those countries (Davis 2003).
According to the International Coffee Organization, coffee is the world’s most widely traded tropical agricultural commodity, accounting for exports estimated in US$ 15.4 billion for 2009/10. Coffee also plays an important role at the social level of the producing countries, due to the high number of jobs provided by this industry. For example, in 2010 the total
coffee sector employment was estimated at about 26 million people in 52 producing countries (van Hilten et al. 2011).
Coffee production relies mainly on two species: Coffea arabica (70%) and Coffea
canephora (30%) (Davis 2003; Ukers 1935). This distribution of production is related to the
superior cup quality of C. arabica. C. arabica is predominantly produced in Central and South America and C. canephora in West Africa and Asia (http://www.ico.org, accessed on October 16th 2013).
Brazil encounters itself on the top of the list of the world's biggest producer of coffee both in Arabica and Robusta coffee, followed by Colombia for C. arabica, and Vietnam for C.
canephora (http://www.ico.org, accessed on October 16th 2013).
The coffee industry is prosperous and stable due to the exports of most of the production to European countries (Vega et al. 2003; Waller & Masaba 2006) (for example, in 2010-11, Brazil consumed 19130000 bags against 29603000 exported) (http://www.ico.org, accessed on October 16th 2013). Despite that, the coffee crisis is a fact: the oscillation of prices due to
the current imbalance between supply and demand has severe consequences at several levels. On top of that, coffee diseases can potentially aggravate this crisis, especially major ones, such as coffee leaf rust and coffee berry disease (Osorio 2002; Vega et al. 2003).
2. Colletotrichum kahawae, the agent of coffee Berry Disease
Coffee Berry disease (CBD) is an extremely severe disease of C. arabica caused by the fungus Colletotrichum kahawae Waller & Bridge resulting in anthracnose of the green fruits. It is the largest threat to Coffea arabica production in Africa, to where it is presently still confined.
The most recent speciation hypothesis showed that Colletotrichum kahawae emerged from the C. gloeosporioides complex as a specialist on Arabica coffee (Silva et al. 2012), producing anthracnose symptoms on the green berries, expressed by dark sunken leasons leading to their premature dropping or mummification – Coffee Berry Disease.
2.1. Origin and Distribution
Only in 1993 the CBD agent was well characterized as a distinct species, based on morphological, cultural and biochemical characters, as Colletotrichum kahawae Waller &
Bridge belonging to the Family Glomerellaceae (Waller et al. 1993).
A few years ago, the C. gloeosporioides species complex was reclassified, and the CBD agent was then classified as a subspecies of C. kahawae, C. kahawae subsp. kahawae (Weir et al. 2012).
The specific origin of this pathogen and the disease emergence is still a subject of debate. Nonetheless the first known report goes back to 1922 in two small districts of Kenya, located at high altitudes, where most of the crops were ruined by a new unknown disease (McDonald 1926; Vermeulen 1970).After that, the disease was described in Angola (1930), Congo RD (1938), Mount Kenya district (1939), and afterwards, it rapidly spread to almost all the Arabica coffee cultivation areas of Africa (Nutman & Roberts 1960; Manga 1997). More recently Silva et al. (2012) in their study hypothesized that C. kahawae emergence may have taken place in Angola, as opposed to Kenya.
Currently the disease is confined to the African Continent and is rarely reported below 1600 meters (Manuel et al. 2010). This preference is due to the cooler and wetter conditions of high altitudes that favor both pathogen and disease development (Vermeulen 1970; Mulinge 1971; Waller & Masaba 2006). However, the spread of the disease is a big concern for non African coffee production countries bearing similar environmental conditions, due to the terrible consequences that it could bring for production.
2.2. Infection process and disease symptoms:
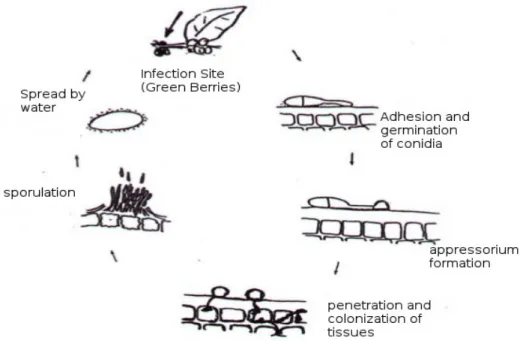
In the infection process, C. kahawae uses a hemibiotrophic strategy, which includes a post-penetrative asymptomatic biotrophy phase, followed by a destructive necrotrophy phase that culminates in the appearance of disease symptoms and the reproduction of the fungus (Loureiro et al. 2012). C. kahawae´s infection starts with the germination of the conidia (asexual spore) and differentiation of melanized apressoria on the plant´s surface, a structure used by the fungus to penetrate the cuticule (Fig 2) by mechanical pressure, secretion of cutin degrading enzymes, or a combination of both processes (Chen et al. 2004; Silva et al. 2006). Following the penetration, the fungus starts to colonize the host tissues: an infection vesicle is formed from which several other hyphae emerge and grow. This phase involves the transition of hyphae growth in living cells (biotrophy - which may last 24 to 48 hours after inoculation) to dead cells (necrotrophy). Finally, a new conidia is formed and emerges from the cuticule, setting free a new generation of C. kahawae spores (Figure 2) (Silva et al. 2006; Loureiro et
al. 2012).
Depending on the resistant or susceptible response of the coffee genotype, two types of symptomatology can occur. Scab lesions are typical of a resistance plant response, which restricting fungal development, only allows the formation of superficial little black spots . In this case, the deeper layers of the fruit are not invaded, and the lesion appears stationary, not affecting the normal development of the green berry (Anthony et al. 2002; Topik 2004). On the other hand, in susceptible plants the development of Active lesions is observed, starting as little black spots, which in the presence of good conditions can form dark, sunken, active lesions that rapidly expand and destroy the entire fruit (Nutman 1970; Ntahimpera et al. 1999; Schroth et al. 2000).
2.3. Dissemination:
To a properly C. kahawae spore dispersion, environmental conditions such as temperature, precipitation and humidity, are crucial because these conditions directly interfere with the infection process, affecting also the distribution and severity of the disease (Mulinge 1971). Temperatures within the range of 17 – 28ºC are favorable for the development of the infection, while temperatures outside this range slow down this process. In addition, the maturation stage of the host plant's fruit is also a parameter known to have influence in the infection process (Nutman & Roberts 1960).
Sporulation occurs mainly in already infected berries with high humidity conditions (Gibbs 1969) and the spread, responsible for new infections, is exclusively dependent on rain, since the mucilage surrounding the spores also prevents dispersal by wind (Fitt et al. 1989). Thereby, the spread occurs in a vertical way in the same plant, where the highest twigs infect the lowest twigs, and, in different plants by rain splash, , but only in short distances (never more than 1 m) (Ntahimpera et al. 1999). Taking into account the high distribution of C.
kahawae, there is, however, a very good possibility that spread by rain is not the only
mechanism for the C. kahawae dispersal (Waller 1972). Human activity and animals could play also a responsible part in fungus dispersal (Nutman & Roberts 1960; Schroth et al. 2000).
2.4. Economical impact
CBD is considered one of the main problems to coffee production, with great repercussions in economics.
In C. arabica plantations, CBD can cause up to 20-50% of crop losses, reaching 80% in years of severe epidemics if chemical control is not applied (Van der Vossen et al. 1976; Griffiths et al 1971). This can signify the loss of millions of dollars, especially in countries where coffee production is almost exclusively restricted to C. arabica such as the case of Ethiopia (Derso & Waller 2003). The scenario can be even more concerning, if we take in consideration that in Ethiopia, more than 700,000 families are involved in coffee production and more than 15 million people depend directly or indirectly of coffee (Vega et al. 2010).
The use of chemical control measures can decrease the losses by CBD, but that measures may account for 30-40% of total production costs. Annual economic damage to C. arabica production in Africa, due to crop loss by CBD and cost of chemical control, is estimated at US$ 300–500 million (Van Der Vossen 2009).
2.5. Control
The first attempts to control the disease consisted on the application of copper and or systemic organic fungicides (Nutman 1970). The application of this treatment, however, not only caused toxicity problems in the plants and soils, but in other cases was not effective as the fungicide itself could be mostly washed away (Nutman 1970; Chung et al. 2006; van den Bosch & Gilligan 2008).
Currently the main focus for disease control is the development and cultivation of resistant coffee varieties to CBD, through plant breeding programs (Silva et al. 2006). A major breakthrough for the improvement of coffee breeding programs was the discovery in the late 1950s, of Hibrido de Timor (HDT), a coffee hybrid of C. arabica and C. canephora. HDT was discovered in an Arabica coffee plantation in Timor. Initially was known for being resistant to coffee leaf rust, but later was recognized as having some degrees of CBD resistance too. In that way, some lines of HDT and Rume Sudan, has been used in breeding programs as resistance sources (Wrigley 1988; Varzea 1993; Silva et al. 2006). One such examples, is the commercial variety Ruiru 11 and Catimor 88 in Kenya, which were bred for resistance to CBD and coffee leaf rust.
3. Coffee – C. kahawae interaction
Plants and pathogens have evolved together in a dynamic system of interaction. While plants have the ability to recognize potential invading pathogens, and have developed several defense mechanisms; pathogens, at the same time, have developed new infection strategies, compromising the defense mechanisms of the host, effectively playing an evolutionary “ping-pong” game.
There are essentially three reasons for a pathogen not to be able to infect a host, leading to an incompatible interaction:
i) The plant is unable to support the niche requirements of the potential pathogen, constituting a non host (Hammond-Kosack & Jones 1996);
ii) The plant possesses means to confine successful infections, which are constitutively expressed, like structural characteristics that prevent the entrance of micro-organisms or the presence of some antimicrobial compounds, forming physical and chemical barriers (Hammond-Kosack & Jones 1996);
iii) Upon recognition of the attack, the plant initiates mechanisms that can keep the invasion localized, such as structural alterations of the cell wall, production and accumulation of antimicrobial compounds, deposition of compounds between the plasma membrane and the cell wall or even cell death at the pathogen's site of penetration, which involves a network of signal transduction and rapid activation of gene expression (Hammond-Kosack & Jones 1996). In this process, a non-specific first line of plant defense is activated by the recognition of common pathogen elicitors (pathogen-associated molecular patterns, PAMPs), which
trigger the subsequent responses, such as the production of pathogenesis-related (PR) proteins (Hammond-Kosack & Jones 1996; Gururani et al. 2012)
However, pathogens can “bend” these rules, by suppressing host defenses and subsequently colonizing host tissues, which corresponds to a compatible interaction (susceptibility).
3.1. Coffee resistance mechanisms to C. kahawae
In Arabica coffees resistance mechanisms to C. kahawae are both preformed and induced, and operate at different stages of pathogenesis (Gichuru 1997). The coffee berry cuticle could act as a physical barrier to the penetrating pathogen. Moreover, several investigations on the occurrence and possible role in CBD resistance of preformed antifungal compounds in the cuticle have been carried out, although the chemical nature of these compounds was not identified (Silva et al. 2006 and references therein).
Resistant coffee genotypes can rapidly initiate a specific defense response to the infection of
C. kahawae, leaving only a scab lesion on the infection site (Anthony et al. 2002; Topik
2004). According to Masaba & van der Vossen (1992), this type of lesion is related with the formation of a suberin barrier under the local of infection – a mechanic barrier to the development of the fungus - and the capacity to form layers of suberised cells under the local of infection. Apparently these mechanisms are dependent on metabolic activity, because when the fruit is detached from the plant, this capacity of response is completely lost.
Cytological analysis showed that for certain coffee genotypes resistance to C. kahawae is characterized by the restriction of fungal growth associated with the hypersensitive host cell death (hypersensitive response), accumulation of phenolic compounds, encasement of intracellular hyphae with callose and modifications in cell walls (lignification and thickening ) (Silva et al. 2006; Loureiro et al. 2012).
In susceptible plants, some of these responses, such as deposition of callose and phenols are delayed, not being able to prevent the fungus development and reproduction (Silva et al. 2006; Loureiro et al. 2012).
Although coffee responses have been well described in a citological context, the genetic molecular bases of coffee resistance against C. kahawae remain unknown. Previous studies have identified some genes as being involved in resistance mechanism, however, their annotation and characterization has not been possible (Silva et al. 2006; van der Vossen & Walyaro 2009). Thus, it is extremely important to increase the knowledge on the structure of
the transcriptome, through the comparison of infected resistant and susceptible coffee genotypes, to get some insights on the distinctive processes underlying plant resistance response.
4. RNA-sequencing and data analysis
Studying the transcriptome profile is essential for fully understand the biological pathways that are active in various physiological conditions or developmental stages (Wang et al. 2009; Ozsolak & Milos 2010). Knowledge about functional elements of the genome and molecular specificities of cells and tissues can be retrieved from this type of analysis (Wang et al. 2009; Martin & Wang 2011). For a long time, the utilization of the Sanger technology led to a limited knowledge of the transcriptome, since this technology can only allow sequencing of limited sets of samples with a high time and resource consumption (Martin & Wang 2011). Recently, the development of novel deep-sequencing technologies (Next generation sequencing, NGS) opened exciting new approaches to transcriptome profiling (Bohnert et al. 2009).
4.1. NGS technologies
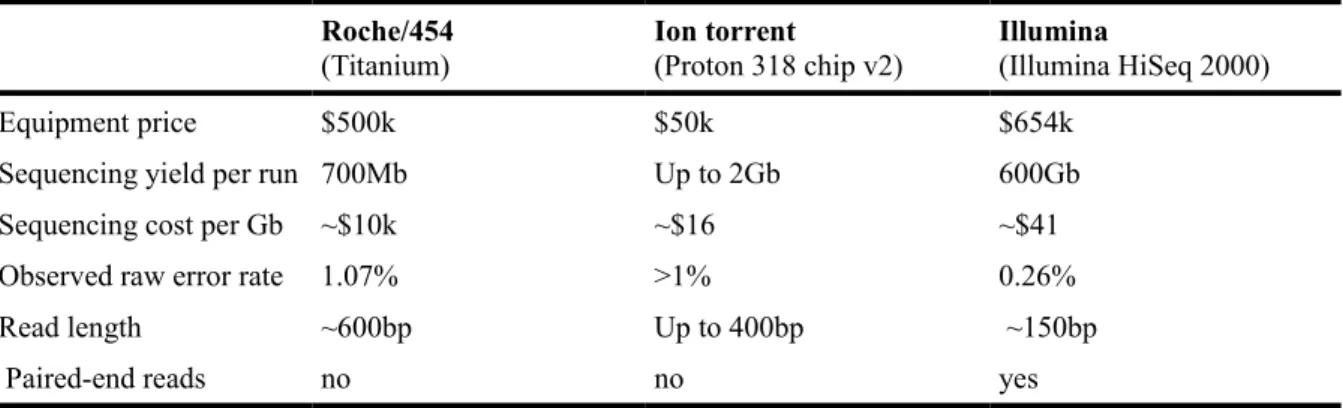
Currently, there are three NGS technologies in major use: Roche/454 (entering into disuse, but still viable for a number of goals as proved by many recently published studies, such as the study of Oak root response to ectomycorrhizal symbiosis establishment (Sebastiana et al. 2014)), Ion torrent, and Illumina (Mardis 2011; Loman et al. 2012).Table 1 resumes some technical specifications of these platforms of next generation sequencing methods.
Roche/454 was the first to achieve commercial success, and uses an alternative sequencing technology known as pyrosequencing. Although this technology offers long reads (~ 600bp), which facilitates the assembly step in comparison with other technologies, it cannot interpret long stretches of the same nucleotides (homopolymers), introducing errors on base calling, resulting in a low throughput (Mardis 2008, 2011; Metzker 2010; Liu et al. 2012; Loman et
al. 2012).
Like 454, Ion Torrent technology exploits emulsion PCR. This platform is based on the detection of hydrogen ions that are released during the polymerization of DNA (Rothberg et
al. 2011; Loman et al. 2012). Also, Ion Torrent technology suffers from errors in
technology (up to 400bp). This technology presents lower accuracy but a lower price per Gigabase, comparatively with IIllumina sequencing (http:// allseq.com, accessed on January 11th 2014; Loman et al. 2012). Despite their reasonable throughput, the main advantage of ion
torrent, relatively to the other sequencing technologies, is the price of the equipment which is much more cheaper than the others (Quail et al. 2012).
Table 1 - Technical specifications of Next Generation Sequencing platforms. (http:// allseq.com, accessed on January 11th 2014;Gilles et al. 2011; Liu et al. 2012; Quail et al. 2012; Loman et al. 2012)
Roche/454
(Titanium) Ion torrent(Proton 318 chip v2) Illumina(Illumina HiSeq 2000)
Equipment price $500k $50k $654k
Sequencing yield per run 700Mb Up to 2Gb 600Gb
Sequencing cost per Gb ~$10k ~$16 ~$41
Observed raw error rate 1.07% >1% 0.26%
Read length ~600bp Up to 400bp ~150bp
Paired-end reads no no yes
Lastly, the Illumina system utilizes a sequencing-by-synthesis approach in which all four nucleotides are added simultaneously to the flow cell channels, along with DNA polymerase, for incorporation into the oligo-primed cluster fragments. Illumina, produces the shortest reads (~150bp, but it is already commercialized equipment that can produce reads up to 300bp, and so, fragments of 600bp), but yields the best throughput/cost relation. Plus, it presents the highest accuracy among the mentioned technologies and is suitable for a large range of applications, such as mRNA sequencing (RNA-Seq) and whole genome sequencing (Mardis 2008, 2011; Metzker 2010).
4.2. RNA-Seq
RNA-Seq is a recent method for both mapping transcriptomes and quantifying transcripts, measuring gene expression, based on the latest developed deep-sequencing technologies. In general, RNA is converted to a library of cDNA fragments with adapters in both ends. Each molecule, with or without amplification, is then sequenced in a high-throughput manner to obtain short sequences from one end (single-end sequencing) or both ends (pair-end sequencing) (Wang et al. 2009). In principle, deep-sequencing technology can be used for RNA-Seq, such as Illumina or Roche 454 systems, which are commonly applied for this
purpose (Wang et al. 2009).
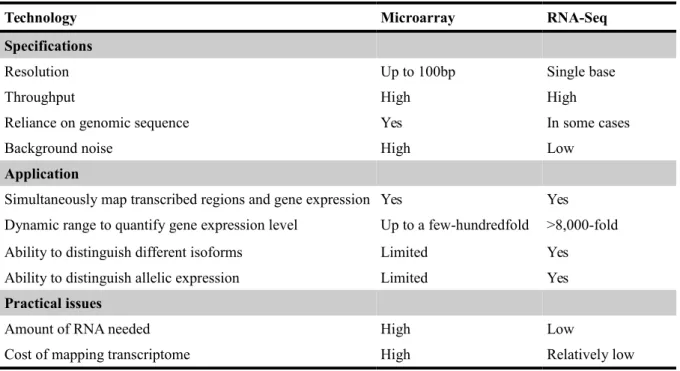
Although RNA-Seq is still a technology under active development, it offers several key advantages over existing technologies. Comparatively with Microarrays (Table 2), RNA-seq is not limited to identifying transcripts corresponding to existing genomic sequences. For example, Illumina based RNA-seq can be used when no reference genome is available as reported for the gene expression analysis of Paulownia infected by Phytoplasma (Paulownia witches'-broom) (Mou et al. 2013). This feature makes it very attractive for non-model organisms with or without reference genome (Wang et al. 2009). Furthermore, RNA-seq is particularly useful for transcriptome assembly and hence to provide information on how exons are connected, and can be used for base variation calling in the transcribed regions. Other advantages of RNA-seq relative to DNA microarrays include: the absence of background noise caused by unambiguity when mapped against a reference genome, bigger sensitivity for low and extremely high expression regions, and a higher accuracy (Nagalakshmi et al. 2010; Xu et al. 2013). Consequently, the volume of expressed genes detected are much higher just as the sensitivity of the different degrees of expression. At last, RNA-seq has shown high levels of accuracy, when confirmed through quantitative real-time PCR.
Table 2 - Differences between Microarrays and RNA-Seq (adapted from Wang et al., 2009)
Technology Microarray RNA-Seq Specifications
Resolution Up to 100bp Single base
Throughput High High
Reliance on genomic sequence Yes In some cases
Background noise High Low
Application
Simultaneously map transcribed regions and gene expression Yes Yes Dynamic range to quantify gene expression level Up to a few-hundredfold >8,000-fold
Ability to distinguish different isoforms Limited Yes
Ability to distinguish allelic expression Limited Yes
Practical issues
Amount of RNA needed High Low
RNA-Seq is the first method that allows the survey of the entire transcriptome in a very high-throughput and quantitative manner, with countless advantages over other methods. This method offers both single-base resolution for annotation and ‘digital’ gene expression levels at the genome scale, often at a much lower cost than microarrays.
4.3. Data Analysis
Like other deep-sequencing technologies, RNA-seq implies several bioinformatic challenges including methods and infrastructures to store and process large amounts of data in a fast, error-free and “less memory consuming” way (Wang et al. 2009; Oshlack et al. 2010). The first step of RNA-seq analysis, after “cleaning” the reads, is to map the reads against a reference genome, or assemble the reads all together (de novo assembly), to unravel the structure of the transcriptome. When a reference genome exists, the assembly process is relatively simple: The reads are mapped against the genome (normaly called “backbone”) originating the transcriptome (Wang et al. 2009; Oshlack et al. 2010). There is a wide choice of software available for this task, which does not require great computing power or time, such as Cufflinks (Garber et al. 2011). These software make the best use of the reference genome, reporting isoforms and identifying novel transcripts. On the other hand, when a reference genome is missing, the task becomes much more complicated: the software for transcriptome assembly without a “backbone” (usually called de novo assembly, as Velvet/Oases (Schulz et al. 2012) and TransAbyss (Garber et al. 2011)) is time and resource consuming, and the final result usually entails a high level of redundancy. This redundancy can be the result of assembly bias, already identified in several de novo assembly programs, or simply the result of a mixed assembly of different isoforms (due to alternative splicing), which without a reference, cannot be distinguished (Wang et al. 2009; Oshlack et al. 2010; Martin & Wang 2011). For reducing this redundancy bias, some software already exists, such as CD-HIT (Li & Godzik 2006; Surget-Groba & Montoya-Burgos 2010; Miller et al. 2012), but sometimes it is not sufficient to remove all the redundancy generated. In a study of Pinus
sp. Transcriptome (Parchman et al. 2010), blastx hits were used for redundancy evaluation,
which unraveled redundant genes when their hits were the same. This strategy can be imperfect, if several genes do not match with any of the databases sequences, hampering their redundancy analysis (Parchman et al. 2010).
transcriptome, for expression quantification. This task can be very difficult, especially in large transcriptomes with short reads (like Illumina sequencing) because reads can match several locations in the transcriptome/genome (Oshlack et al. 2010). Several solutions have been proposed, including the assignment of the multi-matched reads based on the number of reads mapped, to their neighboring unique sequences (for low-copy repetitive sequences) (Mortazavi et al. 2008), or the assignment of multi-matched reads based on the probability of a fragment being derived from a certain transcript, computed by maximum likelihood (Li & Dewey 2011; Garber et al. 2011). This last method is used in the software RSEM, which uses Bowtie (Langmead et al. 2009) for read mapping, and relies on this same method to quantify the expression of different isoforms without a reference genome (Li & Dewey 2011). On the other hand, the use of longer reads, such as those obtained with 454 technology, and paired-end sequencing can help on this multi-matching problem. Also, the advance of the sequencing technologies may proportionate a bigger read length in the near future (Wang et
al. 2009).
Errors in sequencing or polymorphisms can present other types of mapping problems, besides ambiguous locations on the genome/transcriptome. Small differences can be overcome by the software, which can accommodate one or two base differences. However, resolving large differences is much harder, and will usually require great genome annotation for polymorphisms and deeper coverage (Wang et al. 2009).
For a proper RNA-seq expression quantification, considerable sequencing depth is needed. Insufficient depth would result in lower coverage, which lead to a less accurate quantification, in a method that depends directly on read quantity for accurate results (Wang
et al. 2009). In general, the larger the genome, the more complex the transcriptome and
consequently, more sequencing depth is needed for a decent coverage (Wang et al. 2009). For simple transcriptomes such as yeast, with no evidence of alternative splicing, 30 million of 35 nucleotide reads are sufficient to observe transcription for most genes on a single condition (Wilhelm et al. 2008).
Nevertheless, there is no way to better compute the coverage needed for transcriptome sequencing, as the true number and level of different transcript isoforms is not usually known and transcription activity varies greatly across the genome. However, analyzing different conditions can further increase coverage (Wang et al. 2009).
and gain insights about gene regulation, allowing differential gene expression analysis (Garber et al. 2011). RNA-Seq is capable of capturing transcriptome dynamics across different conditions, times and tissues offering a robust and accurate way to compute differentially expressed genes. For calculating the fold change of genes between conditions, several packages are available, with different features adapted to different data. For instance, for diferentially expressed genes analysis of Citrus reticulata infected vs not infected by
Xylella fastidiosa, Cufflinks-Cuffdiff was used for mapping, quantifying and comparing
expression levels, based on a reference genome (Rodrigues et al. 2013); on the other hand, the RNA-seq analysis of catfish (susceptible and resistant) when infected with
Flavobacterium columnare, in different time points was made using CLC Genomics
Work-bench, with a reference trancriptome (Peatman et al. 2013). There are some other packages for expression analysis, mostly R packages, such as EdgeR or Ebseq (Garber et al. 2011; Leng et al. 2013). As it happens with the remaining software for the bioinformatics analysis, there is no perfect software for any type of data. Depending on the software, differential expressed genes calling (DE calling) can be more restrictive or liberal, be indifferent or work better with higher number of replicates or even perform better or worse with the heterogeneity of the samples (Soneson & Delorenzi 2013; Seyednasrollah et al. 2013). It is up to the technician to choose the most adequate software for his analysis.
Although RNA-seq is still a recent technology, its advantages over other transcriptomic methods are quite clear. It can be valuable for understanding transcriptomic dynamics across different conditions, where it allows a robust comparison between them. The biggest challenge of this recent technology is to be able to target more complex transcriptomes in order to identify and track the expression changes of rare RNA isoforms from all genes, even without a reference genome (Wang et al. 2009).
Objectives
The research presented in this Thesis is integrated in project PTDC/AGR-GPL/112217/2009, “Unravelling defense mechanisms underlying coffee resistance to Colletotrichum kahawae” developed at Centro de Investigação das Ferrugens do Cafeeiro/Instituto de Investigação Científica Tropical (CIFC/IICT) and funded by Fundação para a Ciência e Tecnologia (FCT). This work was focused on the bioinformatic analysis of Illumina RNA-seq data obtained from 24 cDNA libraries representing three key points of two Coffea spp.- Colletotrichum
kahawae interaction (compatible vs incompatible), in order to identify coffee genes putatively
involved in the plant resistance mechanism and quantify differences in gene expression during the defense response of coffee to C. kahawae.
The present work intends to contribute to a better understanding of the molecular genetic bases of coffee resistance to C. kahawae as well to increase the available genomic resources of both the fungus and the plant, which can be used in future studies.
Specifically, this research aimed at:
1 – Assembling a coffee transcriptome to use as basis for gene discovery and expression analysis, including a plant-fungus separation pipeline.
2 – Analyzing differential gene expression to characterize the defense response of two coffee genotypes, respectively resistant and susceptible to C. kahawae, during the early stages of the infection process.
3 – Assessing the differences between a custom and a standard RNA-sequencing data analysis and subsequently improving and optimizing data analysis towards the achievement of higher quality results regarding coffee transcriptome assembly and differential gene expression.
Differential expression profiling of coffee resistance vs susceptible response in the early stages of Colletotrichum kahawae infection
Joana Fino1,2*, Andreia Figueiredo3 , Andreia Loureiro2, Elijah K. Gichuru4 , Vitor
Várzea2, Maria C. Silva2, Dora Batista2; Octávio S. Paulo1
1Computational Biology and Population Genomics Group, Centro de Biologia
Ambiental, DBA/FCUL, P-1749-016 Lisboa, Portugal.
2CIFC-Biotrop/IICT-Centro de Investigação das Ferrugens do
Cafeeiro-Biotrop/Instituto de Investigação Científica Tropical, Quinta do Marquês, 2784-505 Oeiras, Portugal
3Centro de Biodiversidade e Genómica Integrativa e Funcional, BioFIG, Faculdade de
Ciências da Universidade de Lisboa (FCUL), Lisboa, Portugal.
4Coffee Research Foundation (CRF), Ruiru, Kenya
Abstract
Coffee berry disease (CBD), caused by the fungus Colletotrichum kahawae, is considered one of the biggest threats to Arabica coffee production, at high altitude, in Africa. Some coffee genotypes are known to be resistant to CBD, but the molecular genetic basis of coffee resistance is still unknown. With the purpose of gaining some insights on coffee resistance process, a RNA Illumina sequencing approach was used to characterize the transcriptional profile of two coffee genotypes, respectively resistant (Catimor 88) and susceptible (Caturra) to C. kahawae, during the early stages of the infection process. Twenty four cDNA libraries were sequenced and data was analysed by ARK-Genomics (UK) in order to assess differential gene expression when comparing inoculated with control samples. Here, a de novo transcriptome assembly was carried out with special care in the inoculated libraries for Coffee-fungus sequence separation. A differential expression pipeline was performed using the de novo assembled coffee transcriptome as reference. Our results were compared with ARK genomics analysis, revealing some variation on the transcriptome and differentially expressed unigenes, influenced by different aproaches. Finally, our analysis allowed the identification of genes putatively involved in coffee resistance, their expression profiles and the pathways in which they are involved.
Keywords: Coffee transcriptome; Defense mechanisms, plant-fungus sequence separation; gene expression
*Corresponding author: Joana Rita Vieira Fino. E-mail: joana.fino@gmail.com; Address: Centro de Investigação das Ferrugens do Cafeeiro (CIFC)/ Instituto de Investigação Científica Tropical (IICT), Oeiras, Portugal;
Telephone: +351927854702
1. Introduction
Coffee is one of the most important commodities in the world economy, accounting for a trade worth of approximately 16.5 billion dollars in 2010 (van Hilten et al. 2011). Coffee growing countries are mainly located in Africa, Central and South America, and Asia where coffee production represents a major income, but particularly in Africa, people can depend entirely on this resource for their livelihoods (Lashermes & Anthony 2007). The commercial production relies mostly on two species: Coffea arabica L. and Coffea canephora Pierre ex A. Froehner, which represent about 70% and 30% of the market supply, respectively (Charrier & Berthaud 1985; Vieira & Andrade 2006). Despite of an increase in coffee production over the years, current production is still insufficient to satisfy the commercial demand (Muñoz et al 2010)
Coffee berry disease (CBD), caused by the pathogenic fungus Colletotrichum
kahawae J.M. Waller & P.D. Bridge, is one of the limiting factors of C. arabica
production. C. kahawae affects several organs of the crop, but major production losses occur when green berries are infected, leading to the formation of dark sunken lesions with sporulation, which results in fruit premature dropping and mummification (Silva
et al. 2006; Hindorf & Omondi 2011).
The first report of this disease goes back to 1922, in Kenya, rapidly disseminating afterwards throughout Eastern Africa (McDonald 1926; Silva et al. 2006).The disease has stronger impact at high altitudes (>1700m) and is still, reportedly, confined to the African continent. However, at such similar altitudes and under appropriate climatic conditions, the disease may be able to colonize other continents (van der Vossen & Walyaro 2009).
Currently, chemical control has been successfully applied but its high cost, makes it unreachable for small scale producers. Crop damages due to CBD, along with chemical control costs, accounts annually for a loss of US$ 300–500 millions in Arabica coffee production (van der Vossen & Walyaro 2009). This severe problem stimulated the development of breeding programmes in several countries (such as Kenya, Ethiopia and Tanzania) giving rise to several resistant coffee varieties for coffee growers (Vossen & Walyaro 1980; Silva et al. 2006). In Kenya, the most relevant example is the hybrid commercial variety Ruiru 11, which was bred for
resistance to CBD and coffee leaf rust (Hemileia vastatrix) using lines of the coffee cultivar Catimor as resistance sources. In resistant coffee plants, , several mechanisms of defense can be observed, both constitutive and induced, working at different stages of the infection (Gichuru 1997): formation of cork barriers, early callose deposition around intracellular hyphae, hypersensitive-like cell death and early accumulation of phenolic compounds in the cytoplasm and the cell walls (Masaba & van der Vossen 1992; Silva et al. 2006; Loureiro et al. 2012b).
Despite the insights gathered so far about the cellular mechanisms of pathogen infection and host resistance, there is still no information about the molecular and genetic basis of coffee resistance to CBD. Gaining new insights into the defense response of C. Arabica to C. kahawae is of the utmost importance.
RNA-Seq has been successfully used to accurately quantify transcript levels, with potential advantages over microarray-based methods (Griffith et al. 2010; Nagalakshmi et al. 2010). Global gene expression analysis has emerged as an important tool for studying how organisms, such as plants, respond to stresses, such as abiotic stress, or biotic stress caused by pathogen infections (Liu et al. 2012; Peatman
et al. 2013). Several studies in other host-pathogen interactions recurring to RNA-seq
approaches, reported the use of the technique to perform de novo transcriptome assembly and annotation, estimate expression of specific isoforms and compare gene expression between a pair of contrasting conditions (Griffith et al. 2010). Successful results were achieved, being an example the case of Citrus reticulata infected by X.
fastidiosa, in which expression analysis identified several defense response-related
genes (Rodrigues et al. 2013). Congruent results were found through the sequencing of Sorghum infected by Bipolaris sorghicola, for which both plant and pathogen transcriptomes were analysed,, identifying genes involved in the host defense response (Yazawa et al. 2013).
In our study, Illumina RNA-seq data was produced for two interactions of Coffea sp –
C. kahawae (compatible and incompatible, corresponding to susceptible and resistant
coffee genotypes), during the early stages of infection, aiming to characterize transcriptional differences. A first analysis by the sequencing company ARK genomics (UK) was made with a pipeline used for a generality of types of data,
(http://soap.genomics.org.cn/SOAPdenovo-Trans.html, last access April 11th 2014)
and EdgeR (Robinson et al. 2009). However, the use of a standard analysis with standard software and parameters may not be perfectly suitable for this data. Yang & Smith (2013) have shown the possible qualities of the unpublished software SOAPdenovo-Trans but the use of a well documented software, with detailed information, and the ability to test different parameters, adjusting the analysis to our data, may be preferable (Wilson et al. 2014). On the other hand, EdgeR, developed for analysis with few replicates, can be too liberal for differential expression assigning (Soneson & Delorenzi 2013; Seyednasrollah et al. 2013). In addition, the potential of deeply exploring and getting more revenue from the data, showed the demand for a different and more focused approach.Therefore, here we report the deployment of a new expression analysis, with a custom workflow, and the subsequent advantages provided on result quality. Also, functional categories and metabolic pathways were identified as putatively involved in coffee resistance to C. kahawae.
2. Material and Methods
2.1. Inoculation of coffee hypocotyls and sampling
Hypocotyls were used as a model material to study CBD because previous studies have shown a correlation between the pre-selection test on hypocotyls and mature plant resistance in the field (r=0.73–0.80) (Van der Vossen et al. 1976). Hypocotyls of the cultivars Catimor 88 (resistant genotype) and Caturra (susceptible genotype) were inoculated with the C. kahawae isolate Que2 (from Kenya), as described by Figueiredo et al. 2013. After inoculation, hypocotyls were vertically placed on plastic trays containing a wet nylon sponge and sprayed with a conidia suspension (2x10⁶/ml)
(inoculated samples) or with water (mock-inoculated hypocotyls – control samples). Afterwards, trays were covered with plastic bags and kept in a Phytotron 750 E at 22ºC in the dark for 24h, and then under a photoperiod of 12 hours during the inoculation time-course.
Hypocotyls were harvested at 24, 48 and 72 hours post inoculation (hpi), corresponding to different stages of the infection process, as described in Loureiro et
al. 2012a: i) differentiation of melanised appressoria (in both coffee genotypes) at 24
genotype) or beginning of hypersensitive cell death (HR) and accumulation of phenols (resistant genotype) at 48hpi; iii) switch to the necrotrophic phase (susceptible genotype) or display of HR and phenols deposition in more that 50% of infection sites (resistant genotype) at 72 hpi. Two independent experiments were conducted and 40 hypocotyls were collected for each coffee genotype (Catimor 88 and Caturra) and time points, both at control and inoculated conditions. Plant material was immediately frozen in liquid nitrogen and stored at -80ºC.
2.2. Extraction and sequencing
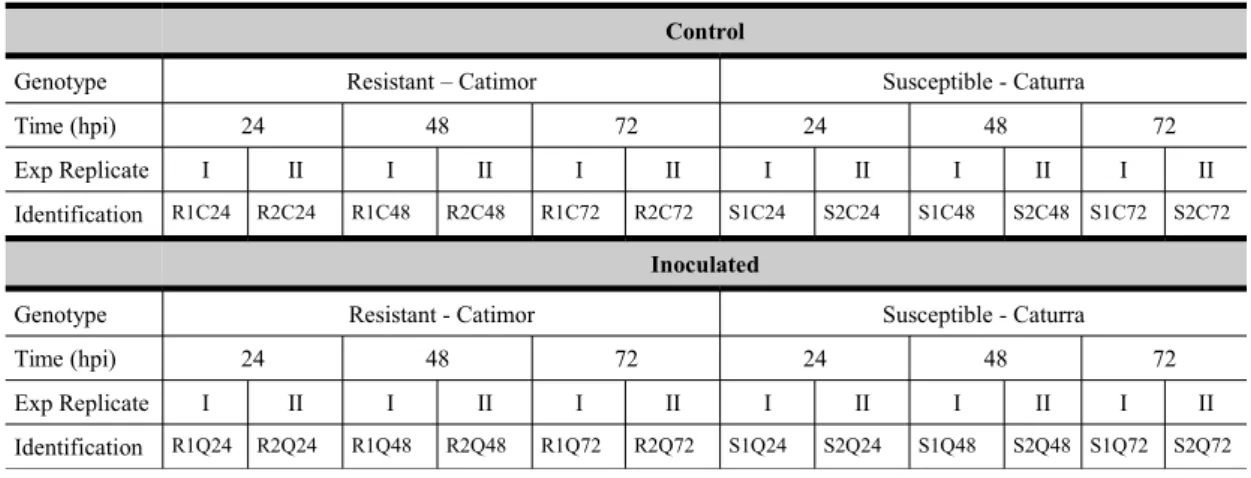
Total RNA was isolated from hypocotyls of all samples with Spectrum™ Plant Total RNA Kit (Sigma-Aldrich, USA), according to the manufacturer’s instructions. Total RNA purity and concentration was measured at 260/280 nm and 260/230 nm using a spectrophotometer (NanoDrop- 1000, Thermo Scientific), while RNA integrity was verified by gel electrophoresis. mRNA-seq library construction for each independent sample and replicate (Table 1), in a total of 24, was performed at ARKs Genomics (UK) for subsequent 100bp paired-end sequencing on a flow cell composed of 4 lanes on a Illumina HiSeq2000.
Table 1 - List of the cDNA libraries produced with information about the genotype, condition (inoculated and control), time-points (hpi-hours post inoculation), experimental replicates and respective identification.
Control
Genotype Resistant – Catimor Susceptible - Caturra
Time (hpi) 24 48 72 24 48 72
Exp Replicate I II I II I II I II I II I II Identification R1C24 R2C24 R1C48 R2C48 R1C72 R2C72 S1C24 S2C24 S1C48 S2C48 S1C72 S2C72
Inoculated
Genotype Resistant - Catimor Susceptible - Caturra
Time (hpi) 24 48 72 24 48 72
Exp Replicate I II I II I II I II I II I II Identification R1Q24 R2Q24 R1Q48 R2Q48 R1Q72 R2Q72 S1Q24 S2Q24 S1Q48 S2Q48 S1Q72 S2Q72
2.3. Read processing
Previously to the assembly steps, two approaches of sequence cleaning were taken: One applying contaminant cleaning, using SeqTrimNext version 2.0.59 (Falgueras et
control reads for simplicity), and other excluding contaminant cleaning, using
TrimGalore! Version0.3.3
(http://www.bioinformatics.babraham.ac.uk/projects/trim_galore/, accessed in March 9th 2013), for the inoculated libraries-derived reads (from now on designated as
inoculated reads), in order to also retrieve C. kahawae´s sequences. For the subsequent step of transcriptome mapping, the inoculated reads were then further processed by SeqTrimNext, for contaminant cleaning.
2.4. Transcriptome assembly and Scaffolding
Two transcriptome assemblies (one with the control reads and another with the inoculated reads) were performed using Velvet version 1.2.08 (Zerbino & Birney 2008) and Oases version 0.2.08 (Schulz et al. 2012), with a k-mer value of 31, a coverage cutoff of 0.377 and a minimum contig length of 200 bp. As a first step, the transcriptome assembled from the inoculated reads was surveyed for the presence of fungus sequences.
Afterwards, in order to complete the reference transcriptome, the contigs from the control reads assembly and the contigs classified as “plant” and “possibly plant” in the plant-fungus contig identification step (from the transcriptome assembly with the inoculated reads) were clustered together using the software CD-HIT-EST version 4.6.0 (Li & Godzik 2006) with a contig identity > 90%.
The clusters were then scaffolded with SSPACE version 2.0 (Boetzer et al. 2011) without extension and a minimal number of read pairs to compute a scaffold of 4.
Due to a highly repetitive transcriptome assembly, a redundancy pipeline using blastn's version 2.2.25+ (Camacho et al. 2009) was applied using the two best hits and the whole transcriptome as both query and subject (discarding the 1st hit since it is
always a self match), with a minimum e-value of 10 , and an alignment length with⁻⁵ at least half of the length of the query sequence (based on Calduch-Giner et al. 2013). The scaffolds with the same hits were grouped as being sufficiently similar to be considered the same. Only the longest sequence of each group was considered as part of the final transcriptome. The entire previous process was run two times, until no hits between different sequences were found.
2.5. Plant-Fungus contig identification
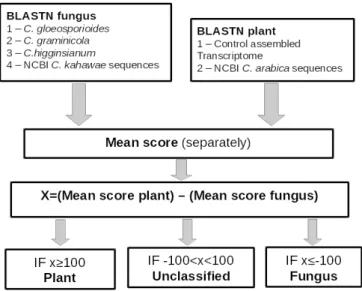
Using the transcriptome assembled with the inoculated reads and skipping the contaminant cleaning step, two methods were used to identify the contigs of plant sequences and the contigs of fungus sequences for subsequent transcript separation: a) Mips-EST3 (Emmersen et al. 2007) that uses triplet nucleotide frequencies to classify contigs as plant or fungus;
b) A pipeline based on Fernandez et al. 2012 that uses blastn searches against i) NCBI coffee and fungus available sequences (ftp://ftp.ncbi.nlm.nih.gov/blast/db/FASTA/, downloaded April 27th 2013); ii) the control assembled transcriptome; and iii) 3
Colletotrichum genome databases:C. gloeosporioides, C. graminicola and C. higginsianum (Sequencing Project, Broad Institute of Harvard and MIT
http://www.broadinstitute.org/, accessed April 20th 2013), with a minimum
e-value of 10 ,⁻⁵ to evaluate the probability that each contig has to be considered plant or fungus.
MIPS-EST3 uses groups of sequences of C arabica and C. kahawae properly identified for the classificator training. The “training” step was performed using nucleotide sequences downloaded from NCBI databases. The trained classificator has a dinucleotide bias distance of genomes of 97.26 which, according to the authors, is
sufficient for a confident separation of the sequences (Emmersen et al. 2007). Finally the classificator is applied tothe transcriptomic contigs and classifies them as either “plant” or “fungus”.
The blast pipeline is based on the X value which is calculated by subtracting the mean score of the best hitsagainst the fungus databases to the mean scores of the best hits against the coffee databases. This value is then used as a measure of similarity with coffee and fungus sequences. Thus, the X is used to classify the contigs in “Plant”, “Fungus” or “Unclassified” categories. Figure 1 shows a scheme of the process. Finally, the results of the two methods were crossed and the contigs were separated into 5 categories: Plant or Fungus when the results of the two methods were concordant, Potentially plant or Potentially fungus when the blast pipeline lacked classification and uncategorized when the results of both methods were contradictory.
2.6. Read mapping, expression quantification and differential expression analysis
For the read mapping and expression quantification, both the transcriptome previously assembled and the coffee ESTs from a 454 assembly (Santos 2011) were used, separately, as reference. The program used for this task was Rsem version 1.2.10 (Li & Dewey 2011). This software runs Bowtie version 0.12.7 (Langmead et al. 2009) for the different libraries separately, to find all the possible alignments, with a maximum of 3 mismatches per read.
For differential expression estimations, the R package from Bioconductor, EBSeq version 1.1.5 (Leng et al. 2013) was used. Only unigenes with a posterior probability of being differentially expressed (PPDE) > 0.95 and a -1.0 ≥ log2 fold change ≥1.0 were considered as such.
2.7. Sequence Annotation
De novo functional annotation of the coffee transcriptome was obtained by similarity
using Rapsearch2 (Zhao et al. 2012), Blast2GO (Conesa et al. 2005) and custom made scripts. Rapsearch2 was used to search against functional proteins from the KOG (euKaryotic Orthologous Groups) database which is a component of the Clusters of Orthologous Groups (COG) database (Tatusov et al. 2003), restricted by
Figure 1 – Schematic diagram of the blastn's pipeline for the Plant-Fungus contig identification. Nucleotide blast was performed against each of the databases, mean score and X value calculated, and finally the contigs were classified as Plant, fungus or unclassified.