UNIVERSIDADE
DO
ALGARVE
Faculdade de Ciˆencias e TecnologiaA Computational Tool for Peptide Mass
Fingerprinting
Eman Saad Ali AL-Hawri
Mestrado em Engenharia Inform´atica
UNIVERSIDADE
DO
ALGARVE
Faculdade de Ciˆencias e TecnologiaA Computational Tool for Peptide Mass
Fingerprinting
Eman Saad Ali AL-Hawri
Tese orientada por
Ant´onio dos Anjos
Tese coorientada por
Gareth Pearson
Mestrado em Engenharia Inform´atica
2013
A Computational Tool for Peptide Mass
Fingerprinting
Declarac¸˜ao de autoria de trabalho Declaro ser a autora deste trabalho, que ´e original e in´edito. Autores e trabalhos consultados est˜ao devidamente citados no texto e constam na listagem de refer´encias inclu´ıda.
Copyright c 2013, por
A Universidade do Algarve tem o direito, perp´etuo e sem limites geogr˜af´ıcos, de arquivar e pub-licar este trabalho atrav´es de exemplares impressod reproduzidos em papel ou de forma digital, ou por qualquer outro meio conhecido ou que venha a ser inventados, do o divulgar atrav´es de reposit´orios cient´ıficos e de admitir a sua c´opia e distribuic¸˜ao com objetivos educacionais ou de investigac¸˜ao, n˜ao comerciais, desde que seja dado cr´edito ao autor e editor
ii
Abstract
Protein identification using Mass Spectrometry (MS) is essential in the study of proteomics. Two popular techniques are used in the identification: Tandem Mass Spectrometry (MS/MS) and Peptide Mass Fingerprinting (PMF), which is considered in this work. PMF is widely used in the proteomics field. It is faster and more economic when compared to MS/MS.
This work focuses on the development of a computational tool for protein identification using PMF data. The main objective for any PMF tool is to identify the correct protein (if it exists) by searching a peak list, produced by MS, against a protein database. However, one of the great challenges to these tools is related to the size of the databases that result in many random matches. In fact, the main difference between these tools is the scoring method which is respon-sible of minimizing these random matches. Therefore, a review of PMF tools and their scoring methods is presented and discussed.
There are many tools on the Internet (both commercial or academic) for PMF protein identi-fication using public databases. These tools do not offer a locally installable version, and do not allow the use of in-house databases, a feature that is of great importance to biologists who work on non-model systems. In contrast, the tool developed in this work is free, can be installed locally, and can be used with both public and local databases. Additionally, it supports different sorts of protein modifications and contaminants suppression, features that are not available by some of the existing tools.
A new scoring method is proposed and incorporated in the proposed tool. The proposed tool is compared with two of the most popular software packages (commercial and academic), showing a good accuracy and being very competitive with the most popular and robust commercial software (Mascot). The developed prototype is platform-independent and is very easy to install. To allow users to work and interact with the system in an easy-to-use environment, a friendly graphical user interface is developed to allow them to manage their files very efficiently. In addition, it can work with single or multiple query files to support different work scales. The features this new tool offers make it an important assist to the biological laboratories concerning the PMF task.
iv
Resumo
A identificac¸˜ao de prote´ınas utilizando Espectrometria de Massa (MS) ´e essencial no campo da prote´omica. H´a duas t´ecnicas muito populares utilizadas para a identificac¸˜ao: Tandem Mass Spectrometry (MS/MS) and Peptide Mass Fingerprinting (PMF), sendo esta ´ultima a abordada nesta tese. A PMF ´e vastamente utilizada no campo da prote´omica. Quando comparada com a MS/MS, esta ´e mais r´apida e mais econ´omica.
O foco deste trabalho ´e o desenvolvimento de uma ferramenta computacional para a identificac¸˜ao de prote´ınas utilizando dados resultantes da PMF. O objetivo principal de qualquer ferramenta de PMF ´e o de identificar a prote´ına correta (se esta existir) por procurar uma lista de picos, produzidos atrav´es de MS, numa base de dados de prote´ınas. No entanto, um dos grandes de-safios destas ferramentas prende-se com o grande tamanho das bases de dados, que levam a que haja muitos matches aleat´orios. De facto, a principal diferenc¸a entre as ferramentas existentes ´e o m´etodo de scoring, o qual ´e respons´avel por minimizar os matches aleat´orios. Desta forma, apresenta-se uma revis˜ao e faz-se uma discuss˜ao das ferramentas de PMF e respetivos m´etodos de scoring.
Existem v´arias ferramentas na Internet (tanto comerciais como acad´emicas) para identificac¸˜ao de prote´ınas atrav´es de PMF utilizando bases de dados p´ublicas. Estas ferramentas n˜ao ofere-cem uma vers˜ao que permita a instalac¸˜ao local, e n˜ao permitem a utilizac¸˜ao de bases de dados caseiras, uma funcionalidade que ´e de grande importˆancia para bi´ologos que trabalham em sistemas n˜ao-modelo. Em contraste, a ferramenta desenvolvida neste trabalho, al´em de livre, pode ser instalada localmente, e pode ser utilizada tanto com bases de dados p´ublicas como caseiras. Al´em disso, tamb´em suporta diferentes tipos de modificac¸˜oes de prote´ınas e supress˜ao de contaminantes, funcionalidades n˜ao dispon´ıveis em algumas das ferramentas existentes. Prop˜oe-se um um novo m´etodo de scoring e incorpora-se o mesmo na ferramenta proposta. Esta ´e comparada com dois dos mais poderosos pacotes de software dispon´ıveis, sendo que a ferramenta proposta apresenta uma boa prestac¸˜ao e ´e bastante competitiva com o mais pop-ular e robusto software comercial (i.e. Mascot). O prot´otipo desenvolvido ´e independente da plataforma onde corre e de muito f´acil instalac¸˜ao. Para permitir que os utilizadores
pos-sam trabalhar e interagir com o sistema de uma forma simples, foi desenvolvida uma interface gr´afica bastante amiga do utilizador. Esta permite a gest˜ao dos ficheiros de projeto de forma muito eficiente. Adicionalmente, a ferramenta proposta pode trabalhar com ficheiros de uma ou m´ultiplas queries. Esta ferramenta e as funcionalidades oferecidas pela mesma, contribuem de forma relevante para assistir os laborat´orios da ´area da biologia no que diz respeito `a PMF.
vi
Keywords: Protein, peptide, mass, molecular weight, fingerprint, Mass Spectrometry, FASTA, amino acid, enzyme, digestion, trypsin.
viii
Acknowledgments
I would like to thank my advisors Prof. Ant´onio dos Anjos and Prof. Gareth Pearson for their support, patience, guidance, and encouragement throughout this work. Many thanks for Miss
Catarina Mota for her help, and great comments to improve this work. I would like to dedicate this work to:
My parents for their endless love and support, and for giving me the strength throughout my life.
My husband for his support, love, and for teaching me the real life. My brothers and sisters for their love and emotional encouragement.
Contents
Abstract ii
Resumo iv
Acknowledgments viii
Contents x
List of Figures xiv
List of Tables xvi
Acronyms xix
1 Introduction 1
1.1 Overview . . . 3
1.2 Motivation . . . 3
1.3 Protein Identification . . . 3
1.4 Peptide Mass Fingerprinting . . . 4
1.4.1 Problems in PMF . . . 5
1.5 Protein Preparation . . . 6
1.6 Protein Digestion . . . 6
1.7 Mass Spectrometry (MS) . . . 7
1.7.1 MALDI-TOF . . . 8
1.8 Problems Associated with Biological Processing . . . 8 x
1.8.1 Protein Contaminants . . . 9
1.8.2 Post-Translational Modification (PTM) . . . 9
1.9 Protein Sequence File Format . . . 9
1.10 Protein Databases . . . 10
1.11 General Search Parameters . . . 11
1.12 Scoring Methods . . . 12 1.13 Popular Tools . . . 13 2 Related Work 15 2.1 MOWSE . . . 15 2.1.1 Limitations . . . 16 2.2 Mascot . . . 16 2.2.1 Mascot Scoring . . . 16
2.2.2 Mascot Score Significance . . . 17
2.2.3 Limitations . . . 17 2.3 ProFound . . . 18 2.3.1 ProFound Scoring . . . 19 2.3.2 ProFound Confidence . . . 20 2.3.3 Limitations . . . 20 2.4 MS-Fit . . . 20 2.4.1 Limitations . . . 21 2.5 ProteinDecision . . . 21 2.5.1 Limitations . . . 23
2.6 Statistical Assessment for Mass-spec Using PMF . . . 23
2.6.1 Limitations . . . 24
3 Data Preprocessing 25 3.1 Peak List Preprocessing . . . 25
3.2 Protein Database Preprocessing . . . 26
3.2.1 Unknown Symbol Processing . . . 26
xii CONTENTS
3.2.1.2 ‘X’ Replacement Approach-2 . . . 27
3.2.2 Ambiguous Symbols Processing . . . 30
3.2.3 Database Size Handling . . . 31
3.2.4 Digestion . . . 31
3.2.5 Mass Calculations . . . 32
4 Proposed Method 35 4.1 PMF Main Steps . . . 35
4.2 Scoring . . . 36
4.2.1 MOWSE Scoring Algorithm . . . 37
4.2.2 Score Significance . . . 38
4.2.3 Proposed Scoring Method . . . 39
5 Results and Discussion 41 5.1 Simulated Peptide Data and Noise Manipulation . . . 41
5.2 Tests . . . 42 5.2.1 Parameters . . . 42 5.2.2 Test Criteria . . . 45 5.2.3 Software Comparison . . . 46 5.2.4 Test No. 1 . . . 46 5.2.5 Test No. 2 . . . 46 5.2.6 Test No. 3 . . . 49 5.2.7 Discussion . . . 52 6 Conclusion 55 6.1 Future Work . . . 56 A Prototype 57 A.1 Prototype . . . 57
A.1.1 The Main Window . . . 57
A.1.3 Results . . . 61
B UML Classes 63
List of Figures
1.1 The chemical structure of amino acids. The primary structure is read from the N-terminal to the C-N-terminal. Each amino acid has a different structure in its side chain (R group). Amino acids all have a carboxylic acid on one end of the main
carbon chain and an amine group on the very next carbon atom in the chain. . . 2
1.2 PMF steps flowchart. . . 5
1.3 Digestion types. . . 7
1.4 FASTA format for one protein sequence. The first character of the description line is the greater-than (>) symbol. The number of sequences in the input data is deter-mined by the number of lines beginning with a ‘>’. . . 10
2.1 Mascot program form for peptide mass fingerprinting. . . 17
2.2 ProFound program form. . . 18
2.3 MS-Fit program form for peptide mass fingerprinting. . . 21
3.1 Replace Xs with the standard amino acids to get valid sequences. . . 27
3.2 Replacement process for invalid codes ‘X’, ‘Z’, and ‘B’ with their corresponding standard amino acid codes to get valid sequences . . . 31
3.3 Processing the database proteins one-by-one. . . 32
4.1 PMF flowchart which represents the steps performed by this work. . . 36
4.2 Columns represent database protein molecular weights, whereas the rows represent the database peptide molecular weights. . . 37
A.1 Graphical user interface main window. . . 58 xiv
A.2 Toolbar commands explanation. . . 59
A.3 Project panel contents. . . 60
A.4 Matching parameters. . . 61
A.5 Matching report. . . 62
B.1 Protein and Peptide classes. . . 63
B.2 Protein and ProteinProcessor classes. . . 64
B.3 Protein, ReportModel, and ProteinChecker classes. . . 65
B.4 Protein and ProteinMatcher classes. . . 66
B.5 PMFproj, Match, and Protein classes. . . 67
B.6 Ambiguous Symbol and AmbiguityResolver classes. . . 68
B.7 DigesterAndMassCalculater and Protein classes. . . 69
List of Tables
1.1 Amino acid codes. The first column contains the name of the amino acid, the second and third columns contain the corresponding amino acid code with three and one letters respectively. . . 2 1.2 Protein databases. . . 11 3.1 Ambiguous and unknown symbols and corresponding one and three letters codes. . 30 3.2 Amino acid residues and their Monoisotopic and Average masses. . . 33 4.1 Peptides arrangement based on their mass value. . . 38 5.1 Protein masses before and after a simulated contamination process that removed
70% of the original peptide masses and added random masses corresponding to 30% of the original mass values. Cells in pink refer to the masses that will be removed, while cells in blue refer to the masses that have been added to the protein. 43 5.2 Parameters used in the software comparisons and respective values. The first
col-umn lists the parameter name, the second lists commonly used values, and the third lists the values used in the comparisons. . . 45 5.3 Software packages comparison. Advantages and drawbacks for each software. . . . 47 5.4 Results of PMF using Mascot, Ms-Fit, and the proposed software packages.
Col-umn Peptides Number indicates the total number of peptides of the protein sample. Column Rank indicates the rank order of protein, and column Matched Peptides indicates the number of peptides of the protein hit that match to the experimental peptides. . . 48
5.5 Results of Mascot, Ms-Fit, and the proposed tool when contaminating each protein with 10% additive noise and three different data removal rates. Column Peptides Numberindicates the number of peptides for the protein sample, column Rank in-dicates the rank order of the source protein, and column Matched Peptides inin-dicates the number of matched peptides for that protein. . . 50 5.6 Mascot, Ms-Fit, and the proposed tool statistical information that represent the hits
and miss for protein samples. Number of Finding indicates the number of proteins that the software found from the samples set listed in 5.5. Number of First Ranks indicates the number of correct proteins reported as a first rank. Number of Missing indicates the number of unidentified proteins by the software. Top 5 Ranks indicates the number of proteins that the software reported on top 5 ranks. . . 51 5.7 Results comparison between MOWSE and the proposed method. Column Peptides
Numberindicates the number of peptides for the protein sample, column Rank in-dicates the rank order of the source protein, and column Matched Peptides inin-dicates the number of matched peptides for that protein. . . 51 A.1 Application requirements and availability. . . 57
PMF Peptide Mass Fingerprinting MS Mass Spectrometry
Da Dalton
PTM Post-Translation Modification MW Molecular Weight
MALDI Matrix Assisted Laser Desorption/Ionization TOF Time-Of-Flight
NCBI National Center for Biotechnology Information MS/MS Tandem mass spectrometry
GUI Graphical user interface
2-DE Two-dimensional gel electrophoresis
Chapter 1
Introduction
Bioinformatics is an interdisciplinary field that relies on mathematics, computer science and biochemistry to analyze biological data. It provides a set of practical tools and methods to biologists for studying and analyzing these data very effectively. For example, DNA, RNA, and protein sequences are, usually, massive, and manual processing is very time-consuming and error-prone, if not impossible. Therefore, computer-based solutions are extremely necessary to perform such tasks.
A Protein can be defined as a large molecule made up of amino acids. Linear strings of amino acids in each protein are arranged in a specific way that allows it to fold into a certain shape which in turn determines its function [22]. The primary elements of amino acids are carbon, hydrogen, oxygen, and nitrogen. Some other secondary elements may be found in the side chains of the amino acids string. Figure 1.1 illustrates the amino acids’ structure while Table 1.1 shows a list of standard amino acid codes.
In practice, proteins consist of very long amino acid chains. They can be digested (cut) into smaller fragments (peptides) by proteolytic enzymes, some of which have well defined digestion patterns. For example, the enzyme trypsin is commonly used in MS experiments because of its features: specificity, availability, and low cost [46]. Usually, peptides contain a sequence ranging from 2 to 50 amino acids. This range allows the peptide to be analyzed and identified easily and effectively by MS, using one of several available methods.
Figure 1.1: The chemical structure of amino acids. The primary structure is read from the N-terminal to the C-N-terminal. Each amino acid has a different structure in its side chain (R group). Amino acids all have a carboxylic acid on one end of the main carbon chain and an amine group on the very next carbon atom in the chain.
There are two major methods used in the protein identification process: peptide mass finger-printing (PMF) [22], which is the focus of this thesis, and tandem mass spectrometry (MS/MS) [26].
Table 1.1: Amino acid codes. The first column contains the name of the amino acid, the sec-ond and third columns contain the correspsec-onding amino acid code with three and one letters respectively.
Amino-Acid 3-Letter 1-Letter Amino-Acid 3-Letter 1-Letter
Alanine Ala A Arginine Arg R
Asparagine Asn N Aspartic acid Asp D
Cysteine Cys C Glutamic Glu E
Glutamine Gln Q Glycine Gly G
Histidine His H Isoleucine Ile I
Leucine Leu L Lysine Lys K
Methionine Met M Phenylalanine Phe F
Proline Pro P Serine Ser S
Threonine Thr T Tryptophan Trp W
Tyrosine Tyr Y Valine Val V
1.1. OVERVIEW 3
1.1
Overview
A biological background is presented in the rest of this chapter. Chapter 2 presents a literature review of methodologies and tools used in PMF. The matching and scoring approaches are described in this chapter. In Chapter 3, the preprocessing of the input data is described. This includes the methodologies used in handling ambiguous amino acids in protein databases. The proposed method is presented in Chapter 4. Chapter 5 presents and discusses the experimental results. The conclusion and the future work are covered in Chapter 6.
1.2
Motivation
This work focuses on creating a computational tool for protein identification by mass spectrom-etry (MS) using peptide mass fingerprinting (PMF) [22]. There are many existing tools in the web (Section 1.13) to perform PMF but, most of them have the following limitations:
• In order to have a locally installed copy of the tool, the client must pay an expensive license. Many laboratories cannot afford it.
• The query space is restricted to public protein databases, only.
The aim of this work is to provide an efficient, user-friendly, and reliable software tool (Ap-pendix A, B) for the identification of protein samples generated with PMF. That allows biologist to have a free tool for local search of any protein database.
1.3
Protein Identification
In proteomics, protein identification is the process of defining the probable primary sequence of an experimental sample protein by relating it to a specific database protein sequence. A pro-tein can be identified from its peptide composition after digestion into fragments, i.e. search in databases for proteins whose peptide compositions (masses) are closest to the peptide compo-sitions of the given experimental protein. In general, this process is based on several phases: extraction, separation, digestion, mass spectrometry, matching, and score calculation. In the
extraction phase, samples are extracted from a certain organism. These samples are separated by using specific techniques, e.g. Two-dimensional gel electrophoresis (2-DE) [34]. Separated proteins are digested by specific proteases into peptides and mass spectrometry is then per-formed for each unknown (separated/ isolated) protein to produce a mass spectrum. Finally, these peptide masses are searched against a database of theoretical proteins by matching and using a scoring algorithm to find the best identification of the input masses [47]. In this phase, the design of the scoring method determines the quality of the identification. It is worth pointing out that, the steps up to Mass Spectrometry are experimentally performed.
1.4
Peptide Mass Fingerprinting
PMF is one of the most important and widely used methods for protein identification using mass spectrometry [45, 48, 21]. The following is a brief explanation of how PMF works to identify the protein from a database. It involves the following steps:
• Separate the proteins, e.g. using 2-D gel electrophoresis.
• Digest the separated proteins into peptides with an enzyme that cleaves specific amino acid bonds.
• Perform Mass Spectrometry (MS) analysis to determine peptide masses, usually Matrix assisted laser desorption/ionization Time-of-flight (MALDI-TOF). The resulting MS data makes up the experimental data (peak list).
• The experimental data is searched against in silico digested protein database entries: – Compare the peptide masses of each protein in the database with the peptide masses
of the experimental protein. This involves the digital (in silico) digestion and peptide mass calculation of each protein in the database .
– Calculate the scores and measure how well the experimental proteins match the theoretical proteins.
1.4. PEPTIDE MASS FINGERPRINTING 5
– Present the results in which the best hits (proteins with highest scores), along with their scores and significance, are shown.
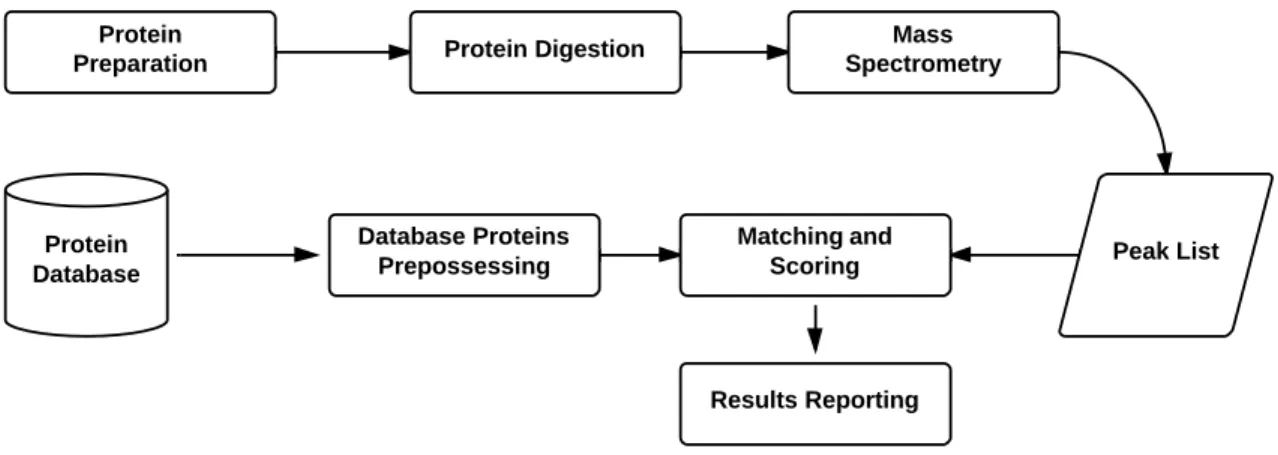
Figure 1.2 illustrates the steps needed for protein identification using PMF.
Figure 1.2: PMF steps flowchart.
The most significant parameters in PMF that can affect the results of identification are: the number of matched masses, mass error threshold, percentage of matched masses that covers the full sequence, post-translation modification, and the number of missed cleavages (Section 1.6) [41].
1.4.1
Problems in PMF
Protein identification using PMF has some constraints [1]:
• The experimental protein should exist in the search database. A new or modified protein may not be identified (correctly).
• Large proteins in the database have more peptides than smaller ones. Therefore, the probability of large proteins to match the experimental peptides will increase.
• Smaller peptides in the database have higher chance to match experimental peptides when compared to larger peptides.
However, many new software packages have developed an advanced statistics and probability based scoring to overcome these problems.
1.5
Protein Preparation
Sample preparation involves removing the contaminants and reducing the complexity of a pro-tein sample [29]. Careful preparation is very important for performing mass spectrometry successfully. To achieve this task, tools like sodium dodecyl sulfate polyacrylamide gel elec-trophoresis (SDS-PAGE) or Reversed-Phase liquid chromatography (LC) can be used. These tools may be considered as an interface between biology and MS. They are used to purify proteins before they undergo MS, by cleaning, separating, quantifying, and assessing the post-translational modification (PTM) [25].
1.6
Protein Digestion
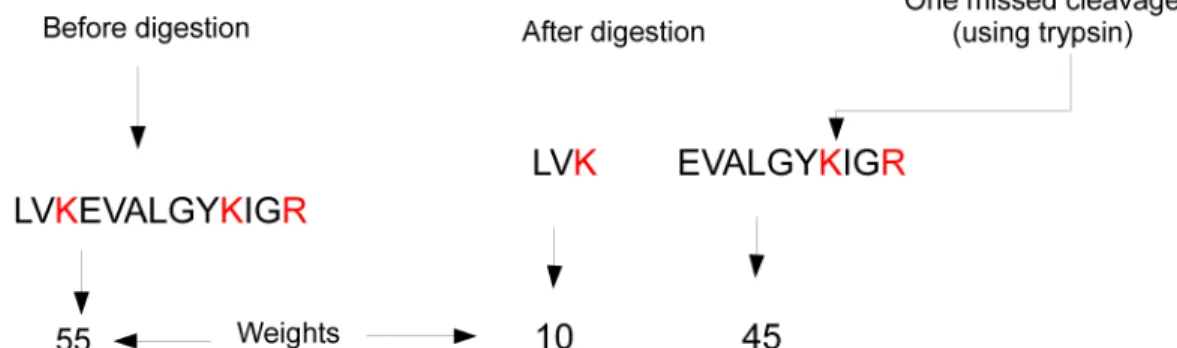
Digestion is the task of cutting the protein into peptides by using a specific enzyme. The most common enzyme is Trypsin, because it produces a cleavage with high specificity, availability, and low cost [46]. It converts the proteins into peptides by cleaving them at the carboxylic side of Arginine (K) and Lysine (R) residues [47, 33]. It is important to carefully perform this task, because missed cleavages make it difficult to successfully identify the protein. Experimental proteins are digested in a natural biological process. That process may fail sometimes i.e. one or more cleavages may be missed. In this case, the protein will contain fewer peptides and consequently the weights (resulting from the MS spectra) of these peptides will be affected. On the other hand, digital digestion for theoretical proteins (database proteins), can be done without any flaw. Therefore, computational tools should include a parameter to simulate the missed cleavages allowing the enhancement of the matching process. Figures 1.3a and 1.3b demonstrate a perfect digestion and a digestion with some missing cleavages.
1.7. MASS SPECTROMETRY (MS) 7
(a) Incomplete digestion. Trypsin is used, it cleaves the amino acids chain after Argi-nine (K) and Lysine (R) in red color. In the figure one cleavage site remains after digestion.
(b) Complete digestion. Trypsin is used, it cleaves amino acids chain after Arginine (K) and Lysine (R) in red color. No missed cleavage is shown in the figure.
Figure 1.3: Digestion types.
1.7
Mass Spectrometry (MS)
Mass Spectrometry of a gel-separated protein is a protein identification technology that plays a major role in analyzing biological samples [39]. MS produces a spectrum of peptide sample masses by ionizing the digested protein sample and separating the resulting ions according to their mass-to-charge ratio, known as m/z, where m is the mass of the ion in Daltons, and z is the charge of the ion [32]. These ions, produced by mechanisms like Matrix assisted laser desorption/ionization (MALDI) [42] and electrospray ionization (ESI) are separated (e.g. by Time-of-flight MS analysers) to produce a mass spectrum. [47]. These two techniques are the core of MS and are usually implemented as high-throughput techniques.
1.7.1
MALDI-TOF
MALDI is a soft ionization technique that uses a short laser pulse of nitrogen gas instead of continuous laser to ionize molecules in a matrix [20, 24]. It is useful in protein identification because it is suitable for determining the mass of the intact peptide. These molecules (protein and peptide) are easily broken and tend to fragment when ionized by other ionization tech-niques. Furthermore, MALDI has other features that make it the first choice when it comes to protein study [23]:
• It requires relatively less intense sample preparation.
• Its matrix has resistance to the interferences caused by salts and detergent.
• It facilitates the data interpretation by producing peptides containing only one charge and shows only one peak in spectrum.
MALDI is attached to a time of flight (TOF) analyzer which calculates the time that the molecules take to move a fixed distance.
How MALDI works: It screens the peptide masses that are tryptic digested. The protein or peptide is placed on a target plate and merged with an appropriate matrix on this plate. The mixture of protein or peptide sample and matrix are crystallized and then irradiated in vacuum environment with a short laser pulse, which leads to release of matrix, and sample ions from the plate. The ions are then accelerated in TOF analyzer [37].
1.8
Problems Associated with Biological Processing
Protein identification is susceptible to contaminants and modifications during biological pro-cessing. Consequently, identifying the correct protein becomes more difficult. The following subsections explain some contaminants and modifications that may occur in protein samples.
1.9. PROTEIN SEQUENCE FILE FORMAT 9
1.8.1
Protein Contaminants
The MS masses of the protein sequences may include masses of contaminants. When con-taminant masses are used in database search, it increases both false positive and false negative results. Therefore, when the contaminants are identified and removed from the protein sam-ple, the probability of getting an accurate match will be increased. Possible contaminants can originate from:
• Keratin, which is a common hair and skin protein contaminant. • Protease used in digestion e.g. trypsin.
• Sample chemicals.
• MALDI matrix and the electrophoresis components.
Despite the unknown identity of some contaminants, they can be observed in a large number of samples. Furthermore, when the same masses exist in many samples, it is a good indicator that those masses come from contaminants [9, 52]. It is important to remove any mass related to Keratin if the sample is not human, because Keratin is abundant in human hair and skin. MS masses should be as clean as possible before starting the database search.
1.8.2
Post-Translational Modification (PTM)
Post-translational modifications are steps in the protein generation process in which the pro-tein may undergo cleavage, extension, and other processes, including chemical modifications on some amino acids. It essentially affects the protein function due to the changes made to its chemical structure. Identification, characterization and mapping of these modifications is critical for understanding the function of proteins in a biological context [27, 10].
1.9
Protein Sequence File Format
Because of the fast growth of biological data (and databases), manual processing of sequences becomes very laborious and error-prone. Accordingly, more flexible, efficient, faster, and easier
processing tools become necessary. Automated tools have been developed to confront this massive growth of data. These tools process protein sequences automatically using algorithms, methods, and computer programs to organize and display them in a clear and understandable format [38, 30]. Protein sequences can be found in different formats, such as FASTA, GCG, and plain text, depending on the database they belong to. Nevertheless, the most popular format of these is still FASTA. Figure 1.4 shows an example of an entry in a FASTA file, which is considered in this thesis. This kind of file starts with one description line followed by lines of sequence data.
Figure 1.4: FASTA format for one protein sequence. The first character of the description line is the greater-than (>) symbol. The number of sequences in the input data is determined by the number of lines beginning with a ‘>’.
1.10
Protein Databases
Biological databases, either locally stored or published online, store a cumulative genetic knowl-edge about sequences, structures, and functions of biological data. The more reliable, complete, and well organized the database is, the better the results obtained through searching and match-ing processes [18]. Nowadays, there are many on-line databases that supply an essential support for protein identification. These databases not only store a series of protein sequences, but also contain annotation information for these sequences. However, databases may have limitations
1.11. GENERAL SEARCH PARAMETERS 11
that result in bad matching between experimental data and theoretical data, such as incomplete data, particularly where non-model organisms are being studied, for which public data are un-available [33]. some popular protein databases are listed in Table 1.2.
Table 1.2: Protein databases.
Database Features Website
GenBank (NCBI) Has an annotation system Has Blast algorithm
It is a part of the Interna-tional Nucleotide Sequence Database Collaboration
http://www.ncbi.nlm.nih.gov/genbank/
Protein Identification
Resource (PIR) Has an annotation system http://pir.georgetown.edu/
UniProtKB/Swiss-Prot Has annotation system http://web.expasy.org/docs/swiss-prot
1.11
General Search Parameters
Almost all tools that perform PMF share the same general parameters. These are listed as follows:
• Enzyme: It is used to cut the protein into fragments. Many enzymes are available to perform the digestion. A good digestion does not cut the protein into very small peptides because it would result in a lot of random matches. It is usually better to have long peptides to get more specific results. Trypsin is the most popular enzyme used in the digestion process due to this nice property.
• Missed Cleavages: Sometimes, in the experimental digestion, some sites (usually one or two) are missed. This parameter is a positive integer value that represents the maximum allowed number of missed cleavage sites during the digital digestion.
• Mass Tolerance: It is a user defined threshold that represents the acceptable difference between the experimental masses and theoretical masses through the comparison step [6]. It may be entered as:
1. % : Fraction represented as percentage. 2. mmu : Milli mass unit.
3. ppm : Fraction represented as parts per million.
4. Da : Abbreviation for Dalton. It is the absolute unit of mass.
• Fixed Modifications: A list of fixed modifications that may be selected by user. This pa-rameter represents the chemical modifications known to occur in the sample. A common fixed modification is carboxymethyl (C).
• Variable Modifications: A list of variable modifications that may or may not occur in the sample. Therefore, the masses for each modified symbol are calculated twice, with modification and without modification. A common variable modification is oxidation (M).
• Query (peak list): Consists of either a data file, or a list of peptide mass values and respective intensities (optional) typed in a query window. If the intensities of the masses are supplied, some tools can use them to get a better score by selecting the mass values with higher intensities.
1.12
Scoring Methods
The core of any protein identification process is its scoring method. Its quality determines the efficiency of the identification method. Old scoring methods were based on the number of matched masses (sample masses and database masses) [36]. This kind of scoring method is used in PeptIdent [3]. It was sufficient for PMF protein identification several years ago, but no longer due to the increase of database sizes. Most of new scoring algorithms are based on statistics and probabilities because of the advantages these systems provide. For example MOWSE, ProFound, Ms-Fit, and Mascot tools are based on statistical frameworks.
1.13. POPULAR TOOLS 13
1.13
Popular Tools
In the last few years, proteomics has rapidly grown along with the development of protein identification and quantification techniques. Some of these techniques are new, while others are based upon older ones. Protein identification software effectively contribute to the study and exploration of information from 2-D gels using mass spectrometry. Recently, many existing tools such as ProFound [54], PeptideMass [16] , Mascot [13], and Ms-Fit [7] were developed. Some of these tools do not perform the complete protein identification pipeline, while others may perform the whole steps needed for protein identification. For example, PeptideMass just cleaves the a protein sequence into peptides with the specified enzyme and reports the masses of these peptides. On the other extreme, Mascot can perform the whole process needed for identification. It sequentially performs the following steps:
1. Cleave database protein into peptides.
2. Calculate the masses for the resulting peptides.
3. Apply the comparison between experimental masses and the masses resulting from the previous step.
4. Calculate scores to determine the accuracy of the matching.
Chapter 2
Related Work
PMF is commonly used in many biological laboratories around the world. Therefore, many existing PMF software packages became commercially successful. The key to the success of each software is its scoring method. A good scoring function takes into account several factors: mass tolerance, database size, number of missed cleavages, coverage of matched peptides, and number of variable modifications. These factors must be applied in such a way that maximizes the probability that the top-ranked database matches are true candidate proteins. At the same time, scores for non-matching proteins should be minimized. [47]. This chapter introduces a review of some popular tools and their scoring methods, if available.
2.1
MOWSE
MOWSE (MOlecular Weight SEarch) is an important scoring method in protein identification, used in PMF [51]. Several software packages now are built on this method, such as Ms-Fit and Mascot [36]. This method is based on the achievable matches between the theoretical proteins and the MS sample, and the occurrence of molecular weight for each theoretical peptide [47]. MOWSE takes into account some aspects like protein size and the frequency of each peptide in the database through scores calculation [3]. On the other hand, it does not provide a confidence measure for these scores. Because MOWSE will serve as the starting point of a method proposed in this work, it will be described in Section 4.2.1 in detail.
2.1.1
Limitations
MOWSE is a scoring method that has the following limitations:
• Can not filter random matches sufficiently. • There is no contaminant removal mechanism.
2.2
Mascot
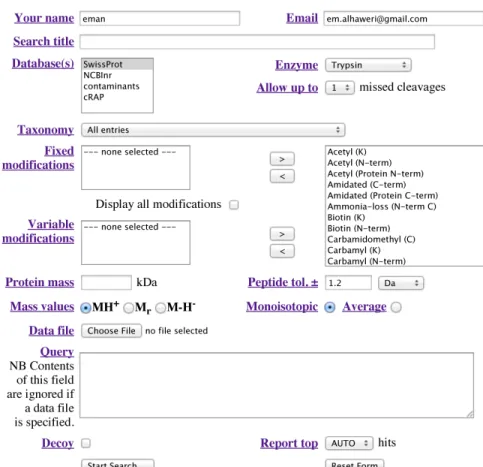
It is one of the most popular application for protein identification using mass spectrometry data. It performs both protein identification techniques: MS/MS and PMF. Mascot can be freely accessed at the Mascot server (http://www.matrixscience.com/server.html) but with limitations. The complete application’s features, such as data size, confidential issues, and dealing with enzymes and modifications can only be accessed with the commercial version. Furthermore, the probability model details are not published and publicly unknown. It is fast due to its multi processor ability [8]. Mascot uses the probability-based MOWSE scoring algorithm. However, Mascot and MOWSE differ in a couple of things. First, Mascot directly deals with the FASTA format instead of prebuilt indexes (used by MOWSE). Second, Mascot uses both MOWSE and probability in scoring [8], where the matching between experimental data and each theoretical sequence can be considered as a random event. Theoretical proteins that have random match to the experimental data, are then ranked with decreasing order of probability [13]. Figure 2.1 shows the Mascot form for peptide mass fingerprinting identification.
2.2.1
Mascot Scoring
The main technique of probability based scoring is to calculate the probability that the observed match between the MS masses and each database entry is a random event. The match with the lower probability is the match with the higher score. Using probabilities as final score may be confusing. Therefore, Mascot reports the scores as [53, 8]:
−10 log10(Pr) (2.1)
2.2. MASCOT 17
Figure 2.1: Mascot program form for peptide mass fingerprinting.
2.2.2
Mascot Score Significance
The difference between random and significance scores should be as high as possible to ensure confidence in the results. Identification reliability can be affected by the sequence coverage (SC), which can be defined as the proportion of the database protein covered by the query peptides, and the number of matched mass values (MM). To obtain more accurate results, the multiplication of SC by MM is used to reduce the random matches as much as possible [51, 53].
2.2.3
Limitations
Mascot has the following limitations:
• It does not provide a free standalone software to handle large-scale PMF spectra.
2.3
ProFound
ProFound is another tool to identify proteins by PMF. It uses a Bayesian framework as the core of the scoring method to rank the theoretical sequences depending on their probability of occurrence. This tool takes into account the protein’s properties to increase the accuracy of the scoring [13]. It identifies proteins even if the quality of database’s proteins is fairly low. ProFound computes the probability of an experimental sample to be a specific protein in the database, based on the MS protein (protein sample resulting from MS) and any information related to it, i.e mass accuracy, previous experiments on this protein, and the enzyme used for the digestion. Likewise, it uses the available properties of the database proteins to restrict the search space. This restriction decreases the amount of random matches which consequently increases the confidence of the identification [54]. Figure 2.2 presents the ProFound form which displays the parameters needed by the program to perform the identification.
2.3. PROFOUND 19
2.3.1
ProFound Scoring
ProFound considers theoretical protein properties as well as other properties relevant to protein sample in its scoring. It ranks the theoretical proteins using a Bayesian algorithm to obtain a reasonable inference when identifying a protein sample. ProFound introduces the hypothesis: let Pth be the theoretical protein in the database, Pex be the experimental protein generated by
MS, and K be the available information. Thus, the probability that the theoretical protein Pth is
the intended protein given the experimental protein Pex and the background information K, is
calculated by the approximated equation:
Pr(Pth|PexK) ∼ Pr(Pth|K)( r 2 π mmax− mmin |Ψ(Pth)| )| ˆΨ|× | ˆΨ|
∏
i=1 1 σi { ci∑
j=1 e[− (mi−mi j)2 2σ 2i ] }Fpattern (2.2)with the normalized condition: ∑Pth∈databasePr(Pth|PexK) = 1
where:
• Pr(Pth|K) is the probability that the Pthgiven the background information K is the protein
sample.
• |Ψ(Pth)| is the number of peptides resulting from the theoretical protein Pth.
• | ˆΨ| is the number of matches between Pth and Pex.
• mmax− mmin is the range of measured peptide masses.
• miis the measured mass of the ith match.
• ciis the number of theoretical peptides that match mi.
• mi j is the calculated mass of the jth peptide in the ith match.
• σiis the standard deviation of the mass measurement at the mass mi.
• Fpattern is an empirical term. This term increases the probability when adjacent peptides
In summary, the theoretical protein Pth probability increases when the number of matches| ˆΨ|,
and the mass accuracy (smallσi, and mi− mi j values) increase, and when the number of
frag-ments|Ψ| decrease [54].
2.3.2
ProFound Confidence
The information related to the protein helps ProFound to get more accurate results. The Bayesian algorithm combines the information to restrict the database search process and to reduce the oc-currence of peptides that give random matches. This increases confidence in ProFound scores [54]. In fact, probability is the main factor to get good results in ProFound. When the proba-bility increases, the confidence level will increase and vice-versa. This tool can be accessed by Expasy server: http://prowl.rockefeller.edu.
2.3.3
Limitations
The restrictions of ProFound can be listed as:
• It only works with the NCBI database.
• There is no contaminant removal mechanism.
• It does not provide a free standalone software to handle large-scale PMF spectra.
2.4
MS-Fit
Ms-Fit is considered one of the most popular PMF softwares along with Mascot. Ms-Fit as well as Mascot, uses MOWSE to calculate scores, besides offering additional options to re-strict and enhance the search [36, 7]. These options allow the user to control some parameters like the range of protein molecular weights and the minimum number of matched peptides. These parameters help to speed up searches and improve accuracy. Figure 2.3 shows the Ms-Fit form, which can be accessed on the Ms-Fit server (http://prospector.ucsf.edu/prospector/cgi-bin/msform.cgi?form=msfitstandard).
2.5. PROTEINDECISION 21
Figure 2.3: MS-Fit program form for peptide mass fingerprinting.
2.4.1
Limitations
Ms-Fit limitations are the following:
• Restricts searches to only some databases.
• It does not provide a free standalone software to handle large-scale PMF spectra.
2.5
ProteinDecision
To get the advantages of statistical properties and to handle these properties in PMF, probability based scoring is widely used in most protein identification methods.
ProteinDecision [49] is based on MOWSE and uses probability-based scoring. This approach starts by constructing a frequency table, which MOWSE and Mascot are also built on, for all
theoretical proteins. When a theoretical protein is selected to be preprocessed, this protein is digested and the peptides are mapped to the frequency table, based on the molecular weight of the peptides and the molecular weight of the respective protein. The masses of these peptides are compared to the experimental data, given a mass tolerance, to find matches. Formally, let Ψibe the set of peptides in the row i. Additionally, letΩj be the set of proteins in the column
j. Given an experimental protein Pex, a theoretical protein Pth ∈ Ωj, and a peptideψ ∈ Ψi, the
probability ofψ matching an MS mass is:
Pr1(ψ|Pex) =
mi j
Mj
(2.3) Where the mi jis the number of peptides in cell i j (in frequency table) forΩj, and Mj= ∑Ni=1mi j
where N is the number of rows in the frequency table. For specificity, the probability ofψ not being from the cell i j is:
Pr2(ψ|Pex) = 1 −
mi j
Mj
(2.4)
And the probability that at least one peptide from the protein Pthexists in cell i j is given by:
Pr3(ψ|Pex) = 1 − Pr|Ψ(P2 th)| (2.5)
where |.| is the set cardinality, and |Ψ(Pth)| denotes the set of peptides in the cell i j for Pth in
the frequency table. Taking into account the assumption that the peptides from the theoretical proteins are independent, the joint probability Pr(Pth|Pex) is given by:
Pr(Pth|Pex) =
∏
i=R(l),l∈| ˆΨ|[1 − (1 −mi j Mj
)|Ψ(Pth)|] (2.6)
where the Pr(Pth) is the probability of the theoretical protein Pth matching the experimental
protein,| ˆΨ| is the number of theoretical protein masses that match to experimental masses, and R(l) is the row number where the MS mass is found. This equation presents the probability for a match between experimental protein Pex and theoretical protein Pth. The higher the value of
Pr(Pth|Pex), the lower the score value of this protein Pth.
2.6. STATISTICAL ASSESSMENT FOR MASS-SPEC USING PMF 23
2.5.1
Limitations
ProteinDecision has the following drawbacks::
• There is no missed cleavages features.
• Post-translational modifications feature is not available . • There is no contaminant removal mechanism.
2.6
Statistical Assessment for Mass-spec Using PMF
This method drives a new statistical model for confidence assessment of the results using PMF. Like other tools, the method starts the preprocessing of the theoretical proteins by digesting them into peptides. For the experimental data, mass/intensity values are read from MS spectra. This method uses the ratio ( ψj−ψi
)/ψi, to decide whether the theoretical peptide ψj is a candidate. The model uses the value 10−4as mass tolerance so, if the result of (
ψj−ψi )/ψi ≤ 10−4, the theoretical peptide is ranked as a candidate peptide. The raw score S for protein Pth
whose peptides areΨjis calculated by:
S= (
∑
i I(ψi)/ ψi−ψj+ d ) ∗ [TP/(1 + FP)] (2.7) Where the I(ψi) is the intensity of the experimental mass i,ψj is the mass of peptide j of thetheoretical protein Pth, ψi is the mass for the experimental peptide i in the protein sample Pex,
and d a constant for the optimization. TP represents the number of true positive MS masses matches, and FP the false positives which is the number of MS masses not found in Pth. The
higher the score S, the higher the chance of being the intended match.
This method also evaluates the statistical significance of the identified protein. All theoretical proteins are treated as statistical background to see whether the observed protein i is the query protein rather than just chance. A Q-score1 is provided which is defined as a ratio between the number of residues for matched peptides Ni and the protein length Li, or NLii. The Q-score
is normalized to the ratio between the total number of residues of peptide matches N in the database and the total number of residues in the database L, or NL.
The following is the transformation applied to Q-score:
Qscore2= Qscore1/mean(Qscore1)
Qscore3= ln(Qscore2)
Qscore= (Qscore3− min(Qscore3)) ∗ 50
After calculating the Q-score for theoretical proteins, the method transforms Q-score for these proteins by applying a Gaussian distribution with observed mean µ and standard deviationσ. The protein is considered as a significant protein hit if its Q-score is larger than (µ+ 2σ) [15].
2.6.1
Limitations
Limitations of these algorithm are:
• Post-translational modification is not available. • Computation time for confidence assessment is long. • There is no contaminant removal mechanism.
Chapter 3
Data Preprocessing
To achieve a successful database search, many steps should be performed beforehand. When these steps are accomplished in an efficient way, better results will be obtain by the PMF tool. However, when at least one prior step in the protein identification pipeline (Figure 1.4) is not performed properly, it will certainly affect the results. Some of these steps are already per-formed by biological instruments, so the quality of processing for these steps can not be han-dled by computational PMF tools. Nevertheless, these tools can filter the data generated by these instruments before doing the database search.
In this work, two main input files are handled: peak list and protein database. The peak list contains the peptide masses which are related to the unknown protein. The database contains the known proteins and is used as the database to query. This chapter explains the necessary preprocessing to have these files ready for matching and scoring. In addition, it addresses the problems caused by ambiguous amino acids in protein databases, as well as the proposed solutions.
3.1
Peak List Preprocessing
The peak list generated by MS contain both peptide masses, and contaminant masses. These contaminants hamper the protein identification process. Therefore, identifying and removing these masses are essential steps in obtaining good results in matching [28]. To achieve this, a
contaminant database containing all known contaminant sequences is used. These are initially converted to masses and then searched against the input peak list (query mass list) to find and remove them.
3.2
Protein Database Preprocessing
In many cases, some database sequences include symbols that do not encode amino acids, re-sulting in ambiguity in the protein sequence. In fact, there are three main cases in which these codes need preprocessing to make the sequences valid for digestion: the unknown symbol (X), ambiguous symbols (B, Z, and J).
3.2.1
Unknown Symbol Processing
A major problem that is occasionally found is that protein databases contain sequences with one or more unknown amino acids, coded as ‘X’. A solution to this problem is to replace this un-known symbol by the set of valid symbols (Table 1.1). This will yield a set of “new” sequences with ‘X’ replaced each time. Each one of these new sequences is treated as a theoretical protein. This will increase the time of processing depending on the number of Xs found in the sequence.
3.2.1.1 ‘X’ Replacement Approach 1
The main problem with ‘X’ symbol is that when it appears more than one time in the sequence, this significantly increases the number of generated sequences. For example, if the protein sequence contains a single ‘X’, it will be replaced with all standard amino acid codes. Each replacement generates a new protein sequence. Similarly, if the sequence contains two Xs, the number of generated sequences in this case will be 222. This increase in the number of se-quences can be represented by the exponential function: f(n) = 22n where n is the number of
unknowns in the sequence.
3.2. PROTEIN DATABASE PREPROCESSING 27
• Reading a protein sequence from the database.
• Check the sequence by ensuring that all its symbols are valid amino acid codes, if so, process the sequence. Otherwise, calculate the number of Xs
• For any sequence that contains Xs do the following: 1. Get the number of Xs in the sequence.
2. Get the positions of Xs in the sequence.
3. For each ‘X’ occurrence, replace the ‘X’ with each of the 22 amino acids, in which each replacement produces a new sequence.
Figure 3.1 illustrates the Xs combinations for a sequence contains two Xs.
Figure 3.1: Replace Xs with the standard amino acids to get valid sequences.
3.2.1.2 ‘X’ Replacement Approach-2
The approach presented above resulted in memory and speed problems. These problems arise from the high number of sequences produced by the X replacement. Another efficient and compact approach is described in Algorithm 3.2.1. The functions used in this algorithm are:
• GET POSITIONS OF X(SEQUENCE) that returns a list of positions of Xs inside the se-quence.
• DIGEST(SEQUENCE) that digests the sequence into peptides and returns these peptides.
• CALCULATEMASS(SEQUENCE) that calculates masses for peptides and returns these
masses.
In summary, this algorithm performs the following main steps:
• Read the protein sequence and calculate how many Xs are in the sequence.
• If the sequence contains a single ‘X’ then, generate 22 sequences with X replaced with each amino acid.
• For sequences with more than one ‘X’, digest the sequence, and then assign the average mass of the amino acid for each ‘X’ occurrence, which is approximately 110Da [19].
3.2. PROTEIN DATABASE PREPROCESSING 29
Algorithm 3.2.1: REPLACEMENT OF X(sequence)
.validSymbols[ ] ← GET PROTEINS SYMBOLS()
xPositions[ ] ← GET POSITIONS OF X(sequence)
if LENGTH(xPositions) 6= 1 then DIGEST(sequence)
for j← 1 to LENGTH(sequence)
do if sequence[ j] =′X′ then SET MASS(′X′, 110) CALCULATEMASS(sequence)
else
for k← 1 to LENGTH(xPositions[ ])
do
for i← 0 to LENGTH(validSymbols[ ]) − 1
do
REPLACE(SYMBOLAT(xPositions[k]), validSymbol[i]) DIGEST(sequence)
CALCULATEMASS(sequence)
The generation of 22 sequences when ‘X’ is present one single time, causes another problem in the scoring step. MOWSE frequency table, as mentioned earlier, is created for all peptides in the database. This scoring algorithm depends on the occurrence of these peptides for each protein in the database. The 22 sequences generated, when replacing the ‘X’, are stored in the same column in the frequency table.
This happens because they are the same sequences with almost the same molecular weights except that the mass of the unknown symbol is replaced each time. When the same sequence with the same peptides (except the peptide containing ‘X’) is stored several times, it leads to a great increment of the number of occurrences in specific intervals. Consequently, this increase biases the scoring method, which mainly depends on the distribution of peptide entries in the database. In particular, when the number of occurrences of some peptides increases in specific intervals, these peptides will have more chance to be candidate peptides. As result, the score of their proteins will be high even if they are not the correct proteins.
To overcome this problem, a proposed solution to avoid the duplication of peptide masses for the same sequence is provided. Hence, peptides that remain unchanged are inserted into the table only once. In this case, only the mass of the peptide which contains ‘X’ will be inserted into the frequency table in each replacement.
3.2.2
Ambiguous Symbols Processing
Each of the ambiguous symbols ‘B’, ‘Z’, and ‘J’ has two standard codes related to it as shown in Table 3.1. These kind of symbols (like ‘X’) cause exponential growth (2n) in the number of sequences when they appear in one sequence. Nevertheless, they differ from ‘X’ in the number of replacements. In ‘X’, there are 22 replacements for each occurrence of the ‘X’, while these symbol have 2 replacements each time they appear in the sequence.
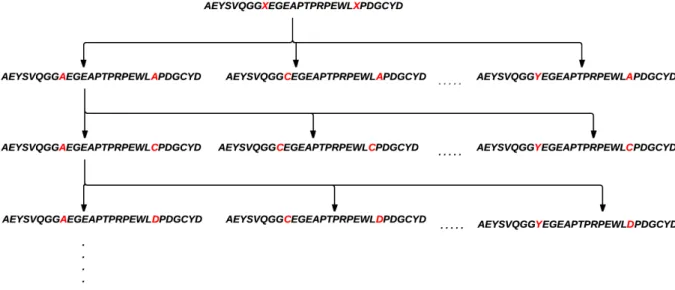
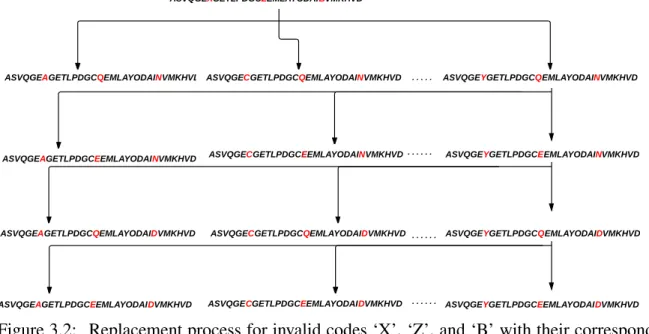
Because of that, they can be processed in two ways depending on their number inside the se-quence. If any or all of these symbols appear just one time, each one is replaced by its two valid codes. For example, if the sequence contains just one symbol ‘Z’, the application will generate two new sequences one with Glutamine (Q) and one with Glutamic acid (E) instead of ‘Z’. Accordingly, If the sequence contains one ‘B’ and one ‘Z’, the number of generated sequences will be 4. Figure 3.2 shows an example of how the substitution process occurs for a sequence with ‘X’, ‘Z’, and ‘B’ respectively. If the sequence contains more than one ambiguous sym-bol, the digestion is applied first to the sequence as valid sequences, and then during the mass calculation the masses for the symbols are set to the average mass of their two corresponding possible masses [44].
Table 3.1: Ambiguous and unknown symbols and corresponding one and three letters codes.
Amnio Acid 3- Letters 1- Letter Asparagine or Aspartic acid Asx B Glutamine or Alutamic acid Glx Z Leucine or Isoleucine Xle J Unknown amino acid Xaa X
3.2. PROTEIN DATABASE PREPROCESSING 31
Figure 3.2: Replacement process for invalid codes ‘X’, ‘Z’, and ‘B’ with their corresponding standard amino acid codes to get valid sequences
3.2.3
Database Size Handling
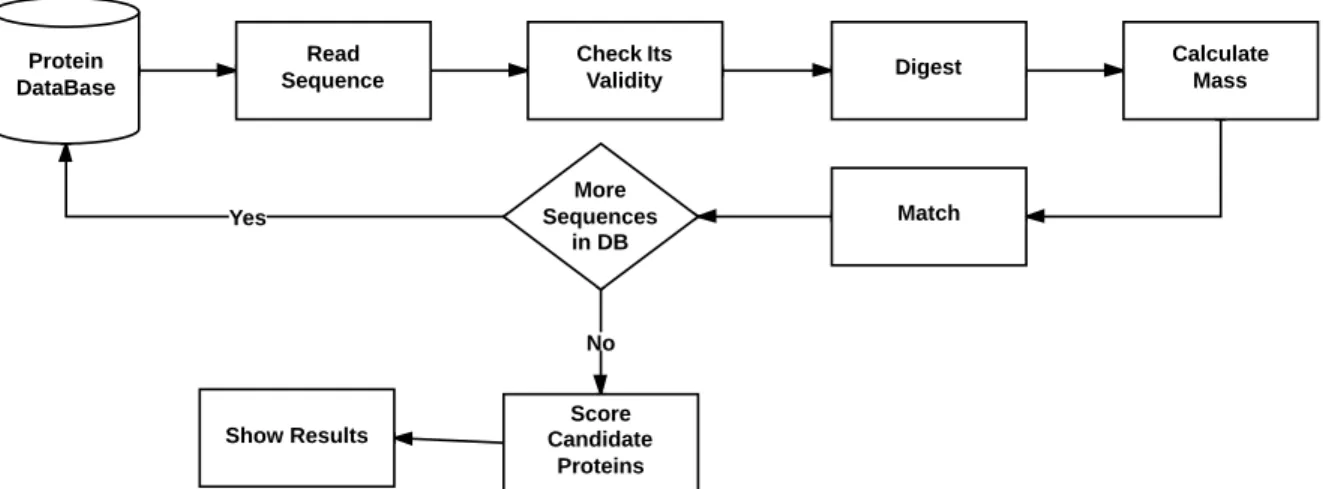
Biological databases tend to be massive, which can be a major problem. In this work, the input database is processed, sequence by sequence, to handle this problem. Thus, instead of reading the entire database to the memory and processing it, one sequence is loaded and processed at a time in an in-process-out paradigm. This loading is optimized by buffered file reading. In this case, any database size can be handled efficiently. Figure 3.3 shows how one sequence is processed at time.
3.2.4
Digestion
In-silico digestion is a simulation of the experimental digestion performed by mass spectrom-etry. Therefore, simulated digestion should result in peptides that are as similar to the mass spectrometry produced ones as possible. To achieve that, PMF software use parameters such as the enzyme used for digestion, number of missed cleavages, which are the factors that affect experimental digestion. It is very important to choose these values very carefully to obtain the
Figure 3.3: Processing the database proteins one-by-one.
right peptides. A brief explanation of these parameters is presented below.
Enzyme: It is set as the one used in the experimental digestion. An explanation of how digestion works is presented in Section 1.6.
Missed Cleavages: This parameter is used due to the imperfect nature of biological digestion. If the user is very confident that the experimental protein was perfectly digested, this param-eter is set to zero which means no missed cleavages are expected. However, this paramparam-eter is commonly set to one due to the difficulty of getting a perfect digestion.
3.2.5
Mass Calculations
The masses of digested peptides are calculated in this step. Each peptide has a weight, de-pending on its amino acid composition. When computing the mass for a peptide (based on the digestion), the sum of weights for the amino acids contained in this peptide is calculated. So, by knowing the mass of each amino acid residue in a sequence (see Table 3.2), one can calculate the mass of any peptide sequence by the following formula:
MW=
N
∑
i=1
3.2. PROTEIN DATABASE PREPROCESSING 33
Where the MW is the molecular weight of the sequence, mi is the mass of the amino acid i
inside the sequence, N is the number of amino acid residues in the sequence, and the constant 18.01524 is the average mass of the water molecule (H2O) which is H from the amino (-NH2)
group and -OH from the carboxyl (-COOH) group.
In fact, there are two ways to calculate amino acid masses for peptides: Average mass and monoisotopic mass. The difference between these two depends on the different compositions of isotopes in the amino acid chemical structure. Average mass is calculated using the average mass of the isotopes for each element weighed for natural abundance. On the other hand, monoisotopic mass is calculated using the mass of the most abundant isotope of each element present in the molecule [35]. The proposed application allows the user to choose the type of peptide mass, either average or monoisotopic mass. Table 3.2 lists these two types of masses for the 20 amino acid residues.
Table 3.2: Amino acid residues and their Monoisotopic and Average masses. Amino Acid Monoisotopic Mass Average Mass
Glycine 57.02147 57.052 Alanine 71.03712 71.079 Serine 87.03203 87.078 Proline 97.05277 97.117 Valine 99.06842 99.133 Threonine 101.04768 101.105 Cysteine 103.00919 103.144 Isoleucine 113.08407 113.16 Leucine 113.08407 113.16 Asparagine 114.04293 114.104 Aspartic Acid 115.02695 115.089 Glutamine 128.05858 128.131 Lysine 128.09497 128.174 Glutamic Acid 129.0426 129.116 Methionine 131.04049 131.198 Histidine 137.05891 137.142 Phenylalanine 147.06842 147.177 Arginine 156.10112 156.188 Tyrosine 163.06333 163.17 Tryptophan 186.07932 186.213
There are additional user-selected parameters that affect the mass calculation: fixed and variable modifications.
Fixed Modifications: When an amino acid residue is subjected to a fixed modification, its mass is changed at every occurrence of this residue. This kind of modification does not need any additional computation and does not affect the database search speed.
In this work, carboxymethyl (C) fixed modification is considered, by which all cysteine (C) residue masses are changed to 161Da when it appears in the sequence (when it is selected). To apply the carboxymethyl (C), the application first checks if the user selected fixed modification. If so, the sequence will be digested and, then, for each residue ’C’ occurrence, its mass is changed from 121.16 (unmodified cysteine) to 161Da (carboxymethyl-cysteine).
Variable Modifications: These chemical modifications, unlike the fixed modifications, can occur in an unpredictable pattern, which means they may or may not happen to each amino acid residue. They are also specified by the user. When a variable modification is applied, the original and modified amino acids masses are both calculated. For each occurrence, this calculation is applied with all possible combinations for each peptide containing the modified amino acid. All the resulting masses are compared to the experimental masses to find the best match. Taking variable modifications into account in a search, may help to identify the protein. On the other hand, specifying a large number of variable modifications at the same time leads to exponentially increasing the number of candidate peptides and a decrease in the search speed [14]. In this work, only one variable modification is considered, oxidation (M) [31].
Chapter 4
Proposed Method
This chapter presents the proposed scoring method for PMF matching. It is organized as fol-lows: main steps achieved by this work are shown in Section 4.1; MOWSE is described in detail in Section 4.2.1; and, finally, Section 4.2.3 describes the new scoring method.
4.1
PMF Main Steps
In this work, an application for protein identification using PMF is developed. The application receives multiple files as input: peak list, contaminants, and query databases. The peak list file contains the experimental data that will be searched against the query database to find a match. The contaminants database contains the contaminants that will be searched against mass data to filter them out. Each input file needs preprocessing (discussed in Chapter 3) before performing the database search. When the peak list and query databases are preprocessed, they are matched to each other and, based on the matching, the theoretical proteins are scored and ranked. The top hits list and the details for each hit will be presented. Figure 4.1 shows the main steps of the performed PMF method.
In the matching phase, experimental masses are searched against theoretical proteins. For each theoretical protein, its peptide masses are compared against the experimental peptide masses. When any match is found, this protein is ranked as a candidate. Whenever the number of matches for a protein increases, its probability of being a “true” match increases as well. After
Figure 4.1: PMF flowchart which represents the steps performed by this work.
producing the list of candidate proteins, the respective theoretical proteins will proceed to the scoring phase to evaluate their matches.
4.2
Scoring
All candidate proteins are scored and, based on those scores, a ranking is determined. Ideally, the highest ranking entry should correspond to the experimental protein sample. MOWSE is used to produce the raw score, this raw score is improved to identify the proteins more accu-rately.
4.2. SCORING 37 ! ! ! ! ! !!!!!!!!!"#$%&'()!*+#,-.'!/0((!1',-+20$(! !!!!!!!!!!!!!!!!!!!!!!!!!34560!!!!!!!!!!!!74560!!!!!!!!!!!84560!!!! !!!94560!!!!!!!!!!:::! !!!;<34560! ! ! ! ! ! ! ! ! ! ! =# > () !* -? ,. @ -!/ 0 ((! 1' ,-+ 2 0 $( ! !3 4 4 6 0 !!!! !!! !!!! !!7 4 4 6 0 !!!! !!!! !!!! 8 4 4 6 0 !!!! !!9 4 4 6 0 !!!! !: !!! .< 3 4 4 6 0 ! ! ! ! ! ! ! ! ! ! ! !ij ! ! ! ! ! ! ! ! ! ! ! ! ! ! ! ! ! ! ! ! !
Figure 4.2: Columns represent database protein molecular weights, whereas the rows represent the database peptide molecular weights.
4.2.1
MOWSE Scoring Algorithm
MOWSE is one of the most important scoring methods of PMF [48, 40, 2]. It compares the calculated masses for each protein in the database with the masses of the experimental protein. Each value that falls within a given mass tolerance is considered a match. This method depends on the number of theoretical proteins that match to each protein sample, and the frequency of the molecular weight for each peptide. A frequency table is built where columns represent database proteins, and rows indicate the peptides for these proteins (Figure 4.2). Any peptide that belongs to the same protein will contribute in a single column which represents this protein [49, 36]. The following steps describe how this method works :
• Aggregate proteins to bins, so that each bin sums up to 10kDa.
• Arrange the peptides for each protein into 100Da bins. For example, Table 4.1 shows how these peptides are arranged for one protein.
• For each protein (10kDa), normalize the values in the bins by:
Table 4.1: Peptides arrangement based on their mass value.
Peptide Mass Interval Peptide in Interval MASNTVSAQGGSNR 1732.91 400-500 MNR DFSNIQDVAQFLLFDPIWNEQPGS 3405.84 600-700 LDIMQ MNR 420.51 800-900 EQALAER EQALAER 816.89 1700-1800 MASNTVSAQGGSNRPVR YPELQTSEPSEDYSGPVESLE 3164.49 3100-3200 YPELQTSEPSEDYSGPVESLE LDIMQ 619.76 3400-3500 DFSNIQDVAQFLLFDPIWNEQPGS
Where fi j is the frequency of cellij,ψi j is the value in the cell, and max(Ψj) is the largest
value in columnj.
• Compare the peak list to each protein in the database.
• Score the theoretical proteins by retrieving the frequency of matched peptides and multi-plying them by:
H( ˆΨ) ∝
∏
i=R( ˆψ)
fi j (4.2)
Where H( ˆΨ) is the product of matched values in the frequency table, R( ˆψ) is the row number of the table for the peptide whose mass matches the peak list, and ˆΨ is the set of fragments of the experimental protein matched with the theoretical protein.
• To get the final scoreτmowse, the product of matched peptides is normalized to an average
protein of 50kDa to restrict the influence of random score growth for proteins >200kDa.
τmowse=
50000 H( ˆΨ) ∗W (Pth)
(4.3) Where the W(Pth) is the molecular weight for the theoretical protein Pth.
4.2.2
Score Significance
One of the main challenges in PMF is to decide if the match between the experimental sample and the database protein is a correct match rather than just a random match or at least to which level the match is reliable (i.e. the confidence level of the match). The comparison between ex-perimental masses and theoretical proteins is applied with a given mass tolerance. Within this