Modeling Heat and Mass Transfer
from Fabric-Covered Cylinders
Phillip Gibson
U.S. Army Natick Soldier Research, Development, & Engineering Center, Natick, Massachusetts, USA
Correspondence to:
Phillip Gibson, email: [email protected]
ABSTRACT
Fabric-covered cylinders are convenient analogs for clothing systems. The geometry is well defined and includes many of the effects that are important in garments. Fabric-covered cylinder models are used in conjunction with laboratory measurements of material properties to calculate heat and mass transfer properties of clothing under specific conditions of environmental wind speed, temperature, and relative humidity.
INTRODUCTION
Fabric-covered cylinders provide a well-defined experimental and computational framework to study some of the system-level effects important for clothed humans [1-9]. The effects of variable air spacing between fabric layers, or between the fabric and the human skin surface, can be important in determining how much heat and mass is transferred into or out of the clothing. Much progress has been made in more complicated models that capture the actual body geometry of clothed humans or body sections [10-12]. However, as shown in Figure 1, there is significant computational expense associated with modeling the clothed human configuration.
Full Body (3D) Body Section (3D) Cylinder (2D)
•High memory and run-time; very large number of grid points •Incompatible length scales between human body and fabric thickness
•Captures 3-D flow effects
•Good compromise between geometric accuracy and memory requirements
•Least memory and grid requirements •Best for time-dependent modeling and complicated physics
FIGURE 1. Fabric-covered cylinders can be more computationally efficient, but lose the detail of specific body regions (human model picture courtesy of Creare, Inc. [12]).
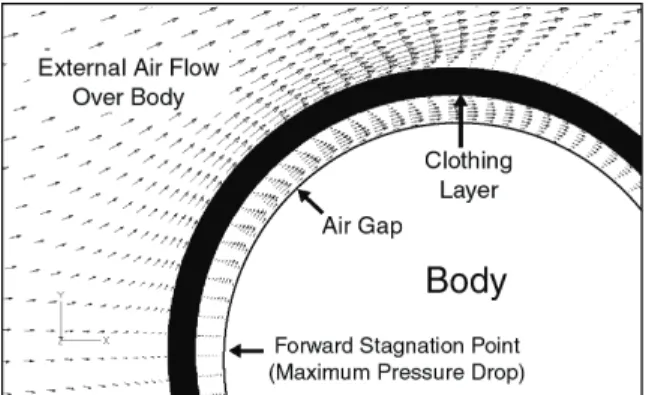
In many cases, approximating the human body as an assemblage of fabric-covered cylinders provides sufficiently accurate results. In general, an external air flow due to wind or body motion impinges on the clothed human, and some air flows around the body, while the rest of the air penetrates through the clothing system and into the gap between the clothing and body. This is illustrated in Figure 2, which is a typical computational fluid dynamic (CFD) simulation of flow over a cylinder covered by a permeable fabric.
FIGURE 2. Flow conditions for a fabric-covered cylinder.
For a given external air velocity, the amount of air which flows around the body, and the amount which penetrates through the clothing layer is determined by the air flow resistance (air permeability) of the clothing layer. Materials with a low air flow resistance allow a relatively high flow rate through the fabric, with a correspondingly low pressure drop. Materials with a high air flow resistance allow less flow through the fabric, and have a higher pressure drop across the fabric layer (up to the limit of the stagnation pressure for the particular environmental flow conditions).
the interaction of the different transport properties characterized individually by laboratory test methods, but which all operate simultaneously in a clothing system. A CFD simulation of the performance of the materials in the fabric-covered cylinder geometry can help to determine how the overall system heat and mass transfer coefficients are influenced by a particular combination of fabric properties.
COMPUTATIONAL METHOD
A commercial finite-volume CFD software package (CFD2000, v3.11) is used for the simulations presented in this paper. The software can create two- or three-dimensional body-fitted structured meshes, which are then used to solve the appropriate fluid flow, momentum, heat, and mass transfer equations applicable to a particular situation [13]. Figure 3 shows the computational grid and domain for a typical fabric-covered cylinder simulation. A uniform air velocity field with specified temperature and vapor concentration enters on the right, and the cylinder surface boundary conditions are defined in terms of constant temperature and/or vapor concentration (usually defined as a fully wetted surface).
U∞
C∞
T∞
(a) Computational grid and domain.
(b) Detail near cylinder. Yellow shading indicated porous mesh region to simulate fabric layer, with smaller mesh spacing near fabric and cylinder surface.
FIGURE 3. Typical computational meshes for a fabric-covered cylinder.
The quantities of interest in these simulations are the heat transfer and mass transfer from the surface of the cylinder. The total heat transfer resistance and the total mass transfer resistance are the quantities most often used in this work [14]. Heat and mass transfer resistances are calculated by summing up the individual heat/mass flux for each cylinder grid surface, and normalizing by the cylinder area and difference between the cylinder surface temperature or vapor concentration and the entering air temperature or vapor concentration.
Thermal Resistance: Rc (m²-°C/Watt)
Rc = A (Tc - T∞) / E (1)
A = area (m²)
Tc = cylinder surface temperature (°C)
T∞= entering air temperature (°C) E = heat flux from the cylinder (Watts)
Mass Transfer Resistance: Re (s/m)
Re = A (Cc - C∞) /m& (2)
A = area (m²)
Cc = cylinder vapor concentration (kg/m³)
C∞= entering air vapor concentration (kg/m³) m&= mass flux from the cylinder (kg/s)
The calculation of the heat and mass transfer resistance is complicated by oscillating flow due to vortex shedding at higher wind speeds, as shown in Figure 4. Figure 4 is a color map of the calculated temperature field over several time steps, and illustrates the periodic nature of the flow oscillation.
1 2
4 5
3
6
FIGURE 4. Vortex shedding over a fabric-covered cylinder.
low velocity inlet flow, and letting the solution and flow stabilize for a period of time. The inlet flow is then increased to a higher wind speed, and the solution is again allowed to stabilize, and so on.
Figure 5 shows an example of the transition of the solution as the inlet flow is changed to a higher value. Since the flow is oscillating, the instantaneous values for the total heat and mass transfer resistances are also nonsteady. The mean value of the calculated heat or mass transfer resistance is determined for each flow condition as shown in Figure 5.
0 0.05 0.10 0.15 0.20 0.25
140 150 160 170 180
External wind speed changed from 6.3 m/s to 9.4 m/s. Oscillations due to vortex shedding increase in frequency.
Mean Value = 0.119 m²-°C/Watt @ 9.4 m/s (21 mph) Mean Value = 0.155 m²-°C/Watt
@ 6.3 m/s (14 mph)
Time (Seconds)
The
rma
l Resi
st
an
ce (m²-°
C
/
Wat
t)
FIGURE 5. Heat and mass transfer resistances are calculated based on the mean value of the oscillating flow for each condition of wind speed.
Benchmark Simulations – Bare Cylinder
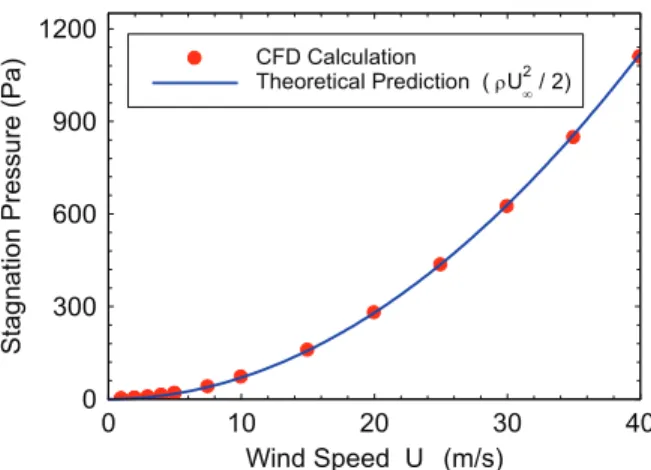
The bare cylinder simulation provides an opportunity to compare the computational simulations with experimental and theoretical values for heat and mass transfer from a cylinder in cross-flow conditions. Figures 6-8 show that the computed values for the stagnation pressure, total thermal resistance, and total mass transfer resistance agree with literature values [15]. This provides some confidence that the simulation framework is correct, and that similar computational predictions for fabric-covered cylinders are more likely to be valid.
0 300 600 900 1200
0 10 20 30 40
CFD Calculation
Theoretical Prediction ( ρU∞2 / 2)
Wind Speed U∞ (m/s)
St
ag
na
ti
on
Pr
essu
re (Pa
)
FIGURE 6. Calculated stagnation pressure on the cylinder leading edge agrees with theoretical value (U∞ refers to external wind velocity, and ρ is air density)
0 0.05 0.10 0.15
0 10 20 30 40
CFD Calculation Correlation from Literature
Wind Speed U∞ (m/s)
Therma
l Resi
st
an
ce (
m
²-°C
/
Wat
t)
FIGURE 7. Comparison of CFD calculation with literature value for total thermal resistance of heated bare cylinder in cross flow.
0 30 60 90 120
0 10 20 30 40
CFD Calculation Correlation from Literature
Wind Speed U∞ (m/s)
M
a
ss Transf
e
r R
e
sistance
(s/m)
RESULTS
Heat Transfer – Effect of Fabric Air Permeability
A computational model allows material properties to be varied systematically while keeping other properties constant. This can be difficult to do experimentally, since changing one property such as thermal insulation will likely change other properties at the same time. The fabric-covered cylinder model is well-suited to iterative examinations of the effect of variations in a single material property.
In the example presented in this section, the air flow resistance of the fabric layer is varied over a range of several orders of magnitude to determine the effect on the total thermal resistance. The computational simulation can keep other properties constant, while varying the environmental wind speed to see how fabric air flow resistance influences thermal comfort.
Fabric properties for the porous fabric layer are defined in terms of thermal resistance, mass transfer resistance, and air flow resistance. The fabric thermal resistance and mass transfer resistance are in similar units as defined in Eq. (1) and (2), and are defined in more detail in Reference 14. The definition of air flow resistance is given below, since fabric flow properties are not commonly given in such units.
Air Flow Resistance: RD (1/m)
RD = Δp / μ v (3)
Δp = pressure drop across sample (N/m² or Pa)
μ = gas viscosity (kg/m-s)
v = gas flow velocity through sample (m/s)
For this series of simulations, the cylinder diameter was 0.187 m (corresponding to size of human thigh), and the air space between the fabric and the cylinder surface was 0.01 m. The cylinder surface temperature was 35°C (nominal human skin temperature) and the air temperature was 5°C. Simulations were carried out over a range of air flow velocities from 1 to 40 m/s, although only the results up to 10 m/s are shown in Figure 9. As mentioned previously, the curve for the bare cylinder case in this figure agrees with heat transfer correlations for gas flow over heated cylinders. These types of simulations are a useful adjunct in efforts to design the proper mix of fabric transport properties to maximize comfort while still providing adequate protection from the environment, and from chemical/biological warfare agents.
0.01 0.1 1
1 2 5 10
RD = 1x10⁷
RD = 1x10⁶
Bare Cylinder (No Fabric Layer)
RD = 1x10⁸
Fabric Air Flow Resistance (RD) = 1x10⁹ m-1
Wind Speed (m/s)
Therm
a
l R
e
sistance (
m
2 -°C
/ W
a
tt)
FIGURE 9. Overall heat transfer resistance of fabric-covered cylinders in cross-flow conditions at various wind speeds.
Modeling Example - Three Fleece Fabrics
These computational modeling techniques were applied to commercially available knit fleece layers that were developed for cold-weather applications. Considerable effort is expended to develop clothing that is “breathable” to sweat vapor, yet that will also retain heat even in windy conditions. Modeling simulations were carried out for a variety of new insulating fleece fabrics produced for the outdoor clothing market. These fabrics are becoming available in a wide variety of material properties, and it is difficult to rank or evaluate them based on material properties alone. CFD modeling of the behavior of these materials in a simple clothing analog of a fabric-covered cylinder can be helpful in distinguishing significant differences between some of these fabrics.
TABLE I.
Material Properties for Three Fleece Fabrics
Fabric Type Measured
Property
Very Permeable
Wind
Resistant Wind Barrier Air Flow
Resistance (1/m)
4.3x10⁶ 3.4x10⁷ 1x10¹¹
Air Permeability
(CFM) (ft³/min-ft² @
0.5 inch of water)
270 50 1
Water Vapor Diffusion Resistance
(s/m)
266 395 1070
Water Vapor
Flux (g/m²-day) 4822 3159 1258
Thermal
Insulation (clo) 4.2 3.4 4.1
Thermal Resistance (m²-°C/Watt)
0.657 0.522 0.635
The material properties were then input into a CFD model of a fabric-covered cylinder, as described previously, under conditions of several different wind speeds. The CFD model provides the ability to go directly from laboratory tests of material properties to a system simulation that approximates real-world conditions. A direct comparison for the three fabrics is shown in Figure 10.
0 1 2 3 4 5
0 10 20 300
0.5x10⁵ 1.0x10⁵ 1.5x10⁵ Air Temperature = 0°C , Relative Humidity = 20%
Bare Cylinder
Extremely Wind Permeable (270 CFM)
Wind Resistant (50 CFM)
Wind Barrier (1 CFM)
Wind Speed (miles/hour)
Therm
a
l Insulation ( C
lo )
Wa
te
r
Va
po
r
T
ra
n
sf
er
Ra
te
(
g/
m²-d
ay )
FIGURE 10. Comparison of Heat Transfer and Water Vapor Flux for Three Varieties of Insulating Fleece.
The baseline bare cylinder results are essentially the cooling effect and evaporative heat loss due to “wind chill.” The presence of a clothing layer modifies the wind chill effect significantly depending on the air permeability, thermal resistance, and water vapor
diffusion resistance of the clothing layer, and the air space between the cylinder surface and the clothing layer. The air permeability of the fabric layer was found to be the most significant parameter affecting the performance of the various materials evaluated. Differences in thermal resistance that seemed important under the stagnant test conditions present in the laboratory tests were much less significant when the materials were compared under moderate wind speeds which produced significant air flow through the model fabric-covered cylinder system.
Review of Clothing Heat Transfer Coefficients
Heat transfer through clothing is often broken down into dry heat transfer (conduction, convection, and radiation), and evaporative heat transfer (diffusion and convection of evaporated sweat vapor). Typical units to characterize clothing dry heat transfer are thermal resistance Rct (m²-°C/Watt) and the alternate
thermal resistance unit of clo. Typical units for evaporative heat transfer are evaporative resistance Ret (m²-Pa/Watt), the equivalent parameter im/clo, and
the related water vapor transfer rate, WVTR (g/m²-day).
These properties may all be dependent to some extent on the measurement methods used--material properties related to air permeability, liquid sweat wicking, etc., may be lumped together into overall measurements made using system tests such as sweating thermal manikins.
Conventional testing methods for obtaining thermal properties for clothing heat balance include the sweating guarded hot plate, water-filled cup tests, and various permeation cells. All give equivalent values and can be converted if testing conditions are known. Im (permeability index) is a relative measure of the
permeability of the material to the passage of water vapor. The im index should vary between 0 (for
completely impermeable materials), and 1 (for completely permeable materials). In practice, the value of 1 as an upper limit is not approached until the wind speed over the thermal manikin or sweating guarded hot plate becomes great enough to minimize the contribution of radiative heat transfer. In heat balance equations, the thermal resistance is divided out of the im index to give the variable related to
water vapor permeability (im /clo, Ret, MVTR, etc.)
The effects of wind speed and measurement bias can be subtracted off to give “intrinsic” values for the materials that are closer to true material properties. For clothing system testing (im, clo), all values
As mentioned previously, total heat transfer is equal to dry heat transfer plus evaporative heat transfer. The importance of the term im/clo is illustrated if the
equations for dry heat transfer (Edry), and evaporative
heat transfer (Eevap), are written:
(
Tclo m
(watts
Edry ⎟Δ
⎠ ⎞ ⎜ ⎝ ⎛ = 6.45
)
/ 2
)
(4)( )
p S clo i m (wattsEevap m ⎟ Δ
⎠ ⎞ ⎜ ⎝ ⎛ = 6.45
)
/ 2 (5)
Total Heat Transfer (watts/m²)
( )
( )
pclo i T clo m Δ ⎟⎟ ⎠ ⎞ ⎜⎜ ⎝ ⎛ + Δ ⎟ ⎠ ⎞ ⎜ ⎝ ⎛
= 6.45 14.2 (6)
ΔT = temperature difference, °C S = Lewis Relation (2.2 °C/mmHg)
Δp = vapor pressure difference, mmHg clo = Rdry in clo units
It is important to note that the value for im/clo is
inversely equivalent to evaporative resistance Ret
(m²-Pa/Watt) as defined in an alternate system of units, and can also be converted directly into water vapor flux values (g/m²-day) [20].
Fabric-Covered Cylinder Modeling in Clothed Human Heat Balance Comparisons - Thermal Physiology Implications
The conventional heat balance equation which describes energy flows between the clothed human body and the environment is [21]:
M + W + R + C + ED+ Ere + Esw + S = 0 (7)
M = metabolic rate (internal energy produced by food oxidation)
W = the physical work
R = the net radiant balance of the body
C = the heat flow due to conduction and convection ED = the latent heat flow to evaporate water through
skin (perspiration)
Ere = heat flows for respiration (air heating and
humidifying)
Esw = heat flow due to sweat evaporation
S = heat flow accumulated in body.
For thermal balance, the heat generated due to metabolism and exercise is equal to the heat dissipated through clothing. Numerical values for heat generated due to metabolism and exercise (watts per unit body surface area) are available in standard tables [22].
The heat lost through clothing can be related to the calculated heat and mass transfer coefficents for the fabric covered cylinders for the three fleece fabrics (Figure 10).
Heat lost through clothing (8) = ( ΔT / Rc) + (Δpv / Ret)
Rc = thermal resistance (m²-°C/Watt)
ΔT = temperature difference between skin and environment (°C)
Ret = water vapor diffusion resistance (m²-Pa/Watt)
(converted from Re in units of s/m given in Eq. (2) )
Δpv = vapor pressure difference between skin and
environment (Pa)
The heat loss rate from a clothed human can be calculated for different wind speeds using the value from Figure 10 for specific environmental conditions of wind speed, temperature, and relative humidity.
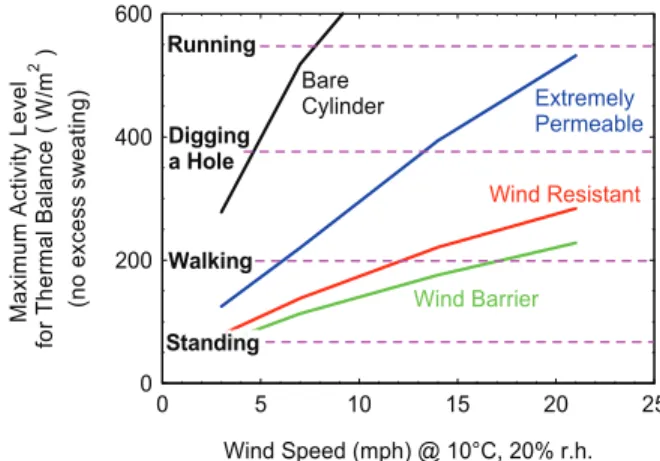
Figure 11 shows a typical calculation for the situation where the heat loss rate is chosen to be at the maximum to avoid “excess” sweating. Since the total heat transfer coefficient is available as a function of wind speed for the three fleece fabrics, the maximum activity level to maintain thermal balance can also be calculated over the range of wind speeds from 0 to 20 mph. Figure 11 allows a more direct comparison of the performance properties of the three fabrics in specific environmental conditions than would be available from perusal of the measured properties available in Table I.
0 200 400 600
0 5 10 15 20 25
Digging a Hole Walking Standing Running Wind Barrier Wind Resistant Extremely Permeable Bare Cylinder
Wind Speed (mph) @ 10°C, 20% r.h.
Maxi mum Act ivi ty Level fo r Th er m al Ba la nce ( W /m
2 )
(n o e x ce s s sw ea ti ng)
FIGURE 11. Maximum activity level to avoid sweating for various wind speeds and activity levels for three fleece fabrics.
heat transfer and evaporative heat transfer for each type of clothing. Figure 12 shows the dry heat loss due to conduction and convection is much larger than that due to evaporated sweat for the environmental conditions of 0°C, 20% r.h., and 3 mph wind speed.
0.0 100.0 200.0 300.0 400.0 500.0 600.0 700.0 800.0
Wind Barrier Wind
Resistant
Wind-Permeable
Bare Cylinder
H
eat
T
ra
n
s
fer
(
W
at
t/
m
²) Dry Heat Transfer
Evaporative Heat Transfer
FIGURE 12. Relative contributions of dry heat transfer and evaporative heat transfer for one condition of environmental temperature, humidity, and wind speed (3 mph, 10°C and 20% r.h.).
CONCLUSIONS
Computational simulations of the performance of clothing materials in the fabric-covered cylinder geometry can help to determine how the overall system heat and mass transfer coefficients are influenced by a particular combination of fabric properties.
For the particular example of modeling three fleece fabrics, specific conclusions are listed below:
• Baseline bare cylinder results are the cooling effect and evaporative heat loss due to “wind chill.”
• Clothing layers modify the wind chill effect significantly: pertinent properties are air permeability, thermal resistance, and water vapor diffusion resistance.
• Fabric air permeability is the most significant factor affecting heat and mass transfer in windy conditions. • Differences in thermal properties measured under stagnant laboratory conditions disappeared when external wind was present.
Modeling fabric properties in a simple cylindrical geometry provides much of the information required for system-level decisions about various transport property trade-offs between material candidates for protective clothing. However, there are some
situations, particularly those involving body movement and motion, as well as interfaces/closures between different clothing system components, where more detailed models are desirable.
REFERENCES
[1] Bo, Q., Nakijama, T., “Natural and Mixed Convection around a Cylinder Enclosed with Porous Media—a Numerical Study on Comfort of Clothed Human Being,” Proceedings of Computational Technologies for Fluid / Thermal / Structural / Chemical Systems with Industrial Applications 424-2, American Society of Mechanical Engineers, New York, 2001, 177–183.
[2] Brasser, P., “Theoretical and Experimental Study of Airflow Through Clothing Around Body Parts,” AIChE Journal 52 (11), 2006, 3688-3695.
[3] Kind, R., Jenkins, C., Broughton, C., “Measurements and Prediction of Wind-Induced Heat Transfer Through Permeable Cold-Weather Clothing,” Cold Regions Science and Technology 23 (4), 1995, 305–316.
[4] Kind, R., Jenkins, C.., Seddigh, F., “Experimental Investigation of Heat Transfer Through Wind-Permeable Clothing,” Cold Regions Science and Technology 20 (1), 1991, 39-49.
[5] Sobera, M., Kleijn, C., “T-RANS Simulations of Subcritical Flow with Heat Transfer Past a Circular Cylinder Surrounded by a Thin Porous Layer,” Journal of Flow, Turbulence and Combustion 80 (4), 2008, 531-546.
[6] Sobera, M., Kleijn, C., van den Akker, H., “Subcritical Flow Past a Circular Cylinder Surrounded by a Porous Layer,” Physics of Fluids 18 (3), 2006, 038106.
[7] Sobera, M., Kleijn, C., Brasser, P., van den Akker, H., “Heat and Mass Transfer to a Cylinder Surrounded by a Porous Material,” Proceedings of the ASME 4th International Symposium on Computational Technologies for Fluid / Thermal / Structural / Chemical Systems with Industrial Applications 448-1, American Society of Mechanical Engineers, New York, 249–260.
[9] Watanabe, T., Kato, T., Kamata, Y, “The Velocity Distribution in the Inner Flow Field around a Clothed Cylinder,” Sen-I Gakkaishi (Journal of the Society of Fiber Science and Technology, Japan) 47 (6), 1991, 271–275.
[10] Barry, J., Hill, R., Brasser, P., Sobera, M., Kleijn, C., Gibson, P., “Computational Fluid Dynamic Modeling of Fabric Systems for Intelligent Garment Design,” Materials Research Society Bulletin 28 (8), 2003, 568– 573.
[11] Barry, J., Hill, R., “Computational Model of Protective Clothing,” International Nonwovens Journal 12 (3), 2003, 25-35.
[12] Hill, R., Barry, J., “New Developments in the Assessment of Protective Fabrics Using Computational Models,” International Nonwovens Journal 14 (4), 2004, 22-30.
[13] Gibson, P., "Numerical Modeling of Convection, Diffusion, and Phase Change in Textiles," Proceedings of 2nd International Symposium on Computational Technologies for Fluid / Thermal / Chemical Systems with Industrial Applications 397-2, American Society of Mechanical Engineers, New York, 1999, 117-126.
[14] Gibson, P., "Multiphase Heat and Mass Transfer through Hygroscopic Porous Media with Applications to Clothing Materials," U.S. Army Natick Research, Development, and Engineering Center Technical Report, Natick/TR-97/005, 1996.
[15] Whitaker, S., "Forced Convection Heat Transfer Correlations for Flow in Pipes, Past Flat Plates, Single Cylinders, Single Spheres, and for Flow in Packed Beds and Tube Bundles," AIChE Journal 18 (2), 1972, 361-371.
[16] “Standard Test Method for Steady-State Thermal Transmission Properties by Means of the Heat Flow Meter Apparatus,” ASTM C518-04, American Society for Testing and Materials, 2004.
[17] “Standard Test Methods for Water Vapor Diffusion Resistance and Air Flow Resistance of Clothing Materials Using the Dynamic Moisture Permeation Cell,” ASTM F2298-03, American Society for Testing and Materials, 2003.
[18] Gibson, P., Kendrick, C., Rivin, D., Charmchi, M., Sicuranza, L., "An Automated Water Vapor Diffusion Test Method for Fabrics, Laminates, and Films," Journal of Coated Fabrics 24 (4), 322-345, 1995.
[19] Parsons, K., Havenith, G., Holmer, I., Nilsson, H., Malchaire, J., “The Effects of Wind and Human Movement on the Heat and Vapour Transfer Properties of Clothing,” Annals of Occupational Hygiene 43 (5), 1999, 347-352.
[20] Gibson, P., Auerbach, P., Giblo, J., Teal, W., Endrusick, T., "Interlaboratory Evaluation of a New Sweating Guarded Hot Plate Test Method (ISO 11092)," Journal of Thermal Insulation and Building Envelopes 18 (2), 1994, 182-200.
[21] Parsons, K. C., Human Thermal Environments, Taylor and Francis, London, 1993.
[22] Chapter 8 – Thermal Comfort, 2005 ASHRAE Handbook, Fundamentals, American Society of Heating, Refrigerating, and Air Condition Engineers (ASHRAE), 2005, Atlanta, Georgia.
AUTHOR’S ADDRESS
Phillip Gibson
Molecular Sciences and Engineering Team
Materials and Defense Sciences Division (MaDSci) U.S. Army Natick Soldier Research, Development, & Engineering Center