BERNARDO LS ETAL.
3 0 2 REV ASSOC MED BRAS 2014; 60(4):302-304
at bedside
Mother-requested cesarean delivery compared to vaginal delivery:
a systematic review
P
ARTO CESÁREO A PEDIDO MATERNO COMPARADO COM PARTO VAGINAL:
REVISÃO SISTEMÁTICALUCA S. BERNARDO, RICARDO SIMÕES, WANDERLEY M. BERNARDO, SERGIO F. DE TOLEDO, MARIO A. HAZZAN, HENRY F. CHAN, KIRA B. BUCCI, GUSTAVO MERCURI
http://dx.doi.org/10.1590/1806-9282.60.04.006
I
NTRODUCTIONThe rates of c-sections without medical or obstetric indi-cation have increased substantially in the last decades, es-pecially in developing countries. Many factors contribu-te to this increase, being the mother-requescontribu-ted cesarean delivery a key contributing factor. There is a major deba-te about the implementation of c-sections performed at the mother’s request without any established medical in-dication, and safety, cost, maternal autonomy, maternal and professional satisfaction, and ethics constitute im-portant factors under discussion.
O
BJECTIVETo prepare a recommendation considering the risks and benefits involved in the practice of mother-requested ce-sarean delivery and c-section without medical indication, compared to the planned vaginal delivery.
M
ATERIAL AND METHODSThe evidence used for analysis of the risks and benefits involved in the practice of mother-requested cesarean de-livery and c-section without medical indication was ob-tained according to the following steps: preparation of the clinical question, structuring of the question, search for evidence, critical evaluation and selection of
eviden-ce.The measures of effectiveness or damage expressed in
absolute numbers were analyzed using difference in ab-solute risk, adopting a confidence interval of 95%. For statistically significant results, the number needed to treat to benefit (NNT) and the number needed to treat to harm (NNH) were calculated. The meta-analysis was performed using RevMan 5 interface.
R
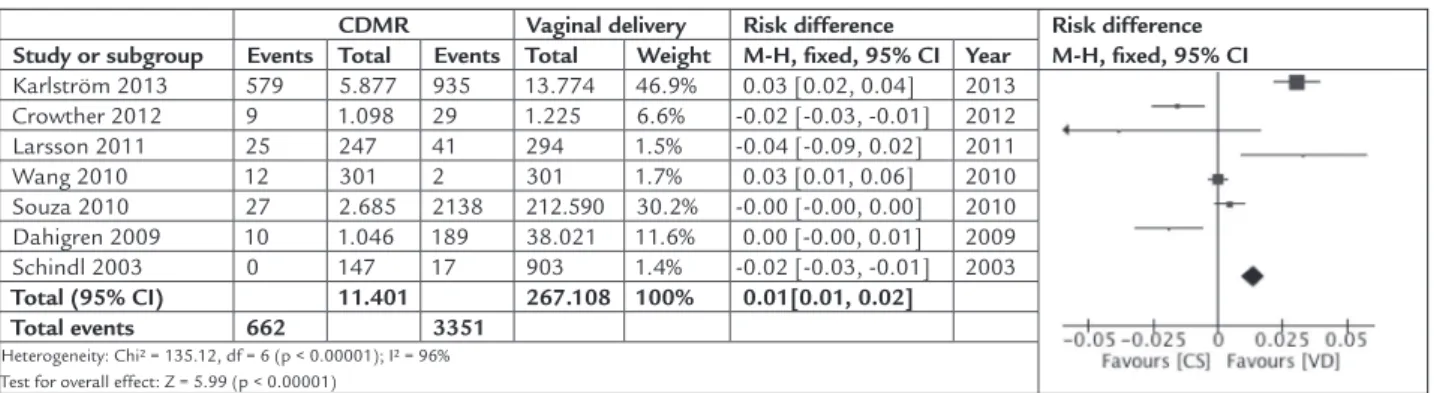
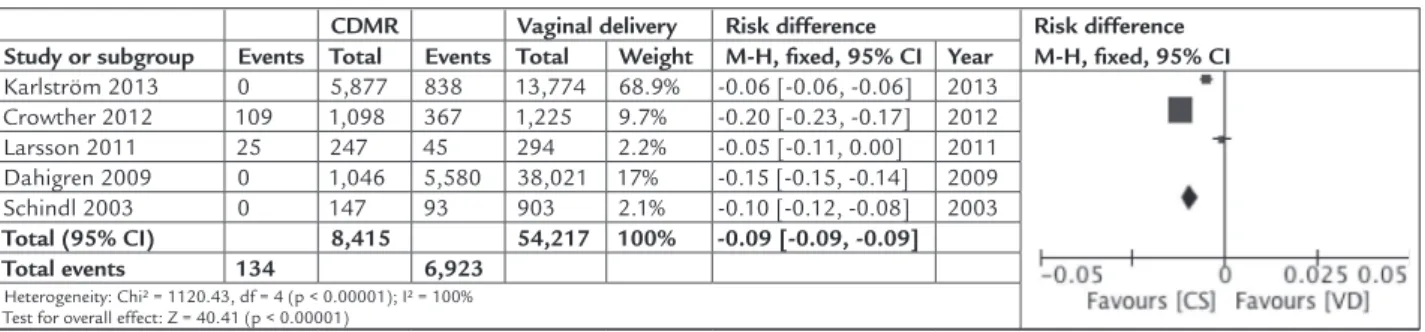
ESULTSUsing the search strategy described, 1,482 studies were retrieved. Out of these, which were reviewed based on title, only 295 articles included the subject mother-re-quested cesarean delivery or c-section without medical indication, and thus 1,187 studies were excluded. Of the 295 remaining studies, only 73 were selected for full text review, so that nine comparative studies (observational cohorts) that met the criteria for inclusion and exclu-sion were considered for final evaluation. The results with significant difference were: mother-requested cesa-rean delivery or c-section without medical indication in-creases the risk of hemorrhagic (Figure 1), infectious (Figure 2) and breastfeeding complications (Figure 3), and respiratory complications in the newborn (Figure 4). They also point toward a reduction in the risk of emergency c-sections (Figure 5) and Apgar score ≤ 7 (Fi-gure 6) compared to planned vaginal deliveries. The re-quested cesarean delivery does not establish significant differences in maternal mortality, post surgical wound complications, neonatal asphyxia, neonatal infection, and admission to neonatal ICU.
C
ONCLUSIONMOTHER-REQUESTEDCESAREANDELIVERYCOMPAREDTOVAGINALDELIVERY: ASYSTEMATICREVIEW
REV ASSOC MED BRAS 2014; 60(4):302-304 303
FIGURE 1 Hemorrhagic complications.
FIGURE 2 Infectious complications.
FIGURE 3 Breastfeeding complications.
FIGURE 4 Respiratory complications.
CDMR Vaginal delivery Risk difference Risk difference
Study or subgroup Events Total Events Total Weight M-H, fixed, 95% CI Year M-H, fixed, 95% CI
Karlström 2013 73 5,877 32 13,774 16.2% 0.01 [0.01, 0.01] 2013 Liu 2012 2,317 22,462 31,211 409,242 83.8% 0.03 [0.02, 0.03] 2012
Total (95% CI) 28,339 423,016 100.0% 0.02 [0.02, 0.03]
Total events 2,390 31,243
Heterogeneity: Chi² = 89.46, df = 1 (p < 0.00001); I² = 99% Test for overall effect: Z = 13.79 (p < 0.00001)
CDMR Vaginal delivery Risk difference Risk difference
Study or subgroup Events Total Events Total Weight M-H, fixed, 95% CI Year M-H, fixed, 95% CI
Karlström 2013 159 5,877 153 13,774 70.5% 0.02 [0.01, 0.02] 2013 Crowther 2012 2 1,098 1 1225 9.9% 0.00 [-0.00, 0.00] 2012 Dahigren 2009 91 1,046 2,900 38,021 17.4% 0.01 [-0.01, 0.03] 2009 Schindl 2003 1 147 0 903 2.2% 0.01 [-0.01, 0.02] 2003
Total (95% CI) 8,168 53,923 100% 0.01 [0.01, 0.02]
Total events 253 3,054
Heterogeneity: Chi² = 67.71, df = 3 (p < 0.00001); I² = 96% Test for overall effect: Z = 5.95 (p < 0.00001)
CDMR Vaginal delivery Risk difference Risk difference
Study or subgroup Events Total Events Total Weight M-H, fixed, 95% CI Year M-H, fixed, 95% CI
Karlström 2013 148 5,877 155 13,774 74.2% 0.01 [0.01, 0.02] 2013 Larsson 2011 8 247 8 294 2.4% 0.01 [-0.02, 0.03] 2011 Wang 2010 7 301 3 301 2.7% 0.01 [-0.01, 0.03] 2010 Dahigren 2009 1 1,046 104 38.021 18.3% -0.00 [-0.00, 0.00] 2009 Schindl 2003 0 147 1 903 2.3% -0.00 [-0.01, 0.01] 2003
Total (95% CI) 7,618 52,293 100% -0.01 [-0.01, 0.01]
Total events 164 271
Heterogeneity: Chi² = 160.55, df = 4 (p < 0.00001); I² = 98% Test for overall effect: Z = 6.05 (p < 0.00001)
CDMR Vaginal delivery Risk difference Risk difference
Study or subgroup Events Total Events Total Weight M-H, fixed, 95% CI Year M-H, fixed, 95% CI
Karlström 2013 579 5.877 935 13.774 46.9% 0.03 [0.02, 0.04] 2013 Crowther 2012 9 1.098 29 1.225 6.6% -0.02 [-0.03, -0.01] 2012 Larsson 2011 25 247 41 294 1.5% -0.04 [-0.09, 0.02] 2011 Wang 2010 12 301 2 301 1.7% 0.03 [0.01, 0.06] 2010 Souza 2010 27 2.685 2138 212.590 30.2% -0.00 [-0.00, 0.00] 2010 Dahigren 2009 10 1.046 189 38.021 11.6% 0.00 [-0.00, 0.01] 2009 Schindl 2003 0 147 17 903 1.4% -0.02 [-0.03, -0.01] 2003
Total (95% CI) 11.401 267.108 100% 0.01[0.01, 0.02]
Total events 662 3351
BERNARDO LS ETAL.
304 REV ASSOC MED BRAS 2014; 60(4):302-304
FIGURE 5 Emergency c-section score.
FIGURE 6 Apgar score.
CDMR Vaginal delivery Risk difference Risk difference
Study or subgroup Events Total Events Total Weight M-H, fixed, 95% CI Year M-H, fixed, 95% CI
Karlström 2013 0 5,877 838 13,774 68.9% -0.06 [-0.06, -0.06] 2013 Crowther 2012 109 1,098 367 1,225 9.7% -0.20 [-0.23, -0.17] 2012 Larsson 2011 25 247 45 294 2.2% -0.05 [-0.11, 0.00] 2011 Dahigren 2009 0 1,046 5,580 38,021 17% -0.15 [-0.15, -0.14] 2009 Schindl 2003 0 147 93 903 2.1% -0.10 [-0.12, -0.08] 2003
Total (95% CI) 8,415 54,217 100% -0.09 [-0.09, -0.09]
Total events 134 6,923
Heterogeneity: Chi² = 1120.43, df = 4 (p < 0.00001); I² = 100% Test for overall effect: Z = 40.41 (p < 0.00001)
CDMR Vaginal delivery Risk difference Risk difference
Study or subgroup Events Total Events Total Weight M-H, fixed, 95% CI Year M-H, fixed, 95% CI
Karlström 2013 0 1,046 182 38,021 17.8% -0.00 [-0.01, -0.00] 2013 Crowther 2012 38 5,877 252 13,774 72.1% -0.01 [-0.01, -0.01] 2012 Dahigren 2009 0 1,098 1 1,225 10.1% -0.00 [-0.00, 0.00] 2009
Total (95% CI) 8,021 53,020 100% -0.01 [-0.01, -0.01]
Total events 38 435