Dendritic thickness: a morphometric
parameter to classify mouse retinal
ganglion cells
1Department of Experimental Ophthalmology, University of Tübingen Eye Hospital,
Tübingen, Germany
2Laboratório de Biofísica Celular, Departamento de Fisiologia,
Universidade Federal do Pará, Belém, PA, Brasil
3Anatomisches Institut, 4Department of Medical Biometry, University of Tübingen,
Tübingen, Germany L.D. Loopuijt1,
M. da Silva Filho2,
B. Hirt3,
R. Vonthein4
and J. Kremers1
Abstract
To study the dendritic morphology of retinal ganglion cells in wild-type mice we intracellularly injected these cells with Lucifer yellow in an in vitro preparation of the retina. Subsequently, quantified values of dendritic thickness, number of branching points and level of stratifica-tion of 73 Lucifer yellow-filled ganglion cells were analyzed by statistical methods, resulting in a classification into 9 groups. The variables dendritic thickness, number of branching points per cell and level of stratification were independent of each other. Number of branching points and level of stratification were independent of eccentricity, whereas dendritic thickness was positively dependent (r = 0.37) on it. The frequency distribution of dendritic thickness tended to be multimodal, indicating the presence of at least two cell popula-tions composed of neurons with dendritic diameters either smaller or larger than 1.8 µm (“thin” or “thick” dendrites, respectively). Three cells (4.5%) were bistratified, having thick dendrites, and the others (95.5%) were monostratified. Using k-means cluster analysis, monos-tratified cells with either thin or thick dendrites were further subdi-vided according to level of stratification and number of branching points: cells with thin dendrites were divided into 2 groups with outer stratification (0-40%) and 2 groups with inner (50-100%) stratifica-tion, whereas cells with thick dendrites were divided into one group with outer and 3 groups with inner stratification. We postulate, that one group of cells with thin dendrites resembles cat ß-cells, whereas one group of cells with thick dendrites includes cells that resemble cat
α-cells. Correspondence
M. da Silva Filho Departamento de Fisiologia Instituto de Ciências Biológicas Universidade Federal do Pará 66075-110 Belém, PA Brasil
Fax: +55-91-3241-0032 E-mail: [email protected]
Research supported by the Deutsche Forschungssgemeinschaft (DFG), SFB 430-C3. J.J. Kremers is the recipient of a Heisenberg fellowship. M. da Silva Filho was supported by an exchange grant from the German and Brazilian governments (079/99/CAPES/DAAD/PROBAL).
Received May 26, 2006 Accepted May 21, 2007
Key words
•Ganglion cell morphology •Retinal circuitry
•Intracellular injection of
neurotracers
•Lucifer yellow •Dendritic thickness
Introduction
Retinal ganglion cells play a key role in the visual system mainly because they trans-fer the result of retinal processing to the
A thorough characterization of the morphol-ogy and physiolmorphol-ogy of these cells will shed light on their role in vision and on how diseases may affect the visual system.
The retinal ganglion cells of the domestic cat are possibly the most widely studied neurons of the visual system. During more than three decades of investigation, begin-ning in the sixties, several laboratories used either single unit electrical recordings or histological techniques to distinguish be-tween the different classes of cat retinal ganglion cells. Two independent classifica-tions, one based on physiology and the other based on anatomy were generated. Initially, ganglion cells were divided into X- and Y-classes according to their linear or non-lin-ear responses to alternating sine-wave grat-ings centered on the receptive field (1). Later, other ganglion cell classes were found in electrophysiological recordings and were collectively called W-cells in spite the fact that they did not represent a homogeneous group (2). Boycott and Wässle (3) used the method of Golgi to stain retinal ganglion cells in retinal flat mounts and to character-ize three main ganglion cell classes: α-, ß-,
and γ-cells, the latter comprising a heteroge-neous group. The use of retinal flatmounts allowed the observation that ganglion cell classes occur at all retinal locations and that their cell bodies and dendritic trees increase in size with increasing distance from the area centralis, paralleling the decrease of ganglion cell density as a function of eccen-tricity (3). It was also shown that α- and
ß-cells occur in two varieties, outer and inner cells, which have dendrites respectively lo-cated in the sublamina “a” and “b” of the inner plexiform layer (3,4). Indirect evidence (4) as well as direct intracellular recording and labeling (5,6) was used to establish that the α-, ß-, and γ-cells, distinguished in
ana-tomical studies, corresponded to the Y-, X-, and W-cells from physiological studies. By combining electrophysiology and anatomy, it was also shown that α- and ß-cell’s inner
and outer varieties corresponded to Y- and X-cells with on- and off-center receptive fields (5,7). More recently, a set of studies using either intracellular electrical recording and labeling (6,8,9) or intracellular labeling (10) have split the γ-cells into many different
classes. In addition, neurotracing studies of the visual system of the domestic cat have also demonstrated that every ganglion cell class has a specific pattern of connections with neurons in the lateral geniculate nucle-us, pulvinar, superior colliculnucle-us, and other visual centers in the diencephalon and mid-brain, stressing the fact that ganglion cells are at the origin of several visual pathways connecting the retina to the brain (4,10,11). The ganglion cells of several other mam-mals, such as primates, rabbits, ferrets, and opossum (8,12-17), have also been studied with similar techniques, and the results indi-cate that, similarly to the ganglion cells of the domestic cat, they also give rise to spe-cialized, parallel visual pathways in all such animals (for reviews, see Refs. 15 and 18). Several studies have been performed in spe-cies that belong to all rodent suborders: Sciuromorpha (squirrel, 19; chipmunk, 20), Hystricomorpha (guinea pig, 21; agouti, 22), Myomorpha (rat, 23-25 and mouse, 26-28). These studies suggest an intimate correla-tion between the morphology of retinal gan-glion cells and their physiological proper-ties. Therefore, detailed dendritic analysis of ganglion cells in a given species might be the first step to provide a solid basis for a detailed functional analysis in the future.
sensitivities have been described: one group mainly receiving inputs from short wave-length sensitive cones (absorption peak in the UV region of the spectrum, 375 nm); a second group receiving inputs from the middle wavelength sensitive cones (absorp-tion peak at 500 nm), and a third group receiving input from both of these cones (29).
Some morphological studies are avail-able about mouse retinal ganglion cells. Doi et al. (26) described the dendritic morpholo-gy of mouse ganglion cells using retrograde transport of horseradish peroxidase injected into the optic nerve to identify the ganglion cell bodies and subsequent filling of cell bodies and dendritic trees. Sun et al. (27) filled ganglion cells with DiI by shooting DiI attached to particles into the cells with the aid of a gene gun. Badea and Nathans (30) used an alkaline phosphatase reporter gene to image several classes of retinal neurons including ganglion cells. Kong et al. (31) obtained ganglion cell labeling with DiI or Lucifer yellow (LY) injections or by imag-ing a fluorescent protein expressed in trans-genic mice. More recently, Coombs et al. (32) used three independent methods (LY injections, “DiOlistic” labeling and yellow fluorescent protein expressed by transgenic mice) to label ganglion cells and performed a cluster analysis based on 14 morphometric parameters. Two studies focused on mouse
α-ganglion cells using intracellular
injec-tions with micropipettes: Schubert et al. (33) applied neurobiotin and the connexin36 an-tibody while Völgyi et al. (34) injected neurobiotin alone. Weng et al. (28) recorded On-Off direction-selective ganglion cell re-sponses by the patch-clamp technique and some cells were filled with neurobiotin or LY to visualize their respective morpholo-gy.
In the present study, we used intracellu-lar injection of LY to label the cell bodies, dendritic trees, and axons of mouse retinal ganglion cells. We quantified several
mor-phological parameters (dendritic thickness, level of stratification, and number of branch-ing points) which were used for the analysis of the dendritic morphology of ganglion cells of the mouse using a statistical procedure. A similar approach was used by Badea and Nathans (30), Kong et al. (31) and Coombs et al. (32) in the mouse retina. These studies found that dendritic field diameter can be used as a main parameter to distinguish dif-ferent ganglion cell classes. In the present study, we adopted an alternative parameter which is seldom studied, i.e., dendritic thick-ness. As the mouse is becoming the pre-ferred model species also for retinal studies, a classification based on quantified proper-ties of cells will be useful in the future for the comparison of genetically modified and wild-type animals, allowing statistical evaluation of possible differences in dendritic morphol-ogy.
Material and Methods
Animals
Adult C57 BL/6 mice (male, 2 to 3 months of age) were housed in special animal facili-ties with a light/dark cycle of 12 h on/off, kept in macrolon cages and fed dry food pellets and water ad libitum.
Surgery
from the sclera, choroid and pigment epithe-lium. The vitreous was removed by incubat-ing the retina for 50 s in a solution of colla-genase (CLSPA, 924 µ/mg, 120 µ/mL; Wor-thington Biochemical Corporation, Lake-wood, CO, USA) and hyaluronidase (581 µ/mg, 465 µ/mL; Worthington). The retina was subsequently incubated for 10 min in 0.03% 4',6-diamidino-2-phenylindole (DAPI) and transferred, ganglion cell layer up, to an incubation chamber, that was mounted on a fluorescent microscope (Olym-pus BX50, Tokyo, Japan).
Intracellular staining
The incubation chamber was perfused with oxygenated AMES medium at room temperature at 2 to 3 mL/min. Using a water immersion objective, neurons in the gan-glion cell layer (GCL) were impaled under visual control at a magnification of 400X with a sharp electrode that contained a solu-tion of 5% LY and 0.1 M LiCl (resistance between 50 and 150 MOhm). By means of iontophoresis, the dye was transferred into the cell (at -4.0 nA over a period of 5 to 10 min). A single in vitro retina preparation could be used for cell filling for up to 5 h of incubation. Then, the retina was fixed in 4% phosphate-buffered paraformaldehyde for 16 h at 4ºC, mounted on a slide and coverslip-ped in glycerine/phosphate-buffered saline (9:1). The retina of the second eye was simi-larly prepared and also used for intracellular staining.
Visualization of the preparation
The cells in these whole mount prepara-tions were visualized with a fluorescence microscope (Olympus AX70), using an ex-citation filter (U-MWBV) transmitting light at 400-440 nm and a barrier filter with a cutoff at 475 nm or a laser scan microscope (Zeiss, Oberkochen, Germany), using an Argon laser (output at 488 nm). In the laser
scan microscope, individual cells in the whole mount preparation were digitized, resulting in a stack of images, each with a thickness of 0.5 to 1.0 µm. The total number of images in a stack ranged from 25 to 55. With such a stack, reconstructions of filled cells were made with the software of the Zeiss confocal microscope.
Photographs obtained on slide film with the fluorescence microscope were digitized in a scanner with Adobe Photoshop version 7.0. The digitized images of the laser scan microscope were optimized for contrast and black-white converted with Adobe Photo-shop.
Parameter quantification
In these whole mount preparations, gan-glion cells were identified against displaced amacrine cells by the presence of a dye-filled axon, which, in turn, was found by searching for a nerve fiber projecting in parallel with the inner plexiform layer (IPL). We measured the following parameters of 73 ganglion cells: eccentricity, dendritic tree area, dendritic thickness, and number of branching points. In 62 of these cells, the level of stratification was also measured.
Eccentricity. At low magnification, the location of all filled ganglion cells within the retina was documented and the eccentricity -the distance to -the area with -the highest ganglion cell density (35) - was measured. Dendritic tree area, dendritic thickness, num-ber of branching points, and stratification were measured in 65 cells with the laser scan microscope, whereas in a minority of the cells (N = 8) these parameters were meas-ured with the fluorescent microscope.
determined. The area of an ellipse with these measures as major and minor axes was cal-culated. The dendritic thickness was meas-ured as the diameter of the two daughter dendrites just distal to the most proximal branching points. The number of branching points was determined for each cell with the laser scan microscope by observing indi-vidual images of a stack, and with the fluo-rescence microscope by focusing up and down through the cell at a magnification of 400X.
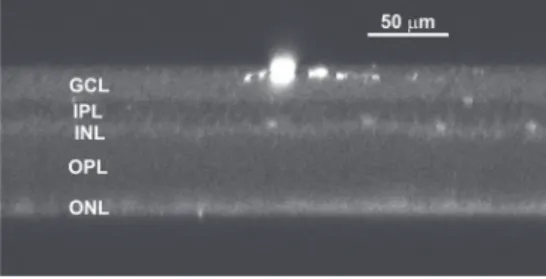
Stratification. With the laser scan micro-scope, the level of stratification was deter-mined by using transverse optical sections to measure the thickness of the IPL and the distance between inner nuclear layer (INL) and dendritic tree (Figure 1), using the Scion-Image software (NIH freeware). These dis-tances were measured at 5 locations at regu-lar intervals along the dendritic tree as seen in cross-section. Since the thickness of the IPL varied in our material (from 12 to 25 µm), the level of stratification was expressed as percent total thickness of the IPL at the location of each cell. The 5 measurements were averaged for each cell and the mean values were allocated to bins of 10%. In the few cases of diffuse stratification, the mid-line of the dendritic tree in cross-section was taken for the measurements of the distance to the INL-IPL border. With the fluores-cence microscope, the total thickness of the IPL and the distance from the INL to the dendritic tree was measured by focusing through the whole mount preparation, fol-lowed by visualization of the DAPI-stained nuclei in the INL and GCL and the LY-filled dendritic tree under appropriate filter com-binations. For these vertical measurements, the units on the focusing knob were cali-brated.
Statistical analysis
Cell types are described in terms of mean + SD data of several variables in a cluster of
similar cells. Correlations between these variables were computed as Pearson’s prod-uct-moment coefficient of correlation r. A slope was estimated by linear regression and its 95%-confidence interval (CI) is given. Normality was tested by the Shapiro-Wilks test.
Cells were divided into cells with “thin” and “thick” dendrites on the basis of the distribution of dendritic thickness (see Re-sults section). Subsequently, cells were di-vided into monostratified and bistratified cells according to the presence of one and two dendritic stratifications, respectively. Then, the monostratified cells with “thin” and “thick” dendrites were divided into 4 groups each according to their level of strati-fication and number of branching points by means of a k-means cluster analysis. In this cluster analysis, it is necessary to provide the number k of cluster seeds (here 2 x 4). After k cluster seeds are selected as the first guess for the means of the clusters, each observa-tion is assigned to the nearest seed to form a set of temporary clusters. The seeds are then replaced by the cluster means, the points are reassigned, and the process continues until no further changes occur in the clusters. The JMP 4.0.5 software (SAS Institute Inc., Cary, NC, USA) was used for all calculations.
Results
In the present study, cells with cell bod-ies in the GCL were filled with LY. At the time of penetration of the cell body it was not possible to identify unequivocally if a cell was a retinal ganglion cell or a displaced amacrine cell. Therefore, after cell filling,
cells were identified as ganglion cells by the presence of a clearly distinguishable axon. Of 86 LY-filled retinal ganglion cells, the eccentricity, dendritic tree area, dendritic thickness, and number of branching points of 73 cells could be determined; the level of stratification was calculated for 62 of these 73 cells.
Mutual dependency of parameters
In order to classify cells effectively by means of quantified variables, these
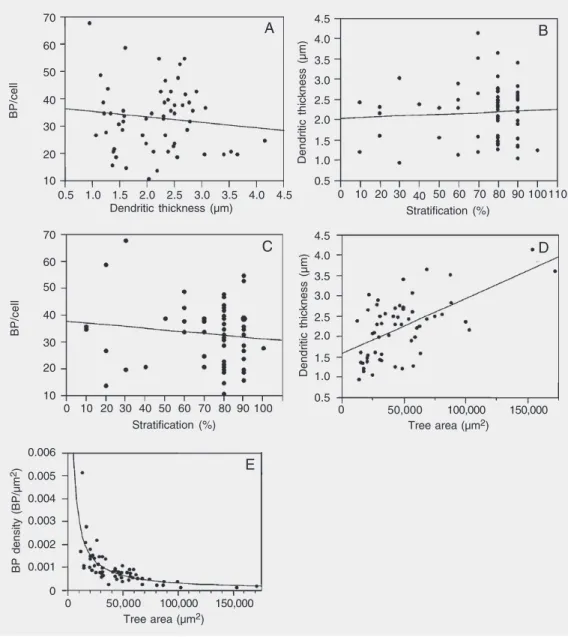
vari-ables should be independent of one another (12,36). We observed that the number of branching points per cell was independent of dendritic thickness (Figure 2A). In addition, the dendritic thickness did not correlate with the level of stratification (Figure 2B). Fur-thermore, there was no correlation between the stratification and the number of branch-ing points per cell (Figure 2C). In contrast, dendritic thickness and dendritic tree area were correlated (r = 0.58; N = 73; Figure 2D) and cells with large dendritic tree areas had a lower branching point density than cells with
Figure 2. Correlation of dendritic thickness with A, number of branching points per cell (r = -0.01), B, stratification (r = 0.01), and C, stratification with the number of branching points per cell (r = -0.12). D, and E, Corre-lation of dendritic tree area (tree area) with dendritic thickness (D; r = 0.58) and branching point density (E; r = -0.72). Note that the number of branching points per cell and the stratification are not correlated with the dendritic thickness, nor is the number of branching points per cell corre-lated with stratification. BP/cell = number of branching points per cell; BP density = number of branching points per unit area of dendritic tree. Lines are linear regressions, in E on 1/tree area.
BP/cell
70
60
50
40
30
20
10
0.5 1.0 1.5 2.0 2.5 3.0 3.5 4.0 4.5 Dendritic thickness (µm)
A
Dendritic thickness (µm)
4.5
4.0
3.5
3.0
2.5
2.0
1.5
0 10 20 30 40 50 60 70 80 Stratification (%)
B
1.0
0.5
90 100110
BP/cell
70
60
50
40
30
20
10
0 10 20 30 40 50 60 70 80 Stratification (%)
90 100
C D
E
BP density (BP/µm
2)
0.006
0.005
0.004
0.003
0.002
0.001
0
Dendritic thickness (µm)
4.5
4.0
3.5
3.0
2.5
2.0
1.5 1.0
0.5
0 50,000 100,000 150,000 Tree area (µm2)
50,000 100,000 150,000 Tree area (µm2)
small dendritic tree areas (Figure 2E).
Dependence on eccentricity
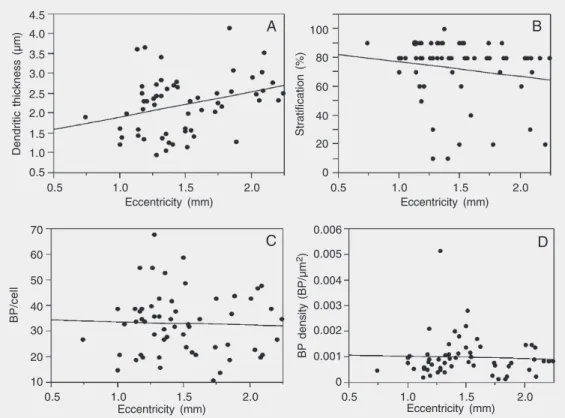
Another parameter that might influence any of the measured variables is retinal ec-centricity, which is defined as the distance of the cell from the area of highest density of ganglion cells (area centralis). In retinae of other species such as the cat, the dendritic tree diameter, and consequently the den-dritic tree area, depend on cell eccentricity (3). We found that dendritic thickness ap-peared to be eccentricity dependent (slope 0.73 µm/mm (CI - 0.24 to 1.23 µm/mm), Figure 3A).
Because the IPL differed in thickness in our preparations, the level of stratification was expressed as a percentage of the total thickness of the local IPL. Expressed this way, the level of stratification was inde-pendent of eccentricity (Figure 3B). We ob-served that we filled more inner than outer
stratified cells at any given eccentricity (Fig-ure 3B). The number of branching points per cell was also independent of the eccentricity (Figure 3C), as was the branching point density (Figure 3D).
In summary, none of the variables men-tioned are correlated with one another, ex-cept for dendritic thickness and dendritic tree area. Nor were any of the variables, apart from dendritic thickness, dependent on retinal eccentricity. With these properties of the relationships between the various pa-rameters in mind, we classified the LY-filled ganglion cells.
Cell grouping on the basis of dendritic thickness
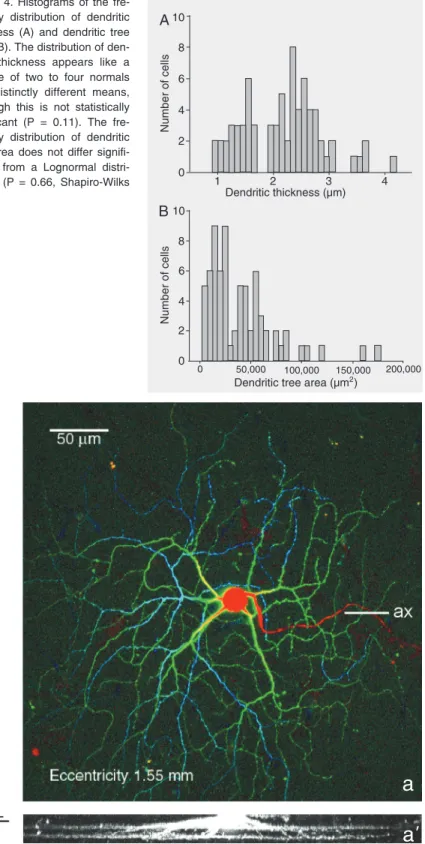
Figure 4A shows the frequency of distri-bution of dendritic thickness. The distribu-tion of this variable appears to be multimodal, tending to differ from normal; however, not statistically different (Shapiro-Wilks test, P
Dendritic thickness (µm)
4.5
4.0
3.5
3.0
2.5
2.0
1.5
0.5 1.5 2.0
A
1.0
0.5
Eccentricity (mm)
1.0 0.5 1.5 2.0
Eccentricity (mm) 1.0
Stratification (%)
100
80
60
40
20
0
0.5 1.5 2.0
Eccentricity (mm)
1.0 0.5 1.5 2.0
Eccentricity (mm) 1.0
BP/cell
70
60
50
40
10 20 30
BP density (BP/µm
2)
0.006
0.005
0.004
0.003
0.002
0.001
0
B
C D
= 0.11). The histogram (Figure 4A) appears to represent at least two different cell popu-lations, the first with cells with a dendritic thickness <1.8 µm and the second group with a dendritic thickness >1.8 µm. The distribution of dendritic tree area, a variable that is correlated with dendritic thickness (Figure 2D; slope of line is 13.4 µm/mm²; CI = 8.4 to 18.4 µm/mm²), also displayed a multimodal distribution (Figure 4B). The distribution of the tree areas differed signifi-cantly from normal (Figure 4B; P < 0.0001), but not from a normal distribution of loga-rithmic tree area (lognormal distribution, P = 0.66). Thus, this distribution might suggest the presence of several cell types with dis-tinct tree areas although one distribution cannot be excluded. One cell, however, had a tree area of 960,600 µm2, being an order of
magnitude larger than the rest of the cells. This cell is not included in the histogram of Figure 4B. A drawing of this cell is depicted in Figure 8D.
Because separation of the cells into two populations was more distinct on the basis of dendritic thickness, we used this parameter rather than the dendritic tree area to divide the complete cell population into two groups: one with thickness <1.8 µm (cells with thin dendrites), and a second population with a thickness >1.8 µm (cells with thick den-drites).
Mono- and bistratified cells
Both mono- and bistratified cells were present in our sample: 3 of 73 cells (4.5%) were bistratified, whereas the majority of the cells (N = 70) were monostratified. All of these bistratified cells had a dendritic thick-ness larger than 1.8 µm. An example of a bistratified cell is shown in Figure 5. There was a single cell with dendritic thickness of 4.1 µm. This cell was not considered to be fundamentally different from the others. Monostratified cells with thick and thin den-drites were separately analyzed according to Figure 4. Histograms of the
fre-quency distribution of dendritic thickness (A) and dendritic tree area (B). The distribution of den-dritic thickness appears like a mixture of two to four normals with distinctly different means, although this is not statistically significant (P = 0.11). The fre-quency distribution of dendritic tree area does not differ signifi-cantly from a Lognormal distri-bution (P = 0.66, Shapiro-Wilks test).
Figure 5. Laser scan microscope projection image of Lucifer yellow-filled ganglion cell. a = top view, a’ = lateral view. Orientation of panel a’: ganglion cell layer (GCL) up, inner plexiform layer (IPL) down. Note in lateral view the two parallel dendritic stratification levels. Colors in (a) are coded for depth: red is superficially, green intermediately and blue deeply located (as perceived from the ganglion layer side). ax = axon.
GCL
IPL
a
’
Table 1. Grouping of mouse ganglion cells according to four variables: dendritic thickness, mono- or bistratification, level of stratification, and number of branching points.
Thin dendrites (N) Thick dendrites (K)
Monostratification (NM) Monostratification (KM) Bistratification (KB)
Outer stratification (NMo) Inner stratification (NMi) Outer Inner stratification stratification (KMi)
(KMo)
Few branching Many branching Few branching Many branching Few branching Intermediate Many points (NMof) points (NMom) points (NMif) points (NMim) points (KMif) number of branching
branching points points (KMii) (KMim)
Cells were divided into groups according to dendritic thickness (thin = N; thick = K) and then divided into monostratified and bistratified cells (monostratified = M; bistratified = B). Finally, the two groups of monostratified cells (with thin and thick dendrites) were each subdivided by level of stratification (outer = o; inner = i) and number of branching points per cell (few = f; intermediate = i; many = m). This procedure resulted in 9 groups. their level of stratification and number of
branching points by k-means cluster analy-sis. Aiming at a maximal separation along the axis of stratification, we found that, with our sample size, if we chose k = 4 seeding points for each subgroup of monostratified cells (resulting in the number of clusters, see Material and Methods), the cell groups would fall into a category with either an outer (<40%) or inner (>50%) stratification.
Cells with thin dendrites
The group of cells with thin dendrites was divided into a group of cells with an inner stratification (50 to 100%; NMi) and a group of cells with an outer stratification (0% to 40%; NMo) (Table 1; Figure 6A). Additionally, cells with an outer stratifica-tion could be divided into two groups: group NMom (N = 2, with many branching points; mean level of stratification, 25%; number of branching points per cell, 64), and group NMof (N = 3, with few branching points; 20% (± 10%) stratification; number of branching points per cell 27 (± 7)); see Table 1 and Figure 6A. Cells with thin dendrites and inner stratification (NMi) were divided into two groups, one with few branching
points (group NMif; 85% (± 7%) stratifica-tion; number of branching points 25 (± 7); N = 11), and the other (group NMim) with more branching points (mean level of strati-fication 66% (± 11%); mean number of branching points 40 (± 6); N = 5).
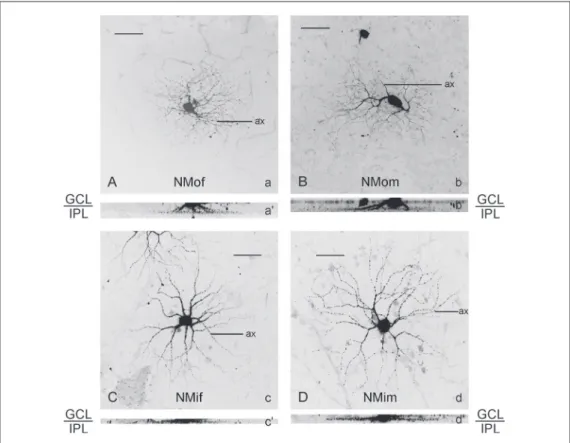
Figure 7 shows examples of monostrati-fied cells with thin dendrites. Cells with an outer stratification (NMof and NMom) are displayed in Figure 7A and B. Inner strati-fied cells are shown in Figure 7C and D. The differences in levels of stratification can be appreciated from the lateral views shown in the lower panels of each Figure (compare panels a’ and b’ with panels c’ and d’).
Cells with thick dendrites
strati-fication levels (75% (± 12%)) and an inter-mediate number of branching points (37 (± 3)), Table 1; Figure 6B). The two other groups were further stratified towards the inner retina; one group had few branching points (group KMif; stratification level 83% (± 8%); number of branching points 22 (± 5); N = 12), and the second group had many branching points at the same stratification level (group KMim; stratification level 84% (± 5%); number of branching points 49 (± 5); N = 7).
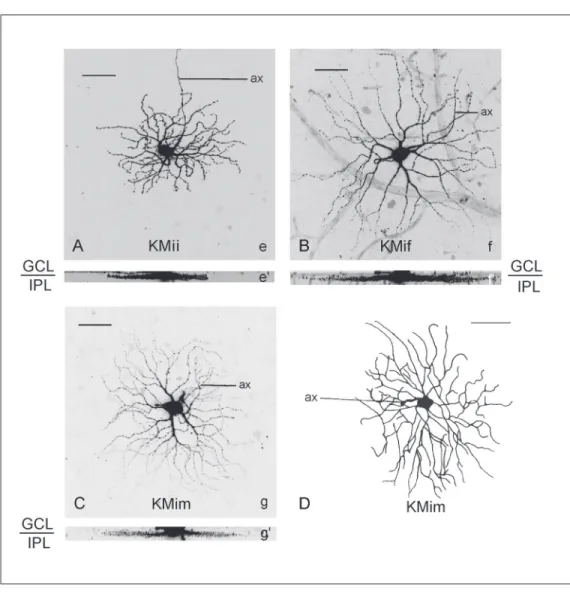
Examples of cells with thick dendrites are shown in Figure 8. Differences in num-ber of branching points can be appreciated when comparing cells of Figure 8B of group KMif with those of Figure 8A and C of groups KMii and KMim, respectively.
Using the hierarchical grouping of our filled ganglion cells described above, we classified the cells into 9 groups (Table 1). Figure 6. Graphic
representa-tion of cluster analysis of mono-stratified cells with thin dendrites (<1.8 µm; A) or thick dendrites (>1.8 µm; B). Every dot repre-sents a separate cell (in a few instances 2 cells). A, a, b, c, and d refer to cells that are depicted as examples in Figure 7. B, e, f, g, and h refer to cells that are depicted as examples in Figure 8. NMof, NMom, NMif, NMim, KMo, KMii, KMif, and KMim are codes for the different cell groups, the properties of which are listed in Table 1. BP/cell = number of branching points per cell.
Figure 7. Laser scan microscop-ic projection images of examples of cells with thin dendrites (<1.8 µm). a, b, c, d = top view; a’, b’, c’, d’ = lateral view. a, b, c, and d refer to letters of individual cells in Figure 6A. Note the difference in number of branching points in C and D. Bars represent 50 µm. ax = axon; GCL = ganglion cell layer; IPL = inner plexiform layer. NMof, NMom, NMif, and NMim refer to group numbers; also see Figure 6A and Table 1.
BP/cell
70
60
50
40
30
20
10
0
0 20 40 60 80 100
BP/cell
70
60
50
40
30
20
10
0
0 20 40 60 80 100 Stratification (%)
Stratification (%) b
NMom
NMim
d
c
NMif a
NMof
KMim
KMii
KMo
KMif h
g
e
f A
B
Figure 8. Laser scan microscop-ic projection images (A, B, C) and ink drawing (D) of examples of cells with thick dendrites (>1.8 µm). e, f, g = top view; e’, f’, g’ = lateral view. Note the dif-ference in number of branching points of the cell in B (cell f, group KMif) as compared to A and C (cell e, group KMii, cell g, group KMim). D, Cell with very large dendritic tree area and thick dendrites. It is monostrati-fied with a stratification level of 90%.e, f, and g refer to letters of individual cells in Figure 6B. KMii, KMif and KMim refer to abbreviations used in Table 1 and Figure 6. Bars represent 50 µm in A, B, and C and 273 µm in D. ax = axon; GCL = ganglion cell layer, IPL = inner plexiform layer.
Figure 9. Schematic represen-tation of dendritic trees of mouse retinal ganglion cells lo-cated in the inner plexiform layer. Note that these ganglion cells have their cell bodies situ-ated in the ganglion cell layer. Grey areas represent the range of stratification levels for each cell group. subl. a = inner plexi-form sublayer A; subl. B = inner plexiform sublayer b. See Table 1 for other abbreviations.
subl. a
subl. b
0%
20%
40%
80% 60%
100%
NMof NMom NMim NMif
KMo
The results for monostratified cells are sche-matically summarized in Figure 9. The groups of cells with the highest number of branch-ing points (groups NMom and KMim) are found either at outer (20 to 30%) or far inner (80 to 90%) stratification levels, but are not present in intermediate strata (30 to 80%). The present classification is not complete. For example, a larger sample than three cells would probably allow subdivisions of the KMo group similar to those of the KMi group.
Discussion
We used a quantitative analysis to de-scribe the dendritic morphology of mouse retinal ganglion cells, and divided the cells into 2 main groups according to dendritic thickness, and subsequently subdivided these main groups, so that a total of 9 groups were described.
Technical considerations
The predominance of inner stratified cells in our sample was striking (see Figure 6A,B). This may have been due to a technical rea-son. We used intracellular injections with sharp electrodes to visualize the morpholo-gy of dendritic tree, cell body and axon of ganglion cells of the GCL. Compared to the Golgi technique, injection with sharp elec-trodes has the advantage that the investiga-tor can choose the cells that are injected. But there are three reasons why this method might introduce a bias by filling mainly inner stratified cells. First, the location of the cell bodies within the GCL might be of importance: if cell bodies that have a more inner location in the GCL have more fre-quently an inner stratification of their den-drites in the IPL, then in our in vitro prepara-tion, more superficially located cell bodies of inner stratified cells are more easily im-paled than the more deeply located cell bod-ies of outer stratified cells. Second, the
trans-port within the dendritic tree might be more difficult within outer than inner stratified neurons because dendrites with an outer stratification form an angle of about 90º to 120º with the primary dendrites, that cross the IPL from the cell body in the GCL to the IPL-INL border. Such an “angled” dendrite might be more easily damaged, causing ob-struction of transport. Third, displaced gan-glion cells with cell bodies within the INL may mainly stratify in outer parts of the IPL. Doi et al. (26) provided evidence that the dendrites of displaced ganglion cells in the mouse indeed are located in the outer strata of the IPL, whereas no inner stratified dis-placed ganglion cells were found. Consis-tently, Badea and Nathans (30) reported a single-displaced ganglion cell in their sam-ple which also showed an outer stratification in the IPL. Since we did not inject cells in the INL, this subpopulation is not represented in our sample of ganglion cells, a fact that might lead to an under-representation of outer stratified ganglion cells.
The procedure of quantitative analysis
population of ganglion cells cannot be viewed as one group of cells with a large range of dendritic thicknesses but as two discrete, well-separated populations with either thin (group N) or thick (group K) dendrites. In contrast, the logarithmic values of dendritic tree area did not show a significant deviation from a single-normal distribution, so that a separation into two or more separate popula-tions seems to be unlikely, although multi-modality cannot be excluded. Thus, we con-sidered the dendritic thickness more suitable for the separation of mouse retinal ganglion cells into different groups than the dendritic tree area and used the parameter dendritic thickness instead of tree area, as used by other studies (30-32), as a basis for classifi-cation. In addition, we used the parameters stratification and number of branching points per cell to further classify the cell popula-tions.
An additional reason to choose the vari-ables mentioned above is that they are re-lated to physiological function. The stratifi-cation determines if a cell is of the on-center or off-center type. The thickness of a den-drite determines the intracellular electrical resistance (37), implying that local excita-tory postsynaptic potentials (EPSPs) and in-hibitory postsynaptic potentials (IPSPs) will spread less readily over large distances in thin than in thick dendrites, thus influencing the extent of integration of different synaptic EPSPs and IPSPs within a dendritic tree. The branching pattern of a dendritic tree, quantified by its number of branching points, is a major determinant of how and in which direction signals will be transported and, therefore, how a neuron will integrate in-coming information (38), confirming a pre-diction made by Rall in the mid-1960’s (37). The quantitative analysis applied revealed two separate populations on the basis of dendritic thickness. Moreover, the subse-quent analysis of monostratified KM and NM cells by stratification revealed that there was a discrete separation between inner and
outer stratified cells. Thus, monostratified cells with thick dendrites were divided into groups KMi and KMo, most probably repsenting on-center and off-center cells, re-spectively. Similarly, monostratified cells with thin dendrites were divided into the groups NMi and NMo. Finally, these groups were divided according to their number of branching points.
Classification: comparison with other studies
wide-field ganglion cells. A recent parametric study (32) suggested that mouse ganglion cells can be morphologically classified into 14 clus-ters (10 monostratified and 4 bistratified). Overall, these results were in a good agree-ment with those reported by other groups (26,27).
Two other studies on the mouse retina described the connexin36 pattern of expres-sion in the α-ganglion cells (33,34). Despite
their different results regarding the role of connexin36 in α-to-α cell coupling, their α
-ganglion cell morphological data were con-sistent with the studies discussed above.
Because we used dendritic thickness as the main grouping variable instead of den-dritic tree area or diameter, this difference in approach to classification between the pres-ent study and the mouse ganglion cell stud-ies mentioned above impairs comparisons and, therefore, we will only make two brief comments.
We confirmed the observations of Sun et al. (27), Badea and Nathans (30), and Coombs et al. (32) that, in mice, there is lack of eccen-tricity dependence of the tree area or tree diameter, which was also found for rat retinal ganglion cells (23,25). This is not surprising in view of the fact that the density of ganglion cells in the central retina is only slightly higher than in peripheral retina (1:4 (35,39)).
Furthermore, none of the previous stud-ies on the mouse retina observed cells with a very large tree area, a feature we detected occasionally and of which we documented one example (Figure 8D): our large cell had a tree diameter of 1270 µm, while the largest tree diameter observed in other studies was 442 µm (27), ~270 µm (30), ~340 µm (31), and ~535 µm (32). However, Perry (23) mentioned the occurrence of very large gan-glion cells in the rat retina.
Dendritic thickness and dendritic tree area size
We found that the dendritic thickness parameter was significantly correlated with
dendritic tree area: cells with large dendritic trees possess thicker dendrites than small cells. In our sample, we did not find large cells with thin dendrites. The correlation between dendritic tree size and dendritic thickness would make sense in view of the fact that the propagation velocity of EPSPs is positively correlated with dendritic thick-ness (38). Therefore, an EPSP elicited far from the cell body may not contribute to the formation of an axonal potential when the dendrites are thin. On the other hand, small cells with thick dendrites might be func-tional. Indeed, we encountered small cells with thick dendrites in our sample.
Bistratified cells
On-Off direction-selective ganglion cells. In conclusion, the result of the present study suggests that dendritic thickness is an important variable to be taken into account for morphometric analysis. By using this parameter, we were able to classify mouse retinal ganglion cells into two main groups: one with thin dendrites, similar to cat ß-cells, and the other with thick dendrites, resem-bling cat α-cells. These findings support the
hypothesis that α- and ß-cells are a common
feature found in the majority of mammalian retinas.
Acknowledgments
The authors are grateful to Ms. Birgit Regelmann for expert technical assistance and to Dr. L.C.L. Silveira for valuable com-ments about the manuscript.
References
1. Enroth-Cugell C, Robson JG. The contrast sensitivity of retinal ganglion cells of the cat. J Physiol 1966; 187: 517-552.
2. Fukuda Y, Stone J. Direct identification of the cell bodies of Y-, X-and W-cells in the cat’s retina. Vision Res 1975; 15: 1034-1036. 3. Boycott BB, Wässle H. The morphological types of ganglion cells of
the domestic cat’s retina. J Physiol 1974; 240: 397-419.
4. Wässle H, Boycott BB, Illing RB. Morphology and mosaic of on- and off-beta cells in the cat retina and some functional considerations. Proc R Soc Lond B Biol Sci 1981; 212: 177-195.
5. Saito HA. Morphology of physiologically identified X-, Y-, and W-type retinal ganglion cells of the cat. J Comp Neurol 1983; 221: 279-288.
6. Stanford LR. W-cells in the cat retina: correlated morphological and physiological evidence for two distinct classes. J Neurophysiol 1987; 57: 218-244.
7. Nelson R, Famiglietti EV Jr, Kolb H. Intracellular staining reveals different levels of stratification for on- and off-center ganglion cells in cat retina. J Neurophysiol 1978; 41: 472-483.
8. Wingate RJ, Fitzgibbon T, Thompson ID. Lucifer yellow, retrograde tracers, and fractal analysis characterise adult ferret retinal ganglion cells. J Comp Neurol 1992; 323: 449-474.
9. O’Brien BJ, Isayama T, Richardson R, Berson DM. Intrinsic physi-ological properties of cat retinal ganglion cells. J Physiol 2002; 538: 787-802.
10. Berson DM, Dunn FA, Takao M. Phototransduction by retinal gan-glion cells that set the circadian clock. Science 2002; 295: 1070-1073.
11. Magalhaes-Castro HH, Murata LA, Magalhaes-Castro B. Cat retinal ganglion cells projecting to the superior colliculus as shown by the horseradish peroxidase method. Exp Brain Res 1976; 25: 541-549. 12. Rodieck RW, Brening RK. Retinal ganglion cells: properties, types, genera, pathways and trans-species comparisons. Brain Behav Evol 1983; 23: 121-164.
13. Amthor FR, Oyster CW, Takahashi ES. Morphology of on-off direc-tion-selective ganglion cells in the rabbit retina. Brain Res 1984; 298: 187-190.
14. Watanabe M, Rodieck RW. Parasol and midget ganglion cells of the primate retina. J Comp Neurol 1989; 289: 434-454.
15. Wassle H, Boycott BB. Functional architecture of the mammalian retina. Physiol Rev 1991; 71: 447-480.
16. Famiglietti EV. Class I and class II ganglion cells of rabbit retina: a
structural basis for X and Y (brisk) cells. J Comp Neurol 2004; 478: 323-346.
17. Moraes AM, Oliveira MM, Hokoc JN. Retinal ganglion cells in the South American opossum (Didelphis aurita). J Comp Neurol 2000; 418: 193-216.
18. Kremers J, Usui T, Scholl HP, Sharpe LT. Cone signal contributions to electroretinograms [correction of electrograms] in dichromats and trichromats. Invest Ophthalmol Vis Sci 1999; 40: 920-930. 19. Linberg KA, Suemune S, Fisher SK. Retinal neurons of the
Califor-nia ground squirrel, Spermophilus beecheyi: a Golgi study. J Comp Neurol 1996; 365: 173-216.
20. Wakakuwa K, Sumitomo I, Sugitani M, Fukuda Y. Retinal inputs to the geniculate relay cells in the eastern chipmunk (Tamias sibiricus asiaticus): a comparison between color and non-color sensitive cells. Brain Res 1987; 404: 211-220.
21. Demb JB, Haarsma L, Freed MA, Sterling P. Functional circuitry of the retinal ganglion cell’s nonlinear receptive field. J Neurosci 1999; 19: 9756-9767.
22. Gomes FL, Yamada ES, Silveira LCL. Morphology, size and distri-bution of the alpha retinal ganglion cells of the agouti, Dasyprocta aguti. Invest Ophthalmol Vis Sci 1997; 39: S563 (Abstract). 23. Perry VH. The ganglion cell layer of the retina of the rat: a Golgi
study. Proc R Soc Lond B Biol Sci 1979; 204: 363-375.
24. Buhl EH, Dann JF. Morphological diversity of displaced retinal gan-glion cells in the rat: a lucifer yellow study. J Comp Neurol 1988; 269: 210-218.
25. Huxlin KR, Goodchild AK. Retinal ganglion cells in the albino rat: revised morphological classification. J Comp Neurol 1997; 385: 309-323.
26. Doi M, Uji Y, Yamamura H. Morphological classification of retinal ganglion cells in mice. J Comp Neurol 1995; 356: 368-386. 27. Sun W, Li N, He S. Large-scale morphological survey of mouse
retinal ganglion cells. J Comp Neurol 2002; 451: 115-126. 28. Weng S, Sun W, He S. Identification of ON-OFF direction-selective
ganglion cells in the mouse retina. J Physiol 2005; 562: 915-923. 29. Ekesten B, Gouras P, Yamamoto S. Cone inputs to murine retinal
ganglion cells. Vision Res 2000; 40: 2573-2577.
30. Badea TC, Nathans J. Quantitative analysis of neuronal morpholo-gies in the mouse retina visualized by using a genetically directed reporter. J Comp Neurol 2004; 480: 331-351.
cells in the mouse retina: Unsupervised morphological classification and its limits. J Comp Neurol 2005; 489: 293-310.
32. Coombs J, van der List D, Wang GY, Chalupa LM. Morphological properties of mouse retinal ganglion cells. Neuroscience 2006; 140: 123-136.
33. Schubert T, Degen J, Willecke K, Hormuzdi SG, Monyer H, Weiler R. Connexin36 mediates gap junctional coupling of alpha-ganglion cells in mouse retina. J Comp Neurol 2005; 485: 191-201. 34. Völgyi B, Abrams J, Paul DL, Bloomfield SA. Morphology and tracer
coupling pattern of alpha ganglion cells in the mouse retina. J Comp Neurol 2005; 492: 66-77.
35. Jeon CJ, Strettoi E, Masland RH. The major cell populations of the mouse retina. J Neurosci 1998; 18: 8936-8946.
36. Famiglietti EV. New metrics for analysis of dendritic branching pat-terns demonstrating similarities and differences in ON and ON-OFF
directionally selective retinal ganglion cells. J Comp Neurol 1992; 324: 295-321.
37. Rall W. Theoretical significance of dendritic trees for neuronal input-output relations. In: Reiss RF (Editor), Neural theory and modeling. Stanford: Stanford University Press; 1964. p 73-97.
38. Koch C, Poggio T, Torre V. Retinal ganglion cells: a functional interpretation of dendritic morphology. Philos Trans R Soc Lond B Biol Sci 1982; 298: 227-263.
39. Drager UC, Olsen JF. Ganglion cell distribution in the retina of the mouse. Invest Ophthalmol Vis Sci 1981; 20: 285-293.