*Correspondence: V. P. Sousa. Departamento de Medicamentos, Faculdade de Farmácia, Universidade Federal do Rio de Janeiro, CCS, Bloco B subsolo, sala 15 - Ilha do Fundão - 21941-902 - Rio de Janeiro - RJ, Brasil. E-mail: [email protected]
A
rti
Pharmaceutical Sciences vol. 46, n. 4, out./dez., 2010
Development of methodologies for dimethylaminoethanol glycolate
assay in association with sunscreens in dermocosmetic formulation
Daniela Soares Deccache, Elisabete Pereira dos Santos, Lúcio Mendes Cabral,
Carlos Rangel Rodrigues, Valéria Pereira de Sousa
*Department of Pharmaceutics, College of Pharmacy, Federal University of Rio de Janeiro
DMAE glycolate (DG) and sunscreens have been used associated in anti-aging dermocosmetic formulations. Despite extensive use of these substances, methods for quantiication of DG as raw material and in cosmetic formulations, especially when associated, are not described in the literature. RP-HPLC and non-aqueous titration methods, with determination potentiometric end-point (PT), were developed and validated for rapid assay of DG as raw material and in a topic emulsion in association with sunscreens. Both methods are simple, selective, linear, accurate and precise. The PT method was chosen for stability study of DG in the formulation developed. The proposed formulation presented good stability performance as regards aspect, pH, apparent viscosity, and SPF, with less than 5% of DG degradation compared to initial conditions.
Uniterms: DMAE glycolate. Anti-aging dermocosmetic formulations/quantitative analysis. High Performance Liquid Chromatography-RP/quantitative analysis. Non-aqueous potentiometric titration/ quantitative analysis.
Glicolato de DMAE (DG) e protetores solares têm sido utilizados associados em formulações dermocosméticas antiidade. Apesar da ampla utilização dessas substâncias, métodos de quantiicação para DG matéria-prima e em formulações cosméticas, especialmente quando associados, não estão descritos na literatura. Neste trabalho foram desenvolvidas e validadas metodologias por CLAE-FR e titulação em meio não-aquoso, com determinação do ponto inal por potenciométrica (TP), para a rápida análise de DG matéria-prima e em emulsão tópica em associação com fotoprotetores. Ambos os métodos são simples, seletivos, lineares, exatos e precisos. O método TP foi escolhido para o estudo da estabilidade do DG na formulação desenvolvida. A formulação proposta apresentou um bom desempenho no que se refere a estabilidade, aspecto, pH, viscosidade aparente e SPF, com menos de 5% degradação do DG comparado as condições iniciais.
Unitermos: Glicolato de DMAE. Formulações dermocosméticas antiidade/análise quantitativa. Cromatograia líquida de alta eiciência-FR/análise quantitativa. Titulação potenciométrica em meio não-aquoso/análise quantitativa.
INTRODUCTION
Dimethylaminoethanol (DMAE)is an aminoalco-hol that presents caminoalco-holinergic functions (Figure 1). It is an analogue of choline (COL) and acetylcholine (ACH) and has been used since the 1970s as an oral medication to treat some central nervous system diseases related to
cholinergic neuronal hypo function, such as Alzheimer’s disease and tardive dyskinesia. The oral use of DMAE was discontinued due to inconsistent results in clinical trials (Haubrich, Gerber, Plueger, 1981; Soares, Mcgrath, 1999; Tammemaa, Sailas, Mcgrath, 2004).
skin that could be responsible for mediating a wide variety of cellular activities such as proliferation, differentiation and viability (Klapproth et al., 1997; Grando, 2001; Nguyen et al., 2003). More recent research has investigated the cellular basis of the anti wrinkle effect of DMAE. The DMAE action seems to be related to an increased frequency of vacuolar response, and consequently dilated cells, in DMAE-treated epidermis, probably leading to the improved appearance of wrinkled skin (Morissette, Germain, Marceau, 2007). However, the mechanism of action of the ACH and DMAE in the skin remains to be elucidated.
First analytical methods described simultaneous analysis of DMAE, ACH and COL in mice and rat plas-ma using gas chroplas-matography equipped with a rubidium nitrogen lame detector (Zahnizer et al., 1978).The de-termination of DMAE hydrochloride and COL chloride using cation-exchange HPLC and a conductivity detector was described for a radiomarked preparation (Mishani, Ben-David, Rozen, 2002). These methods are applied to pharmacokinetic studies but not to pharmaceutical quality control. A nuclear magnetic resonance spectroscopic me-thod has also been reported for quantitative determination of DMAE salts, such as maleic, bitartrate and acetamido-benzoate (Batista et al., 2008).
However, a literature survey revealed that there is no method reported for the analysis of DMAE glycolate (DG) in bulk and in pharmaceutical or cosmetic preparation. Nevertheless, many dermatologic preparations using DG have been developed and commercialized. The association of DG with many cosmetic ingredients is frequently pres-cribed. The association of DMAE with UVA-B sunscreens is especially indicated due to the increase in anti-aging and anti wrinkle effects, facilitating treatment adhesion.
Although it is a frequently prescribed association, there are no reports on its stability and eficiency, mainly due to the absence of analytical methods for DMAE. The absence of available methods for DMAE quantiication is principally due to the low molar absorptivity in the UV region, and to lack of chromophore that absorb in the visible region. This renders titration a very appropriate alternative method.
The purpose of the present study was to develop and validate a simple RP-HPLC method with UV detection and a rapid and low cost non-aqueous titrimetric method with potentiometric detection of the equivalence-point for quantitative analysis of DG associated with sunscreens in a cosmetic preparation. The compatibility and stability of the proposed emulsion containing DMAE in association with sunscreens was assessed by changes in the visual as-pect, centrifugation, pH, apparent viscosity, sun protective factor (SPF) and DG assay. The stability study was carried out over a 3-month period at room temperature (25 °C ±
2 °C) and accelerated conditions (40 °C ± 2 °C), under
saturated humidity.
MATERIAL AND METHODS
Chemicals and reagents
DMAE glycolate was kindly supplied by Embra-farma and DEG (São Paulo, Brazil). The purity of the working standard (Embrafarma) was conirmed by pH, UV spectroscopy and titration. The octyl methoxycin-namate (MTO) and octocrylene (OCT) sunscreens were obtained from Spectrum Química (Rio de Janeiro, Brazil), and benzophenone-3 (BZF-3) sunscreen from Deg (São Paulo, Brazil).
Acetonitrile were HPLC grade and was obtained from Tedia Brazil (Rio de Janeiro, Brazil). Glacial ace-tic acid, perchloric acid, aceace-tic anhydride, monobasic potassium phosphate, BHT, and sodium hydroxide were supplied from Vetec (Rio de Janeiro, Brazil). All chemicals and reagents were of analytical grade. Distilled water, puriied by a Millipore Milli-Q system, was used for the preparation of all solutions.
Formulation
The formulation (Table I) was prepared by disper-sing, with constant stirring, Structure XL® in puriied water
at 70 °C containing Phenochem®. The sunscreens (octyl
methocynnamate, benzophenone-3 and octocrylene) and BHT were homogenized together and subsequently mixed with emulgin VL 75®. This oily phase was added to the
aqueous phase by emulsiication in a Fisatom 713 D shaker
(São Paulo, Brazil) at approximately 800 rpm followed by a high dispersion with an Ultra Turrax T18 basic shaker (Guangzhou, China) at 6000 rpm. DG was added to the emulsiied formulation at 40 °C. Placebo formulation was prepared using all excipients without DG.
HPLC Instrumentation and analytical conditions
Liquid chromatography analyses were performed using a Shimadzu system (Kyoto, Japan) consisting of a binary pump model LC-10AD, auto sampler model SIL-10 AD, set to SIL-10 µL of injected sample volume, equipped
with a diode array detector model SPD-M10A, set at 205 nm. Data acquisition was performed by the Class-VP version 6.1 software. The analyses were carried out on a Shimpack® CLC-ODS C
18 column (250 x 4.6 mm i.d.,
5 µm particle size; Shimadzu) using isocratic elution at
room temperature (25 ± 2 °C). Different mobile
pha-ses were tested in order to set the best conditions for separating DG from the other emulsion constituents. The optimal composition of the mobile phase was acetonitrile:phosphate buffer (pH 7.4; 0.05 M) (5:95, v/v) used at a low rate of 1.0 mL/min. The mobile phase was freshly prepared and iltered through a 0.45 µm membrane
ilter Millipore (Massachusetts. USA).
The DG amount in the formulation was extracted by dissolving the emulsion in acetonitrile:potassium phospha-te (pH 7.4; 0.05 M) (1:1, v/v) solution under sonication for 5 min. The obtained sample was diluted, iltered and assayed.
Working solution
Stock standard solutions of 20 mg/mL were freshly prepared by accurately weighing out approximately 1.5 g of DG (about 70.1% purity) into a 50 mL volumetric lask and adding the extraction solution acetonitrile:phosphate buffer to volume (pH 7.4; 0.05 M) (1:1, v/v). These stan-dard solutions were further diluted to obtain ive working standards at the concentration of 400, 600, 800, 1000 and 1200 µg/mL of DG, covering 80-120% of the working
concentration used to quantify the DG in the proposed formulation. All solutions were prepared in triplicates.
Assay sample preparation
For recovery and precision studies, the matrix place-bo of the emulsion was spiked with DG. It was accurately weighed into a 25 mL volumetric lask in order to obtain quantities of about 80, 100 and 120% of the assay level, corresponding to 4, 5 and 6% DG. The samples were extracted by addition of 15 mL of the extractor solution acetonitrile:phosphate buffer (pH 7.4; 0.05 M) (1:1, v/v), sonicated for 5 min and brought to volume with the same solvent. An aliquot of 5.0 mL of each solution was transferred to a 25 mL volumetric lask. These solutions were further diluted with extractor solution to obtain the working samples in triplicate at the concentrations of 600, 800 and 1000 µg/mL, respectively. Prior to injection, all
the samples were passed through a 0.45 µm membrane
ilter. Identiication of peaks in the formulation sample was based on the comparison of retention times of DG in standard solution. Peak identity was conirmed by UV-Vis spectra. The area data was normalized to the sample weight. Data were determined from an average of at least 2 determinations of 3 samples.
PT Instrumentation and analytical conditions
The DG purity and DG assay in formulation asso-ciated with sunscreens in an emulsion preparation were determined using the neutralization titration method in non-aqueous solvent. The point of equivalence was po-tentiometrically determined. The analyses were carried out on an automatic titrator Mettler Toledo DL25 system (New York, USA) equipped with CV4 Mettler Toledo combined glass electrode (KCl 3 M/ LiCl 3 M in acetic acid), operated at room temperature (25 ± 2 °C). Samples
of the formulation studied were mixed (2 min) in the titration vessel using glacial acetic acid:acetic anhydride (50:1, v/v), as non-aqueous solvents. Standardization of the titrant perchloric acid (0.1 N) was performed in
tripli-TABLE I - Components of the formulation studied
Components Concentration (w/w, %)
DMAE glycolate 5.0
Octyl methoxycinnamate 2
Benzophenone-3 2
Octocrylene 2
Phenochem®a 0.5
Eumulgin VL 75®b 3
Structure XL®c 5
BHT 0.05
Fragrance 0.2
Water q.s. to 100
INCI designation: aDispersion of phenoxyethanol,
methylparaben, ethylparaben, butylparaben, propylparaben and isobutylparaben, blauryl glucoside, polyglyceryl-2
dipolyhydroxystearate, and glycerin, cPolymeric non-ionic
cate immediately before each analysis using the primary standard potassium biftalate. The analysis factor was 16.4 mg of DG per 1 mL of HClO4 0.1 N.
Assay sample preparation
The recovery and precision of the methods were as-sessed by analyzing samples of the matrix placebo spiked with DG. It was accurately weighed in triplicate directly into the titration vessel using glacial acetic acid:acetic anhydride (50:1, v/v) as the solvent and mixed about 2 min prior to potentiometric titration. Samples were prepared in order to obtain quantities about 80, 100 and 120% of the assay level, corresponding to 4, 5 and 6% DG, and theoretical mass of 80, 100 and 120 mg DG, respectively.
Validation procedure
The methods were validated in accordance with Brazilian guidelines and the International Conference on Harmonization guidelines for validation of analytical procedures (Brasil, 2003; ICH, 2005).
Specificity
HPLC speciicity was assessed by comparing the samples’ chromatograms with those obtained from placebo corresponding to 1000 µg/mL DG. For the PT method,
the speciicity was assessed by comparing the volume of titrant consumed in placebo and in solvent titration, with those obtained from sample titration, considering the for-mulation theoretical level of 100% DG.
Linearity
The calibration curves were constructed with ive concentrations over the range of 400-1200 µg/mL, for the
HPLC method, and with six concentrations over the range of 40-140 mg DG for the PT method, both prepared in triplicates, in three days. For the HPLC method, the peak area ratio of DG was plotted versus the corresponding concentration (µg/mL) to obtain the calibration graph. For the PT method, the ratio of titrant volume (mL) versus corresponding DG concentration (mg) was used. Linea-rity was evaluated using linear regression analysis by the least square regression method. The standard curves were evaluated for inter-day linearity.
The degree of linearity was assessed considering the correlation coeficient, intercept, slope, and the standard error for the slope and the intercept.
Precision and accuracy
The precision and accuracy of the methods were
determined by analyzing samples of matrix placebo spiked with DG, prepared in triplicates, at three concentration levels: 80, 100 and 120% of the working concentration. Formulations containing 4, 5 and 6% of DG were prepared. Samples of these formulations were prepared correspon-ding to DG theoretical mass of 80, 100 and 120 mg for PT method, and using concentrations of 600, 800 and 1000 µg/mL, for the HPLC method.
Precision was determined by repeatability and re-ported as % R.S.D. of replicate measurements. Accuracy was determined by the analyses of a sample of known concentration of DG standard and subsequent comparison of the measured value with the true value. The peak area and the volume of titrant for HPLC and PT methods, res-pectively, were normalized to the DG sample weight. For the PT method, the volume of titrant was deducted from the blank value.
The injection precision assessment was performed by six replicate injections of the sample solution at the three different levels (80%, 100% and 120%) in order to verify area ratios and the retention time of DG.
Limit of detection (LOD) and limit of quantitation (LOQ)
The parameters LOD and LOQ were determined on the basis of response and slope of the regression equation from three calibration curves obtained at different days for both methods. LOD was calculated as three times the standard deviation of the intercept of the calibration cur-ves, and LOQ as ten times.
Stability study
The formulation containing 5% DG (Table I) was prepared and bottled in propylene flasks with 120 g capacity. The formulation samples were stored at room temperature (25 °C ± 2 °C) and 40 °C ± 2 °C, under
sa-turated humidity, for long and accelerated-term stability, respectively. The samples were kept under controlled temperature and humidity conditions for a period of 3 months and the tests were carried out on the irst day and at 15-day intervals.
The stability study of the formulation was performed by evaluation of visual aspects, centrifugation, apparent viscosity, pH, SPF and DG assay. The centrifugation sta-bility was performed using a Beckman Coulter Avanti J 25 centrifuge (Fullerton, USA), at 6000 rpm for 15 min, at 25 °C. The apparent viscosity measurements were carried out under ambient temperature and humidity (25 °C ± 2 °C
and 50 ± 5% RH) using an analogical Brookield model
The measurements of pH were assessed using a Digimed DM 21 pHmeter, electrode CV1 (São Paulo, Brazil) ca-librated immediately before each measure. The assay of DG in the formulation was performed in triplicate by the described PT method. The volume consumed in the blank was deducted from the total volume of analysis.
The assessment of SPF in vitro of the formulation was carried out using the spectrophotometric method (Mansur et al., 1986). The absorbances of a formulation sample were measured in triplicate over the UVB range (290, 295, 300, 305, 310, 315 and 320 nm) using a Shi-madzu UV 2401 PC spectrophotometer (Kyoto, Japan). Solutions of all samples were prepared to obtain a con-centration of 0.2 mg/mL. A 0.5 g amount was weighed in a 100 mL volumetric lask, diluted with 30 mL ethanol and sonicated for 5 min. The volume was completed using ethanol. A 1 mL aliquot was transferred to a 25 mL volu-metric lask, and after homogenization this volume was completed with ethanol. The measures were performed in triplicate on the spectrophotometer using ethanol as the reference liquid. The SPF was calculated according to Mansur et al. (1986) using the equation:
SPFspectrophtometric = CF x S322900 EE (λ) x I (λ) x Abs (λ)
Where: CF= correction factor (=10); EE= erythe-mal effect spectrum; I= solar intensity spectrum; Abs= absorbance of sunscreen product. The values of EE x I are constants determined by Sayre et al. (1979).
RESULTS AND DISCUSSION
Validation of HPLC method
An RP-HPLC method was developed in order to quantify DG in cosmetic formulations. The RP-HPLC is a chromatographic method that uses a non-polar stationary phase, in this case an octadecyl chain linked to a silica
surface. Thus, the retention of the analyte depends on the adequate balance of polarity between mobile phase and stationary phase. We therefore worked with mixtures of aqueous buffer and organic solvent to elute the analyte from the column at adequate times. Due to the low molar absorptivity of DMAE in the UV region (205 nm) a higher than normal working concentration was used (0.8 mg/ mL). The chromatographic conditions were optimized to provide an assay with adequate performance. The effect of the mobile phase composition and the sample extractor solution on the system suitability studies was investigated. The parameters evaluated were retention time (Rt), tailing factor (T), and column efficiency(N). Mobile phases consisting of phosphate buffer (0.05 M, pH 7.4) and ace-tonitrile mixtures at various ratios (95:5, 98:2, 99:1, 100%) were tested. The variation of composition of the mobile phase caused considerable changes in the tailing factor as shown in Table II.
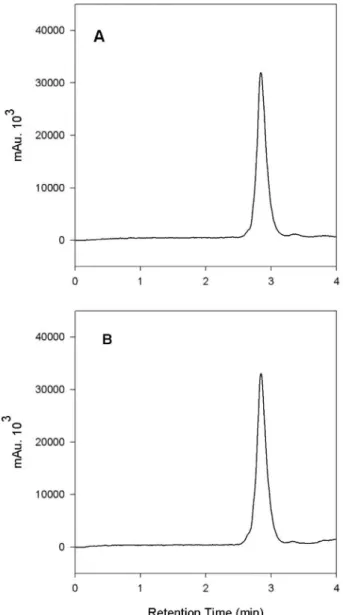
The mobile phase selected was a mixture of acetonitrile:phosphate buffer (pH 7.4; 0.05 M) (5:95, v/v) and the extractor solution was acetonitrile:phosphate buffer (pH 7.4; 0.05 M) (1:1, v/v). These conditions were found to be suitable, increasing the peak symmetry with a short retention time and no interference. Figure 2 shows re-presentative chromatograms of working standard DG and the formulation sample at a concentration of 1000 µg/mL.
In order to study the effect of formulation ingre-dients on quantiication of DG, a placebo was prepared. The results revealed no interference of the excipients, which was conirmed through recovery studies.
Five-point calibration curves were constructed on three different days with working standard, and were found to be linear over the range 400-1200 µg/mL. The
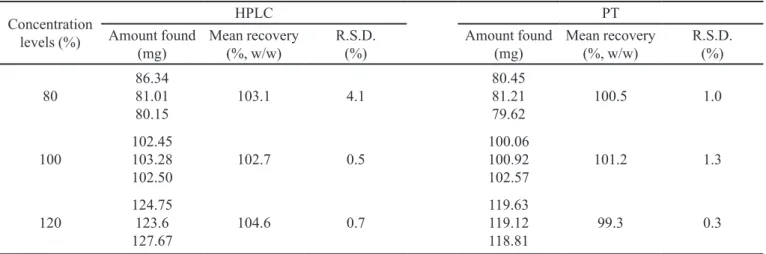
parameters of calibration curves are presented in Table III. The accuracy results were expressed in terms of percentage recoveries of DG spiked in the matrix placebo samples. The results are summarized in Table IV. The percent DG recoveries in placebo samples were within
TABLE II -System suitability
Parameter Mobile phase (v/v)a Liquid extractor (v/v)b
95:5 98:2 99:1 100% ACN (1:1) Hexane (2:1)
Rt 2.76 2.79 2.87 2.85 2.88 2.64
T 2.1 2.2 2.1 1.06 1.2 0.69
N 2868 2531 1486 2402 1926 1472
The parameters monitored were peak retention time (Rt), tailing factor (T), and theoretical plates (N).
a The experiment was performed using mobile phase consisting of phosphate buffer (0.05 M) varying the ACN ratio. The experiment
was carried out using phosphate buffer (pH 7.4, 0.05 M) as mobile phase. b Tests varying the composition of liquid extractor ACN
(LOD) and quantitation (LOQ) calculated were 25.1 and 83.8 μg/mL, respectively.
The precision of injection was evaluated by analyzing six replicate injections of three samples with 80, 100 and 120% concentration levels. The results showed a R.S.D. of 1.88, 0.80 and 0.28%, respectively. These results indicated good precision of injection. The results obtained from the repeatability study are listed in Table IV.
Validation of PT method
The PT method proposed in this paper for analysis of DMAE glycolate in dermocosmetic formulation also applies to raw material. The potentiometric titration makes the detection of the equivalence point more accurate. In this case the irst derivative of the titration curve was used to obtain the equivalence point. The analysis was perfor-med in glacial acetic acid - an amphiprotic solvent that exerts a leveling effect and enhances the basic properties of the DMAE - and acetic anhydride to react with the water. The organic solvents also promote the complete solubili-zation of the formulation that contains oily components and favors the extraction of DMAE.
The selectivity of PT titration was determined by placebo and solvent analysis, comparing volumes of titrant used in the sample titration at a 100% concentration level (Table V). The results showed that the volume of titrant used in the neutralization of placebo (~3%) and solvent (~0.2%) was low compared to sample analyses, but was deducted from the inal value.
A six-point calibration curve was constructed co-vering a range of 40-140 mg of DG. Three independent determinations were performed for each concentration. The linear relationship between the ratio of the titrant vo-lume (mL) and DG concentration (mg) was observed, as shown by the results presented in Table III. The correlation coeficient exceeded 0.999.
The repeatability study indicated an R.S.D. of 0.98%. 1.26 % and 0.34% for the 80, 100 and 120%
con-FIGURE 2 - Representative chromatogram of: (A): DG working standard (1000 µg/mL) and (B): formulation sample (1000 µg/mL).
TABLE III - Calibration curves of the methods
Parameters HPLC PT
Linear range 0.40-1.2 µg/mL 40-140 mg
Regression equationa y = 355.2 x – 12032.8 y = 0.0595 x + 0.0199
Standard error of slope 5.0 0.0115
Standard error of intercept 2974.4 5.8 x 10⁻⁵
Correlation coeficient (r2) 0.9990 0.9999
ay = bx + a, where x is the concentration in µg/ ml, y is the peak area for HPLC method, and x is the amount added of DG (mg)
and y is the titrant volume for PT method, a is the intercept and b is the slope (n= 3); SE = sd/√n.
centration levels, respectively (Table IV). The data for accuracy were expressed in terms of percentage recoveries of DG in placebo-spiked samples. These results are sum-marized in Table IV. The mean recovery data of DG were within the 99.3 to 101.2 % range, in accordance with the acceptance criteria of the parameter evaluated. The limits of detection (LOD) and quantitation (LOQ) calculated were 2.9 and 9.7 mg, respectively.
Stability study
The stability of the proposed formulation containing
DG and sunscreens in association was veriied after stora-ge of the samples at room temperature (25 °C ± 3 °C) and
under accelerated conditions (40 °C ± 2 °C) of saturated
humidity. The stability was evaluated considering the changes observed in the visual aspect, centrifugation, pH, apparent viscosity, SPF and DG assay. The PT method was chosen to verify the DG assay in the samples due to its eficacy and simplicity.
Apparent viscosity values were within the range 21.5 – 23.0 x 10³ cps, for the samples stored under ambient
conditions, and 21.0 – 22.0 x 10³ cps, for the samples
stored under accelerated conditions. Statistical analysis entailed application of the t test to compare apparent viscosity values (Table VI). Results showed no statistical differences (p= 0.0831) between time and conditions of storage. The samples were stable after centrifugation, presenting no phase separation (600 rpm, 15 min; 25 °C). However, a slightly yellowish powder was observed after centrifugation on the 90th day. The formulation was a
ho-mogeneous and consistent emulsion, white in colour, that met acceptance criteria related to appearance and physical attributes during storage under both conditions.
TABLE IV - Results of precision and accuracy by HPLC and PT methods (n=3)
Concentration levels (%)
HPLC PT
Amount found
(mg) Mean recovery (%, w/w) R.S.D. (%) Amount found (mg) Mean recovery (%, w/w) R.S.D. (%)
80 86.3481.01
80.15 103.1 4.1
80.45 81.21
79.62 100.5 1.0
100 102.45103.28
102.50 102.7 0.5
100.06 100.92
102.57 101.2 1.3
120 124.75123.6
127.67 104.6 0.7
119.63 119.12
118.81 99.3 0.3
TABLE V - Results obtained for selectivity of PT method
Sample Volume
(ml) ± R.S.D. (%)
Equivalent of DG (mg)
Placebo 0.1844 ± 0.49% 3.05
Solvent 0.0116 ± 0.50% 0.190
Sample (5% DG) 6.05 ± 1.3% 100.1
N=3; mean ± R.S.D. %.
TABLE VI - Results of stability studies for DG assay and pH veriied in stored (A) room samples and (B) accelerated conditions using PT method
Time (days) DG found (%) (w/w)a ± R.S.D. Viscosity (cps)b pHb
A B A B A B
0 15 30 60 90
5.4 ± (6 x 10⁻⁴%)
5.4 ± (5 x 10⁻⁴%)
5.5 ± (4 x 10⁻⁴%)
5.4 ± (5 x 10⁻⁴%)
5.4 ± (2 x 10⁻⁴%)
5.4 ± (6 x 10⁻⁴%)
5.4 ± (0.00%)
5.5 ± (1 x 10⁻³%)
5.4 ± (6 x 10⁻⁴%)
5.46 ± (1 x 10⁻³%)
22000 23000 21500 22000 23000
22000 22000 21500 21500 21000
4.5 4.4 4.4 4.3 4.3
4.5 4.3 4.4 4.3 4.3
aMeanof three determinations, bP> 0.05. (A) Formulations stored at room temperature; (B) Formulations stored at 40 °C ± 2 °C
The experimental values of pH are summarized in Table VI, showing no signiicant changes during storage time under both conditions compared to controls (initial time) (p> 0.05). It is important for a dermocosmetic to present a stable pH indicating chemical stability and safety for dermatological use.
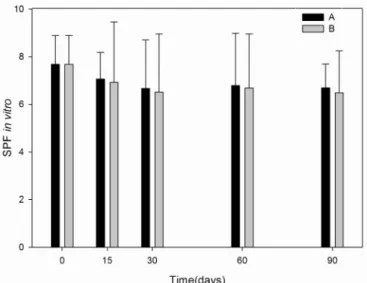
The SPF in vitro assay (Figure 3) demonstrated a loss of 12.8% for the sample stored at room tempera-ture (p< 0.001) and 15.5% under accelerated condition (p < 0.001). According to Santos and cols, the analysis of sunscreen formulations containing SPF 8 corresponds to 87.5% of absorbed UVB radiation, and there is no signi-icant difference regarding percentage of absorbed UVB between formulations in the 6-8 SPF range (Mansur et al., 1986; Santos et al., 1998). Statistical analysis (t test) demonstrated no signiicant differences comparing the results obtained at different storage conditions over the study period (p> 0.05).
The DG assay (Table VI) showed less than 5% decay from its initial value under both storage conditions, satis-fying the ICH acceptance criteria (ICH, 2003, 2004). This data was conirmed by the evidence of no loss of content of DG in the formulation studied using HPLC methodology comparing the irst day and 90th day at room temperature.
The stability of DG raw material was also studied and no loss was observed during the same period. These results demonstrated that DG possesses compatibility and sta-bility when associated with sunscreens in the developed formulation. This association is useful to improve anti-aging effects in dermocosmetic formulations.
CONCLUSION
The proposed methods are a simple and rapid alter-native for quantifying DG in raw material and in formu-lations. These methods are linear, speciic, accurate and precise. Both methodologies demonstrated satisfactory performance considering the simple working conditions established. The chromatographic run time of 2.7 min allows the analysis of a large number of samples in a short period of time. The titrimetric method is a very simple and low cost method of analyzing DG raw material and dermocosmetic formulations. The proposed formulation, associating DG with sunscreens, demonstrated good sta-bility performance for the analyzed parameters.
REFERENCES
BATISTA, I.A.; GONÇALVES, M.I.; SINGH, A.K.; HACKMANN, E.R.M.K.; SANTORO, M.I.R.M. Quantitative determination of dimethylaminoethanol in cosmetic formulations by nuclear magnetic resonance spectroscopy. J. AOAC Int., v.91, n.6, p.1303-1308, 2008.
BRASIL. Agência Nacional de Vigilância Sanitária. RE n° 899, Guia de validação de métodos analíticos e bioanalíticos. Brasília, 29 de Maio de 2003, p.1-16.
COLE, C.A; GISOLDI, E.M.; GROSSMAN, R.M. Clinical and consumer evaluations of improved facial appearance after 1 month use of topical dimethylaminoethanol. In: ANNUAL
MEETING AMERICAN ACADEMY DERMATOLOGY,
60, New Orleans, 2002. Anais. New Orleans: AAD, 2002. p.1-4.
GRANDO, S.A. Receptor-mediated action of nicotine in human skin. Int. J. Dermatol., v.40, n.11, p.691-693, 2001.
GROSSMAN, R. The Role of dimethylaminoethanol in cosmetic dermatology. Am. J. Clin. Dermatol., v.6, n.1, p.39-47, 2005.
HAUBRICH, D.R.; GERBER, N.H.; PFLUEGER, A.B.Deanol affects choline metabolism in peripheral tissues of mice. J. Neurochem., v.37, n.2, p.476-482, 1981.
INTERNATIONAL CONFERENCE ON HARMONIZATION. ICH. Evaluation of Stability Data Q1E.US FDA Federal Register, v.69, n.110, June 8, 2004. p 32010-32011. FIGURE 3 - Values of SPF in vitro measured during the stability
INTERNATIONAL CONFERENCE ON HARMONIZATION. ICH. Stability Testing of new Drug Substances and Products Q1A (R2). US FDA Federal Register, v.68, n.225, November 21, 2003, p.65717-65718.
INTERNATIONAL CONFERENCE ON HARMONIZATION. ICH. Validation of analytical procedures: text and methodology Q2(R1), Geneva, Switzerland, November, 2005, p.1-13.
KLAPPROTH, H.; REINHEIMER, T.; METZEN, J.; MÜNCH, M.; BITTINGER, F.; KIRKPATRICK, C.J.; HÖHLE, K.D.; SCHEMANN, M.; RACKÉ, K.; WESSLER, I. Non-neuronal acetylcholine, a signaling molecule synthesized by surface cells of rat and man. Naunyn-Schmiedeberg’s Arch. Pharmacol., v.355, p.515-523, 1997.
MANSUR, J.S.; BREDER, M.N.R.; MANSUR, M.C.D.; AZULAY, R.D. Determinação do fator de proteção solar por espectrofotometria. An. Bras. Dermatol., v.61, n.3, p.121-124, 1986.
MISHANI, E.; BEN-DAVID, I.; ROZEN, Y. Improved method for the quality assurance of [C-11] choline. Nucl. Med. Biol., v.29, n.3, p.359-362, 2002.
MORISSETTE, G.; GERMAIN, L.; MARCEAU, F.
The antiwrinkle effect of topical concentrated 2-dimethylaminoethanol involves a vacuolar cytopathology.
Br. J. Dermatol., v.156, n.3, p.433-439, 2007.
NGUYEN, V.T.; ARREDONDO, J.; CHERNYAVSKY A.I.; KITAJIMA, Y.; GRANDO, S.A.Keratinocyte acetylcholine receptors regulate cell adhesion. Life Sci., v.72, n.18, p.2081-2085, 2003.
SANTOS, I.B.; SANT´ANNA D.; CARVALHO, J.; MENDONCA, M.; DOS REIS, V.M.; RODRIGUES DE FRANCA, E. Filtros solares:normas de utilização.
Anais Bras. Dermatol., v.73, n.2, p.5-9, 1998. (Congresso Brasileiro De Dermatologia, 52, Brasília, 1997).
SAYRE, R.M.; AGIN, P.P.; LEVEE, G.J.; MARLOWE, E. Comparison of in vivo and in vitro testing of sunscreening formulas. Photochem. Photobiol., v.29, n.3, p.559-566, 1979.
SOARES, K.V.S.; MCGRATH, J.J. The treatment of tardive dyskinesia: a systematic review and meta-analysis.
Schizophr. Res., v.39, n.1, p.17-18, 1999.
TAMMENMAA, I.A.; SAILAS, E.; MCGRATH, J.J.; SOARES-WEISER, K.; WAHLBECK, K. Systematic review of cholinergic drugs for neuroleptic-induced tardive dyskinesia: A meta-analysis of randomized controlled trials.
Prog. Neuro-Psychopharmacol. Biol. Psychiatry, v.28, n.7, p.1099-1107, 2004.
UHODA I.; FASKA, N.; ROBERT, C.; CAUWENBERGH, G.; PIÉRARD, G.E. Split face study on the cutaneous tensile effect of 2-dimethylaminoethanol (deanol) gel. Skin Res. Technol., v.3, n.3, p.164-167, 2002.
ZAHNISER, N.R.; KATYAL, S.L.; SHIN, T.M.; HANIN, I.; MOOSSY, J.; MARTINEZ, A.J.; LOMBARDI, B. Effects of N-methylaminoethanol and N, N-dimethylaminoethanol in the diet of pregnant rats on neonatal rat brain cholinergic and phospholipid proile. J. Neurochem., v.30, n.6, p.1245-1252, 1978.
Received for publication on 27th July 2009.