www.atmos-chem-phys.net/8/2741/2008/ © Author(s) 2008. This work is distributed under the Creative Commons Attribution 3.0 License.
Chemistry
and Physics
Cloud system resolving model study of the roles of deep convection
for photo-chemistry in the TOGA COARE/CEPEX region
M. Salzmann1, M. G. Lawrence1, V. T. J. Phillips2, and L. J. Donner3
1Max-Planck-Institute for Chemistry, Department of Atmospheric Chemistry, PO Box 3060, 55020 Mainz, Germany 2Department of Meteorology, University of Hawaii at Manoa, 2525 Correa Road, Honolulu, HI 96822, USA 3Geophysical Fluid Dynamics Laboratory, NOAA, Princeton University, PO Box 308, Princeton, NJ 08542, USA Received: 30 October 2007 – Published in Atmos. Chem. Phys. Discuss.: 10 January 2008
Revised: 7 May 2008 – Accepted: 7 May 2008 – Published: 22 May 2008
Abstract.A cloud system resolving model including photo-chemistry (CSRMC) has been developed based on a proto-type version of the Weather Research and Forecasting (WRF) model and is used to study influences of deep convection on chemistry in the TOGA COARE/CEPEX region. Lat-eral boundary conditions for trace gases are prescribed from global chemistry-transport simulations, and the vertical ad-vection of trace gases by large scale dynamics, which is not reproduced in a limited area cloud system resolving model, is taken into account. The influences of deep convective trans-port and of lightning on NOx, O3, and HOx(=HO2+OH), in the vicinity of the deep convective systems are investi-gated in a 7-day 3-D 248×248 km2horizontal domain sim-ulation and several 2-D sensitivity runs with a 500 km hor-izontal domain. Mid-tropospheric entrainment is more im-portant on average for the upward transport of O3in the 3-D run than in the 2-D runs, but at the same time undiluted O3 -poor air from the marine boundary layer reaches the upper troposphere more frequently in the 3-D run than in the 2-D runs, indicating the presence of undiluted convective cores. In all runs, in situ lightning is found to have only minor im-pacts on the local O3budget. Near zero O3volume mixing ratios due to the reaction with lightning-produced NO are only simulated in a 2-D sensitivity run with an extremely high number of NO molecules per flash, which is outside the range of current estimates. The fraction of NOx chemi-cally lost within the domain varies between 20 and 24% in the 2-D runs, but is negligible in the 3-D run, in agreement with a lower average NOxconcentration in the 3-D run de-spite a greater number of flashes. Stratosphere to troposphere
Correspondence to:M. Salzmann ([email protected])
transport of O3is simulated to occur episodically in thin fil-aments in the 2-D runs, but on average net upward transport of O3 from below∼16 km is simulated in association with mean large scale ascent in the region. Ozone profiles in the TOGA COARE/CEPEX region are suggested to be strongly influenced by the intra-seasonal (Madden-Julian) oscillation.
1 Introduction
mixing ratios are common in parts of the marine tropical tro-posphere and have been suggested to originate either from deep convection over continents lifting polluted air or from the stratosphere (Newell et al., 1996). In global chemistry-transport models, deep convective chemistry-transport, which is typi-cally parameterized using simplistic mass flux approaches, constitutes a major source of uncertainty (Mahowald et al., 1995; Lawrence and Rasch, 2005).
Wang and Prinn (2000) studied a CEPEX storm (CEPEX: Central Equatorial Pacific Experiment; Ramanathan et al., 1993) using 2-D and 3-D cloud resolving model simulations including chemistry and found that downward transport of O3-rich air in association with deep convection, which took place in thin filaments in their simulations, lead to increases in upper tropospheric O3mixing ratios in spite of the upward transport of O3-poor air. They suggested O3loss due the re-action with lightning-produced NO in cloud anvil regions can help explain the occasionally observed layers with extremely low concentrations of O3in the upper troposphere. Further-more, they found that a considerable fraction of lightning NOxwas photochemically converted to HNO3in the vicinity of the storms. This fraction decreased with increasing NO production from 28% in a 2-D sensitivity run with a fairly large NO production to 12% in a 2-D run with an extremely large NO production. At very high simulated NOx concen-trations they found NOxloss to be HOxlimited. Although lightning is much less frequent over oceans than over land (e.g. Christian et al., 2003), lightning NO constitutes one of the most important sources of NOx over the remote tropi-cal oceans next to ship emissions and the thermal decom-position of peracetyl nitrate (PAN), which is advected over long distances at high altitudes and subsequently transported downwards. Large photochemical losses of lightning NOx in the vicinity of the storms would therefore be important in spite of the large uncertainty still related to the amount of NO produced per flash. Globally, lightning has been shown to have an important impact on OH and the lifetime of methane (Labrador et al., 2004; Wild, 2007).
In this study we use a so-called cloud system resolving model setup including chemistry (CSRMC) in order to study the impact of multiple storms and mesoscale convective sys-tems over a period of several days. Horizontal advection in and out of the domain is taken into account by specify-ing lateral boundary conditions for trace gases. Furthermore, the mean ascent in the domain (associated with the Hadley and Walker cell and the intra-seasonal oscillation), which is not reproduced by limited area cloud system resolving mod-els, is taken into account as in Salzmann et al. (2004) based on mean vertical velocities derived from observations over the tropical West Pacific east of Papua New Guinea during TOGA COARE (Webster and Lukas, 1992; Ciesielski et al., 2003). Taking into account the mean ascent largely com-pensates the mass balancing mesoscale subsidence between clouds which would otherwise erroneously be forced to take
lead to a significant overestimate of the thermal decomposi-tion of PAN. We focus on the following issues:
1. The influence of NO production by lightning on NOx, O3, and HOx, and the sensitivity of the model results to the dimensionality (2-D or 3-D) of the model.
2. Deep convective ozone transport (especially with regard to implications for its treatment in global chemistry-transport models), and, closely related to this, the role of regional scale ozone transport and locally produced lightning NOxin explaining ozone profiles in the TOGA COARE/CEPEX region.
We also discuss the ozone results in the light of very low upper tropospheric ozone concentrations observed during CEPEX (Kley et al., 1996, 1997). Unfortunately, chemistry and flash rate observations are not available for the episode (19–26 December 1992) simulated in this model sensitivity study. In order to constrain the simulated flash rates and for the discussion of our chemistry results, we instead rely on observations from nearby regions and/or at other times.
The CSRMC is described in the next section. In Sects. 3–5 results for NOx, O3, and HOxare presented. The influ-ence of the intra-seasonal (Madden Julian) oscillation (ISO) on ozone profiles is discussed in Sect. 6 based on output from the global Model of Atmospheric Transport and Chemistry -Max Planck Institute for Chemistry version (MATCH-MPIC, Lawrence et al., 1999b; von Kuhlmann et al., 2003, and refer-ences therein). The CSRMC simulated meteorology (similar to Salzmann et al., 2004) and details of the CSRMC such as the algorithms used for identifying updrafts and anvils in the lightning parameterization are described in the elec-tronic supplement http://www.atmos-chem-phys.net/8/2741/ 2008/acp-8-2741-2008-supplement.pdf. Additional material providing a rather comprehensive view of the details of our simulations and a brief description of MATCH-MPIC is also found in the supplement.
2 Model description and setup
the mechanism from MATCH-MPIC (von Kuhlmann et al., 2003) is used in the present study (Sect. S1.3). Photoly-sis rates are computed using the computationally efficient scheme by Landgraf and Crutzen (1998). A simple pa-rameterization of the production of nitrogen oxide by light-ning (see below) and a scheme for dry deposition over wa-ter (based on Ganzeveld and Lelieveld, 1995, and references therein) have been implemented in the CSRMC. For soluble trace gases the uptake into or onto, release from, transport to-gether with, and mass transfer between different model cate-gories of hydrometeors (cloud droplets, rain, small ice parti-cles, graupel, and snow) are calculated as in Salzmann et al. (2007), see also Sect. S1.5. For HNO3 and H2O2 ice up-take from the gas phase is up-taken into account (Sect. S1.6). Aqueous phase reactions are currently not explicitly included in the CSRMC, except for the hydrolysis reaction of N2O5. Dissociation reactions are, however, to some extent implic-itly included via the use of “effective” Henry’s law coeffi-cients in the mass transfer equations (Sect. S1.5). The rate of change of the gas phase concentration of thei-th trace gas is: ∂tCi,g= − ∇ · vCi,g+∂tCi,g|vlsat+∂tCi,g|lno
+∂tCi,g|turb+∂tCi,g|solu+∂tCi,g|drydep
+∂tCi,g|chem (1)
where ∂t is the partial derivative with respect to time, v=(u, v, w)is the three dimensional wind vector,∂tCi,g|vlsat is the rate of change due to the vertical advection by the large scale vertical motion which is not reproduced by the CSRMC (Salzmann et al., 2004, see also Sect. S1.2),∂tCi,g|lnois the rate of NO production by lightning, ∂tCi,g|turb is the rate of change due to turbulent mixing by sub-grid scale eddies (parameterized applying Smagorinsky’s closure scheme, e.g. Takemi and Rotunno, 2003), ∂tCi,g|solu is the uptake or release rate of soluble gases by or from hydrometeors in the liquid or ice phase (Sect. S1.6), ∂tCi,g|drydep is the dry deposition rate, and ∂tCi,g|chem is the rate of change due to gas phase chemical reactions. The advection of trace gases, of water vapor, and of hydrometeors in the liquid and ice phase is calculated using the monotonic algorithm by Walcek (2000).
Lateral boundary conditions for trace gases are derived from 3-hourly MATCH-MPIC output (see Sect. S2 and Sect. S8). In the 3-D run (LTN3D), the horizontal domain size is 248×248 km2 and the horizontal resolution is 2 km. The vertical resolution is 500 m in the troposphere with in-creasing grid spacings above 19 km and a total of 46 levels up to 24707 m. A timestep of 8 s is used. In the 2-D runs (NOLTN, LTN1, LTN2, LTNWP, and LTNHWP), the hor-izontal domain extension is 500 km and the domain is ori-ented in East-West direction. The horizontal resolution is again 2 km and the vertical resolution is 350 m in the tropo-sphere with a timestep of 5 s. The meteorological setup in the 2-D runs is identical to Salzmann et al. (2004), while the
timestep and the vertical grid spacing were increased for the 3-D run. An overview of the meteorological results is pre-sented in Sect. S3.
2.1 Simple lightning NO parameterization
Lightning NO production is parameterized as follows: As a first step, updrafts are localized by fitting rectangles in the horizontal plane enclosing areas where the vertical veloc-ity exceeds 5 m s−1. This is achieved by recursively cutting larger rectangles into smaller rectangles until no new edges are found with wmax≤5 m s−1 everywhere (for a more de-tailed description of the algorithm see Sect S1.4). For each updraft, a flash rateFP R(in flashes per minute) is calculated from:
FP R=α·5·10−6wmaxk . (2) wherewmaxis the maximum vertical velocity in meters per second. Based on empirical relationships, Price and Rind (1992) derived an exponent ofk=4.54, which is somewhat less than the model study based estimate of at least 6 by Baker et al. (1995). Pickering et al. (1998), who among other convective systems studied a squall line during TOGA COARE, used different values for different model simulated storms in order to obtain results comparable to observed flash rates. For their 2-D TOGA COARE simulation, they in-creased the exponent from 4.54 to 5.3. α is an empirical scaling factor which is adjusted to improve the agreement with available flash rate observations. For a mid-latitude su-percell storm Fehr et al. (2004) applied a scaling factor of 0.26. Here, sensitivity studies using various exponents and scaling factors were conducted (Table 1, Sect. 3).
The ratioZ=NIC/NCGof the number of intra cloud (IC) flashes to the number of cloud to ground (CG) flashes can either be prescribed in the CSRMC or estimated from the empirical relationship (Price and Rind, 1993):
Z=0.021(1h)4−0.648(1h)3+7.493(1h)2
−36.54(1h)+63.09 (3)
for clouds with 1h≥5.5 km, where 1h=zct w−z0◦C is the vertical distance between the 0◦C isotherm and the cloud top at the location of the maximum vertical updraft velocity (zct w). The cloud top heightzct is defined for each vertical column as the level above which the sum of the mass mix-ing ratios of all hydrometeor categoriesqtotm=qcloud water+ qrain+qice+qgraupel+qsnowdrops to below 0.01 g kg−1in all overlying levels. For clouds with1h<5.5 km all flashes are assumed to be IC flashes based on the observation that very little lightning is produced by clouds with1h<5.5 km and that clouds produce almost exclusively IC flashes dur-ing their growth stage before they start producdur-ing CG flashes (Price et al., 1997; Pickering et al., 1998).
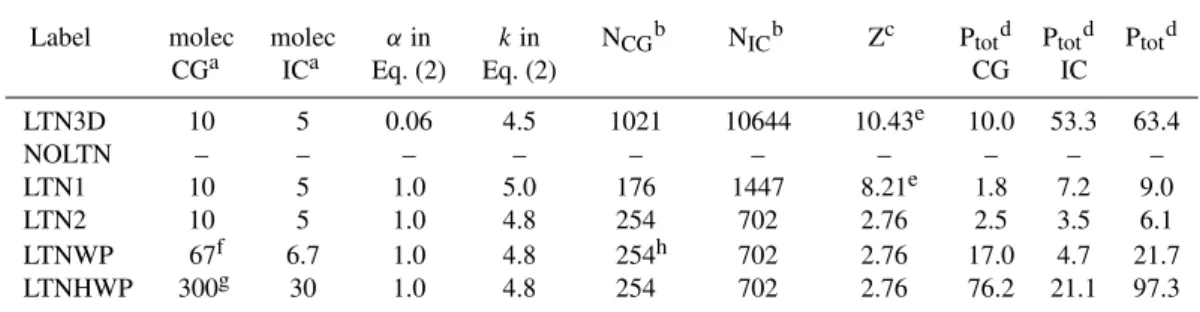
Table 1. Lightning NO sensitivity runs.
Label molec molec αin kin NCGb NICb Zc Ptotd Ptotd Ptotd
CGa ICa Eq. (2) Eq. (2) CG IC
LTN3D 10 5 0.06 4.5 1021 10644 10.43e 10.0 53.3 63.4
NOLTN – – – – – – – – – –
LTN1 10 5 1.0 5.0 176 1447 8.21e 1.8 7.2 9.0
LTN2 10 5 1.0 4.8 254 702 2.76 2.5 3.5 6.1
LTNWP 67f 6.7 1.0 4.8 254h 702 2.76 17.0 4.7 21.7
LTNHWP 300g 30 1.0 4.8 254 702 2.76 76.2 21.1 97.3
a 1025molecules per flash.
b Number of flashes calculated for the 7-day TOGA COARE runs using Eq. (2). c Ratio of number of IC flashes to number of CG flashes.
d Total NO production (1028molecules). e Diagnosed from calculated total flash numbers.
f Same as in LTN run of Wang and Prinn (2000), based on Price et al. (1997) who suggested 6.7·1026NO
molecules per CG flash.
g Same as the LTNH case of Wang and Prinn (2000), based on Franzblau and Popp (1989).
h For comparison: Wang and Prinn (2000) calculated a total of about 750 flashes, out of which∼210 were
CG flashes for the first hours of a 30 h 2-D run with 1000 km horizontal domain length.
flash segments are assumed to have a Gaussian distribu-tion and IC segments are assumed to have a bimodal dis-tribution corresponding to a superposition of two Gaussian distributions. The pressure dependence of the NO produc-tion is taken into account. In the present study, the upper mode of the IC distribution is assumed to be centered at z=z(−15)+0.8·(zct w−z(−15)), wherez(−15)is the altitude of the –15◦C isotherm, thus allowing the altitude of the upper mode to vary depending on the growth stage of the cloud.
CG flashes are placed (horizontally) in the vertical grid column at the location of the maximum updraft velocity, which is consistent with Ray et al. (1987), who based on dual Doppler radar and VHF lightning observations found that in a multi-cell storm, lightning tended to coincide with the reflectivity and updraft core. Nevertheless, this assump-tion potentially leads to a small over-estimate of the upward transport of lightning NOx. IC flashes are horizontally placed inside the previously identified anvil area in the vertical col-umn whereqt ot m above z(−15) is largest and which is still located within 80 km of the maximum updraft.
For each system, the anvil is identified as follows: First all grid points in the entire domain with a cloud top heightzct betweenzct w–1400 m and zct w+1400 m are flagged. Then, one grid point wide connections between flagged regions (“bridges”) and single points (“bumps”) on the edges of the flagged regions are removed. Finally, all the flagged points are identified which lie inside the region in which the column with the maximum updraft velocity is located, and which are less than 80 km away from this column (see Sect. S1.4 for details). This fairly simple method allows us to assign anvils
to the convective systems which have previously been iden-tified by fitting rectangles as described above.
In the 2-D runs lightning-produced NO is released into vertical columns of the same horizontal base area as in the 3-D run, i.e., 2 km×2 km. For numerical efficiency, light-ning NO production is calculated every 56 s in the 3-D run and every 60 s in the 2-D runs. This choice to some extent mimics the discreteness of flashes at times when flash rates are low.
3 Lightning NO sensitivity runs
3.1 Flash rates
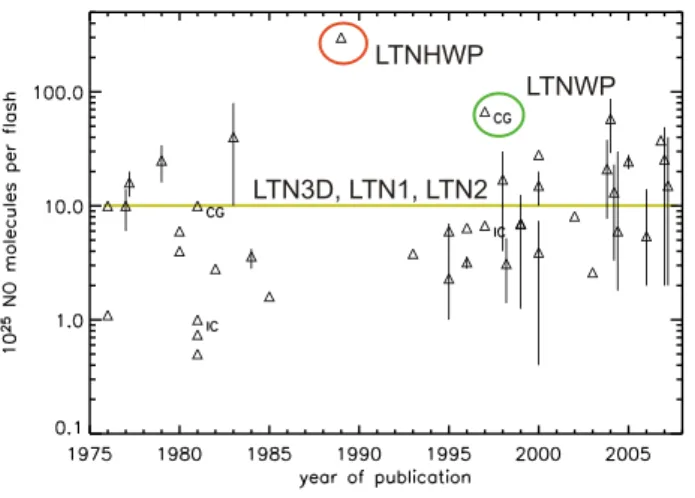
LTNHWP
LTN3D, LTN1, LTN2
LTNWP
Fig. 1. Lightning NO production rates in molecules per flash from the literature based on Table 21 of Schumann and Huntrieser (2007).
parameterization in Eq. (3). In the other runs, Z=2.76 is prescribed for clouds with1h≥5.5 km. The same value of Zhas also been adopted by Wang and Prinn (2000) in their cloud resolving model study of a storm during CEPEX. Fur-thermore, in the LTNWP and the LTNHWP run we prescribe the same number of molecules per IC and per CG flash as Wang and Prinn (2000) in their LTN and LTNH sensitivity run, respectively. In our LTN3D, LTN1, and LTN2 run we adopt a lower NO production per CG flash (Fig. 1), but a greater ratio of molecules per IC flash to molecules per CG flash based on recent literature (Gallardo and Cooray, 1996; Cooray, 1997; DeCaria et al., 2000; Fehr et al., 2004).
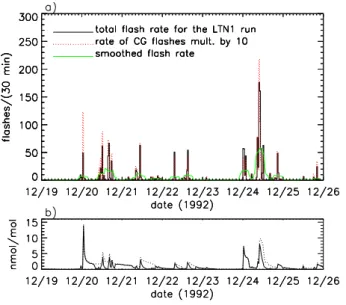
Figure 2a shows modeled 30 min flash rates for the LTN3D run. The area density and maximum number of CG flashes in the LTN3D run are in line with the available observations. The daily area flash density in the TOGA COARE region can roughly be estimated to equal 0.0022 CG flashes per km2per day from Fig. 10 of Petersen et al. (1996) on days with high lightning activity during seasons with high lightning activ-ity. The number of CG flashes in our LTN3D run is 1021 (Table 1) and the average area flash density during the last 6 days of the simulation (after the onset of deep convection in the model) is 0.0028 CG flashes per km2per day, which agrees with the observations within∼30%.
In selecting the parameters in the flash rate parameteriza-tion (Eq. 2) we attempted to approximatively match observed CG flash area densities as well as flash rates per storm. In se-vere continental thunderstorms rates of 20 and more flashes per minute can be sustained over an hour or more (see e.g. Skamarock et al., 2003; Fehr et al., 2004). In the TOGA COARE region, on the other hand, during more active storms flash rates of only 1–2 (and in one case 4) discharges (both IC and CG) per minute were observed by two NASA air-craft during storm overpasses (Orville et al., 1997). Light-ning was only observed during 19 out of 117 storm
over-Fig. 2. (a)Flashes per 30 min in the LTN3D run and smoothed (5 point running mean) total flash rates (green line). (b)Maximum NO (solid line) and NOx(dotted line) volume mixing ratios below ∼16 km for the LTN3D run. Local ’solar’ time is UTC plus 10.5 h.
passes. Petersen et al. (1996) also noted that the majority of convection over the tropical oceans does not produce light-ning. For four cells with similar characteristics which were all observed on 15 February 1993 they found CG flash rates peaking at slightly above 7 CG flashes within 20 min (see their Fig. 5). Here, the maximum CG flash rates are typi-cally between 10 and 20 flashes per 30 min in all lightning sensitivity runs (see Fig. 2a for the LTN3D, Fig. 3a for the LTN1 run, and Fig. 4a for the other 2-D lightning sensitivity runs). Often only the single most vigorous updraft signifi-cantly contributes to these rates (not shown).
3.2 Lightning NOx
Fig. 3.Same as Fig. 2 for the LTN1 run.
run can nevertheless be considered unrealistic.
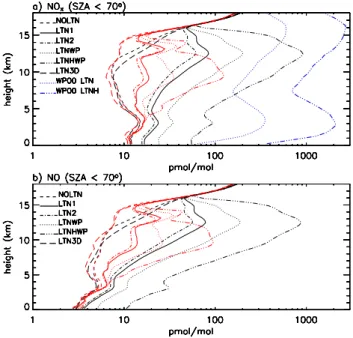
Lower domain-average NOx and NO volume mixing ra-tios in our LTNWP and LTNHWP runs compared to the vol-ume mixing ratios at the end of the LTN and LTNH runs of Wang and Prinn (2000) (also included in Fig. 5) are in part caused by lower average flash rates in our study and the use of different model setups. Wang and Prinn (2000) used pe-riodic lateral boundary conditions and calculated a total of about 750 flashes (estimated from their Fig. 6) out of which
∼210 were CG flashes for a 30 h run with a 1000 km 2-D domain; i.e. 0.17 CG flashes km−1day−1(compared to 0.07 CG flashes km−1day−1in the LTN2 run).
The scaling factorαin Table 1 is smaller for the 3-D run than for the 2-D run because of generally higher vertical ve-locities in 3-D simulations compared to 2-D simulations (Re-delsperger et al., 2000; Phillips and Donner, 2006). In spite of the smallerα in the LTN3D run, the number of flashes and the number of NO molecules produced are greater in the LTN3D run than in the LTN1 run. Because of the differ-ent geometry, the domain-averaged mixing ratios in Fig. 5 are, nevertheless, higher in the LTN1 run; i.e. by assuming lightning-produced NO to be released into vertical columns of the same horizontal base area (2 km×2 km) in the 2-D runs as in the 3-D run, it is implicitly assumed that the horizontal “area” of the 2-D domain equals 2 km×500 km. For a given number of NO molecules produced by lightning, this leads to generally greater domain-average NOxvolume mixing ratios due to lightning in the 2-D simulations. Assuming a lower NO production per flash in the 2-D runs in order to compen-sate for this geometry effect, on the other hand, would also lead to unrealistic consequences for chemistry in the vicinity of the lightning NO source.
Fig. 4. (a) Same as Fig. 2a for the LTN2, the LTNWP, and the LTNHWP run. (b-d)Same as Fig. 2b for the LTN2, the LTNWP, and the LTNHWP run, respectively.
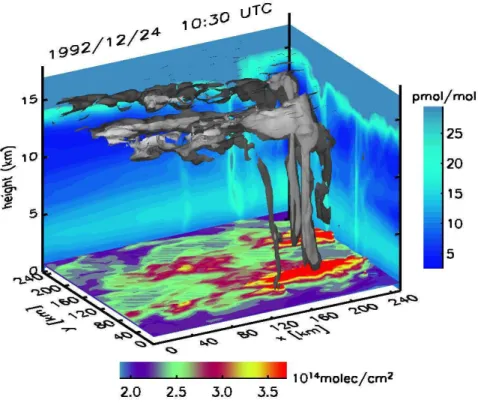
Using a vertical distribution of NO molecules which is constant except for being scaled by pressure for IC and CG flashes instead of the DeCaria et al. (2000) parameteriza-tion results in smaller maxima for the same number of NO molecules produced per flash (not shown), because of the two maxima in the vertical distribution by DeCaria et al. (2000) (compare also “lno” term in Fig. 8b). The influence of light-ning on the average NOxmixing ratio profiles is small in our 3-D run, but considerable in the 2-D runs (Fig. 5). An exam-ple of the spatial distribution of NOx from the LTN3D run is shown in Fig. 6. An example from a 2-D run is shown in Fig. 7. Note, that this NOx plume is almost completely advected out of the domain in∼2.5–3 hours.
3.3 NOxbudget
define height dependent contributions by: bproc(z, t1, t2)=
1 XY
Z X
0 Z Y
0 Z t2
t1
∂tCi,g|procdx dy dt (4) whereX andY is the horizontal extent of the domain in West-East and South-North direction, respectively. Horizon-tal advection∂tCi,g|hadv=−∇ · vhCi,gand vertical advec-tion∂tCi,g|vadv=−∂z wCi,g(wherevh=(u, v)is the hori-zontal wind vector) are considered separately. The budget terms have been divided by time-averaged air density in or-der to express them in mixing ratio units. In addition to the “height resolved” terms in Eq. (4), the corresponding height integrated terms are analyzed for layers betweenz1andz2: Bproc=
Z z2
z1
bprocdz (5)
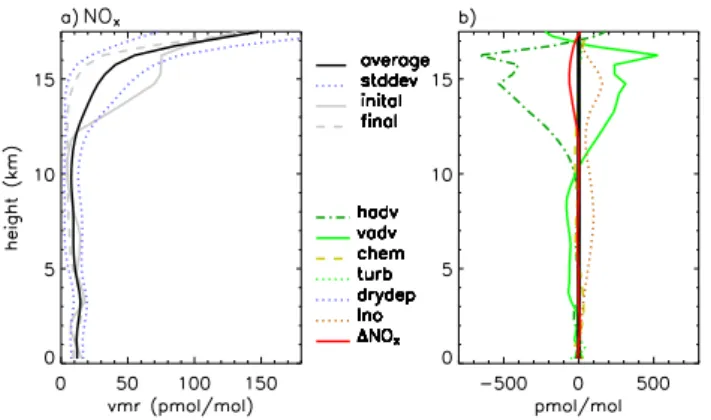
Figure 8a shows NOxmixing ratio profiles for the LTN3D run, and Fig. 8b shows time integrated domain-averaged ten-dencies. Most of the NOx produced below 10 km is trans-ported to the upper troposphere from where it is horizontally advected out of the domain (compare also Fig. 6 and Fig. 7). The lightning production term has two maxima reflecting the vertical distribution functions from DeCaria et al. (2000), in which IC as well as CG flashes contribute to the mid-tropospheric maximum while the upper mid-tropospheric maxi-mum is caused by IC flashes. Very little NOx reaches the lowest kilometer of the atmosphere, a region where detrain-ment from deep cloud downdrafts can be expected. This re-sult is consistent with a rere-sult of Pickering et al. (1998) from a CRM study of a single storm during TOGA COARE, who found only about 7.5% of the lightning-produced N mass in the lowest km because of the very weak downdrafts in their simulated storm. In mid-latitude storms they found consider-ably larger fractions. In the CSRMC, the downward transport could be underestimated because lightning NO is assumed to be produced in columns with maximum updraft velocities.
Net photochemical loss of NOxwithin the domain plays a relatively much more important role in our 2-D lightning sensitivity runs than in our 3-D run (Fig. 9). Higher NOx volume mixing ratios in the 2-D runs lead to increases of OH concentrations (Sect. 5) and a reduced chemical lifetime of NOx. The fraction of NOx photochemically lost within the domain varies between 20 and 24% in the 2-D runs, but is only 1% in the LTN3D run. In the 3-D run the loss of lightning-produced NOx in the lower troposphere is in fact over-compensated by production from PAN. The net chem-ical production of NOx is 2.0×10¹³molecules cm−2day−1 in the lower troposphere (LT, 0–5 km) during the last 6 days of the simulation, when deep convection is active. By far the largest chemical source of NOx in the LT is PAN, while HNO3 is the largest sink. PAN is horizontally ad-vected into the domain above∼3 km. More details on the NOx, PAN, and HNO3budgets can be found in the supple-mentary material http://www.atmos-chem-phys.net/8/2741/ 2008/acp-8-2741-2008-supplement.pdf.
Fig. 5. Domain- and time-average (black lines) and median (red lines) volume mixing ratios of(a)NOxand(b)NO for solar zenith angles (SZA) lower than 70◦. Blue lines in (a): domain-averaged NOxvolume mixing ratio from Fig. 11 of Wang and Prinn (2000) at the end of their LTN and LTNH runs.
Comparable 2-D sensitivity runs with a pressure scaled but otherwise constant vertical distribution of NO molecules for IC and CG flashes yielded different fractions of NOx lost within the domain (13–37%) and greater sensitivities to various assumptions regarding lightning NOx production (Fig. 8.8 of Salzmann, 2005). In a non-HOx-limited regime, the relatively smaller photochemical loss in the LTN3D run is in agreement with the lower average NOxconcentrations compared to the 2-D run. Furthermore, the shorter residence time in the 3-D domain probably also plays a role, but this is difficult to quantify.
4 Ozone
Fig. 6. Spatial distribution of NOxin the LTN3D run for 24 December 1992, 10:30 UTC: 50 pmol mol−1(dark gray, transparent) and 100 pmol mol−1(light gray) isosurfaces, surface to 16 km column density contours (base area), and average volume mixing ratio in x (East-West) and y (South-North) direction (walls).
NOxproduction by CG flashes. While here the sensitivity of local O3mixing ratios to in situ lightning NOxproduction is small, Crawford et al. (1997) found considerably increased O3mixing ratios in air masses sampled during PEM-West B which had presumably been influenced by lightning over land upstream. These air masses had been more chemically aged and better mixed.
4.1 Ozone budget
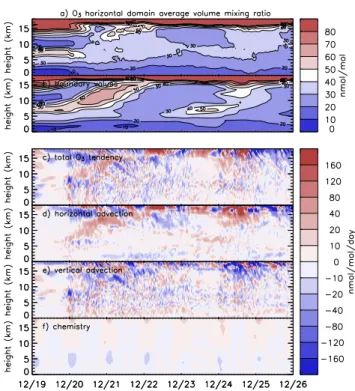
The domain-averaged O3 mixing ratios vary significantly during the LTN3D run (Fig. 11a) and are very similar to the boundary values (Fig. 11b), indicating that horizontal advec-tion from the lateral boundaries rapidly influences and ulti-mately determines the simulated domain averages. Although vertical advection (Fig. 11e) tends to balance horizontal ad-vection (Figs. 11d and 12b), the total tendency (Fig. 11c) mainly reflects horizontal advection from the boundaries. The time integrated total O3 tendency (equaling 1O3 in Fig. 12), on the other hand, is smaller than the time inte-grated contributions from either horizontal or vertical advec-tion, i.e., over longer time scales an approximate equilib-rium (1O3≈0) tends to establish. Furthermore, the contri-bution from photochemistry plays an important role in the 7-day integrated domain budget (Fig. 12). The most pro-nounced net loss takes place at∼5 km where relatively O3
-rich air is advected into the domain and where photolysis rates are occasionally enhanced through sunlight reflected by mid-level cloud tops. While vertical advection of O3-poor air on average tends to decrease O3 volume mixing ratios above ∼14 km, vertical advection of ozone from the mid-troposphere (between∼6–10 km) enhances O3mixing ratios between∼10 and 14 km. This is consistent with our previous study of idealized tracer transport (Salzmann et al., 2004) in which we found considerable mid-tropospheric entrainment in a 3-D TOGA COARE simulation.
frac-Fig. 7. NOxvolume mixing ratios and theqtotm=0.01g kg−1 con-tour (whereqtotm=qcloud water+qrain+qice+qgraupel+qsnow is the sum of all hydrometeor mass mixing ratios) during the de-velopment of a mesoscale convective system from 24 December 1992, 10:00 UTC to 24 December 1992, 12:30 UTC from the LTN1 run. The time increment between the plots in each of the panels is 30 min.
Fig. 8. (a)Time- and domain-averaged NOxvolume mixing ratio, averaged NOx volume mixing ratio±standard deviation, initial, and final NOxvolume mixing ratio profiles for the LTN3D run.(b) Budget terms (from Eq. (4), divided by the average air density) and the difference between the initial and the final profile (red line).
Fig. 9.Ratios of time integrated tropospheric column NOx tenden-cies for the lightning sensitivity runs (calculated from Table S4).
Fig. 10. (a)Domain- and time-averaged (black) and median (red) O3 volume mixing ratio for SZA<70◦. (b) Domain- and time-averaged net O3chemistry tendency for SZA<70◦.
Fig. 11. (a)Time series of domain-averaged O3 volume mixing ratios for the LTN3D run;(b)boundary values;(c)–(f)budget terms as defined by Eq. (4).
4.2 Undiluted transport
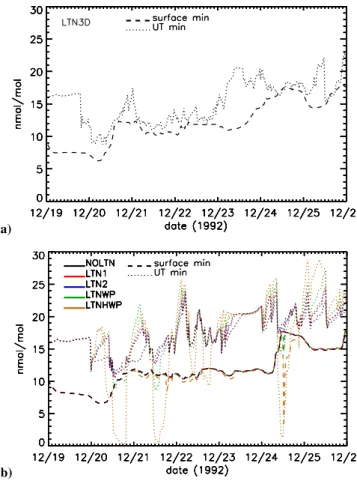
Global and also mesoscale models often use bulk instead of ensemble mass flux parameterizations in order to calculate deep convective tracer transport, in which mid-level entrain-ment is incompatible with undiluted transport to the upper troposphere (Lawrence and Rasch, 2005). In Fig. 15, simu-lated upper tropospheric O3volume mixing ratio minima are compared to minima in the lowest model layer. The UT min-imum in the LTN3D run is often much closer to the surface minimum than in the 2-D run, indicating that some undiluted air has reached the upper troposphere in this run in spite of significant mid-level entrainment (Sect. 4.1).
During the CEPEX cruise, extremely low (<5 nmol/mol) upper tropospheric O3volume mixing ratios were observed (e.g. Kley et al., 1996, 1997). A few model studies (Wang et al., 1995; Lawrence et al., 1999a) have reproduced these minima qualitatively, but not quantitatively. An exception has been the cloud resolving model study by Wang and Prinn (2000), who suggested that lightning related O3loss can help explain layers of very low O3 in the upper tropical tropo-sphere. Figure 15 shows pronounced decreases of O3mixing ratios indicating the loss of O3in the reaction with NO only for the LTNHWP run and to a much lesser extent also for the LTNWP run. Since the number of molecules per flash in the LTNHWP run is several times as large as the next largest
Fig. 12.As Fig. 8 for ozone.
Fig. 13.As Fig. 11 for the LTN1 run.
estimate from the literature (Fig. 1), it is extremely unlikely that the occasionally observed layers of very low O3 concen-tration are caused by lightning NO production.
Fig. 14.As Fig. 12 for the LTN1 run.
reproduce the very low ozone concentrations observed dur-ing CEPEX, one would most likely need a larger domain. Furthermore, as has been suggested in Kley et al. (1996); Lawrence et al. (1999a), it might be necessary to include ad-ditional reactions involving halogens (e.g. Davis et al., 1996; Sander and Crutzen, 1996, compare discussion in Sect. 6). 4.3 Small scale downward transport
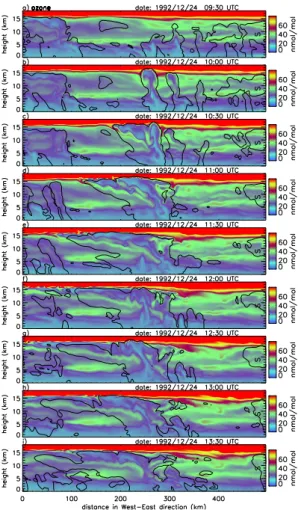
Small scale downward transport of air with stratospheric ori-gin in association with deep convection has been simulated in a number of two-dimensional cloud resolving model stud-ies (Scala et al., 1990; Wang et al., 1995; Stenchikov et al., 1996; Wang and Prinn, 2000) in agreement with observa-tions by Poulida et al. (1996) and Dye et al. (2000), who found air with stratospheric characteristics in the upper tro-posphere in the vicinity of mid-latitude storms. A very pro-nounced example from our LTN1 run is shown in Fig. 16 where O3-rich air is advected downward in the rear inflow of a large mesoscale convective system. In the LTN3D run, such events are less easily identified, in part possibly due to the lower vertical resolution. Newell et al. (1996, 1999) inter-preted thin horizontal layers in the troposphere as frozen sig-natures of the transfer of boundary layer air into the free tro-posphere or of stratospheric air into the trotro-posphere. Newell et al. (1996) identified over 500 layers with a mean thick-ness of about 400 m from 105 vertical profiles sampled dur-ing PEM-West A over the West Pacific. They found these layers to extend over distances of 100–200 km or more. Us-ing a different method to identify horizontal layers, Newell et al. (1999) found the average thickness of horizontal lay-ers during PEM-West A to be about 800 m. The vertical resolution in this study is not high enough to adequately resolve the thinner ones among these layers. Instead, we focus on a comparison with Wang and Prinn (2000), who found that downward transport of O3-rich air increased up-per tropospheric O3 mixing ratios, outweighing the effect of upward transport of O3-poor air. In the LTN1 run, on the other hand, vertical advection tends to decrease upper
(a)
(b)
Fig. 15. Time series of minimum O3mixing ratios in the lowest model layer (dashed lines) and in the UT (defined from about 10 km to about 16 km, dotted lines) for(a)the LTN3D run and(b)the 2-D lightning sensitivity runs.
tropospheric O3 mixing ratios (Fig. 14). On the whole, a small net amount of O3 is transported from below 16 km (troposphere) to above 16 km (stratosphere) in our simula-tions: 4×10¹⁵molecules cm−2day−1in the LTN3D run, and 6×10¹⁵molecules cm−2day−1in the LTN1 run. This small upward transport is influenced by the method used to spec-ify the large scale forcing (see Sect. S5.3 for details) and is consistent with parts of the tropics being a region of average lower stratospheric ascent and troposphere to stratosphere transport (Holton et al., 1995; Corti et al., 2005).
The reason why Wang and Prinn (2000) found downward transport to increase upper tropospheric O3 mixing ratios in spite of the upward transport of O3-poor air might best be explained by their initial profile, which varied by only
Fig. 16. O3volume mixing ratios (filled) from the LTN1 run for 24 December 1992, 9:30 UTC to 13:30 UTC and total hydrometeor mixing ratioqt ot m=0.01g kg−1contour.
the vicinity of deep convection are necessary that allow us to discriminate between vertical transport from below and import from the stratosphere, in combination with dedicated 3-D model studies, possibly using an idealized O3tracer and very high vertical resolution.
5 HOx
Together with NOx, hydrogen oxides play a crucial role for the troposphere’s oxidation capacity and ozone chemistry. Figure 17 shows increasing OH concentrations with increas-ing lightnincreas-ing NO production in the 2-D lightnincreas-ing sensitivity runs and slightly decreasing HOxconcentrations in all runs but the LTNHWP run, in which the decrease is somewhat larger (of the order of a few pmol mol−1in the upper tropo-sphere). An increase of OH and a small decrease of HO2is caused by the NO oxidation reaction
NO+HO2→NO2+OH
Fig. 17. (a)Median (red) and average (black lines) OH concentra-tion around local noon and diurnal averages (blue). (b)Same for HOxvolume mixing ratios.
which shifts the partitioning between OH and HO2 to-wards higher OH/HO2 ratios while leaving the HOx con-centration constant. At very high NO concon-centrations in the vicinity of the flashes HOx concentrations decrease due to the termination reaction of OH with NO2in which HNO3is formed. While we find increasing OH concentrations with increasing lightning NO production, Wang and Prinn (2000) found a very strong decrease of OH in one of their lightning sensitivity runs and a complete depletion of OH throughout the troposphere in the other run, which is consistent with significantly higher NOxconcentrations in their simulations (Fig. 5). The elevated HOxconcentrations above the bound-ary layer in Fig. 17 are caused by larger scale horizontal transport of O3-rich air (compare Sect. 4 and Sect. 6). Ele-vated OH concentrations above the boundary layer have pre-viously been observed above the eastern tropical Pacific un-der conditions of high NOxand CO concentrations at these altitudes (Davis et al., 2001).
6 Role of the intra-seasonal oscillation (ISO) for ozone profiles
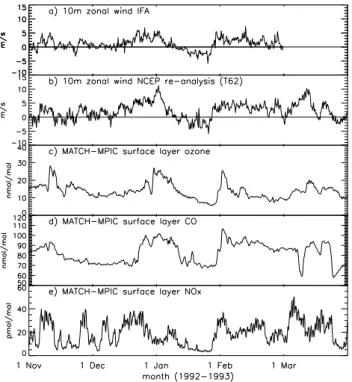
Fig. 18. Time series of (a) 10 m observed zonal wind, (b) 10 m zonal wind from the interpolated NCEP re-analysis data (see Sect. S8),(c)O3volume mixing ratio in the lowest model layer (surface layer) calculated by MATCH-MPIC,(d)surface layer CO, (e)surface layer NOxat the site of the TOGA COARE IFA.
O3volume mixing ratios in the MBL tend to be higher and upper tropospheric O3volume mixing ratios lower than dur-ing the easterly phase. The zonal wind component lags O3 in the MBL (Fig. 19a, lower panel), but taking into account a lag does not improve the correlation significantly at most longitudes. The increase in lower tropospheric O3 volume mixing ratios during the WP is most likely related to cross-equatorial flow over the Indonesian Archipelago advecting polluted air masses from the Northern Hemisphere into the TOGA COARE/CEPEX region (see schematic in Fig. 20). This cross-equatorial flow is characteristic of the westerly phase of the ISO (e.g. Yanai et al., 2000; McBride et al., 1995). While surface winds are westerly during the WP, up-per tropospheric winds tend to be easterly, advecting O3-poor air from convective regions of the central Pacific into the re-gion. During the easterly phase of the ISO the flow is roughly opposite. The dependence of O3concentrations on the phase of the ISO and regional scale horizontal advection can help to explain the lack of coincidence between upper tropospheric and lower tropospheric O3minima in the profiles observed during CEPEX. Furthermore, one could speculate that the low (high) NOxregime (in the upper troposphere) identified by Crawford et al. (1997) might coincide with the westerly (easterly) phase of the ISO. The seven-day episode from 19– 26 December 1992 is characterized by the onset of a strong WP.
Fig. 19. Upper panels: Correlation of vertically averaged zonal wind velocity below∼1000 m to(a)minimum O3volume mixing ratios in the MBL (below∼1000 m) and(b)minimum O3volume mixing ratios in the upper troposphere (∼10–15 km), at 2.86◦S for 31 October 1992 to 31 March 1993 from MATCH-MPIC for lag 0 h (diamonds) and for a lag between –96 and 96 h (lower panels) at the time of the maximum absolute correlation (crosses).
MATCH-MPIC reproduces the ozone minima observed during CEPEX qualitatively but not quantitatively (Lawrence et al., 1999a); a possible candidate for a missing chemical ozone sink in the model being halogen-catalyzed ozone de-struction (e.g. Davis et al., 1996; Sander and Crutzen, 1996). The domain of the CSRMC is too small to simulate the regional scale transport associated with the ISO explicitly; instead the effect of regional scale horizontal advection is taken into account by specifying boundary conditions for trace gases. In the future, growing computer power will allow us to increase domain sizes and a multiply-nested cloud re-solving model setup including chemistry for TOGA COARE will become feasible. A nested setup without chemistry is currently being evaluated for TOGA COARE.
7 Summary and conclusions
UT
LT
Fig. 20. Schematic: During the westerly phase of the ISO lower tropospheric cross-equatorial flow transports polluted air to the TOGA COARE/CEPEX region. The contours at the base are 850 hPa ozone volume mixing ratios from MATCH-MPIC and interpolated wind vectors are from the NCEP re-analysis dataset for 24 December 1992, 00:00 UTC.
on domain-averaged O3, and the lightning NOxplumes are horizontally advected out of the domain. The effect of light-ning NO on domain-averaged NOxstrongly depends on the dimensionality of the model. In the 3-D reference (LTN3D) run lightning has a weak influence on the domain-average NOx profile, but in the 2-D sensitivity runs lightning NO causes a large increase of domain-averaged NOxbecause of the smaller implicitly assumed “volume” of the 2-D domain. Significantly lower NOxvolume mixing ratios in the LTN3D run, in spite of a much higher number of flashes, have an important implication for the loss of NOxin the vicinity of the storms: While between 20 and 24% of the lightning-produced NOxis lost due to chemistry inside the domain in the 2-D runs, this fraction is negligible in the LTN3D run and the loss is more than compensated by NOxproduction from PAN. This suggests that the results of 2-D sensitivity runs are to be interpreted with caution and that 3-D runs are needed in order to realistically assess the influences of in situ lightning on local chemistry. Because multi-day 3-D runs are still computationally expensive (to our knowledge this is the first multi-day cloud system resolving study including chem-istry), 2-D sensitivity runs can nevertheless be useful, espe-cially for comparing with 2-D sensitivity runs from a previ-ous study. Domain-averaged OH is found to increase with increasing lightning NO production and HOxis fairly insen-sitive except for a notable decrease in the run with extremely high NO production per flash.
Mid-level entrainment plays an important role for O3 transport from the mid-troposphere to the UT between∼10 and 14 km, but transport of O3-poor air from the MBL tends to decrease O3volume mixing ratios between 14 and 15.5 km in the LTN3D run. In spite of the importance of mid-level entrainment, undiluted O3-poor air from the MBL reaches the upper troposphere more frequently in this run than in
the 2-D runs, indicating the presence of undiluted convec-tive cores (e.g. Heymsfield et al., 1978). Unlike in a bulk updraft cumulus transport parameterization or single column model, mid-level entrainment does not preclude the trans-port of undiluted air in a cloud system model since the dy-namics of multiple storms and mesoscale convective systems is modeled. The finding of undiluted transport despite mid-level entrainment strongly suggests that plume ensemble pa-rameterizations (e.g. Arakawa and Schubert, 1974; Gidel, 1983; Donner, 1993; Lawrence and Rasch, 2005) should be used instead of bulk mass flux parameterizations in global chemistry-transport models.
The causes of extremely low O3mixing ratios in the up-per troposphere were examined through a series of sensitivity studies. We found that low O3mixing ratios can be a result of lightning-produced NO when high NO production rates and flash rates are used in a 2-D run, similar to Wang and Prinn (2000). However, a recent review of NO production by light-ning (Schumann and Huntrieser, 2007) indicates that the NO production rate used in this sensitivity simulation is 10–100 times greater than most values reported in the literature. We therefore think this source is unrealistic.
We find vertical transport of ozone poor air to play a larger role in causing low upper tropospheric mixing ratios than Wang and Prinn (2000), who specified an initial O3profile with a relatively small vertical gradient between the bound-ary layer and the upper troposphere.
31 October 1992 to 31 March 1993 suggest that vertical ozone profiles in the TOGA COARE/CEPEX region are strongly influenced by the ISO. This influence can help to explain the lack of coincidence between upper and lower tro-pospheric O3minima observed during CEPEX.
In the LTN1 run, small scale downward transport of ozone from the tropopause layer is simulated to occur in thin fila-ments extending far into the troposphere in association with rear inflow into mesoscale convective systems. On the whole, however, vertical advection tends to decrease upper tropo-spheric ozone mixing ratios in this run due to the upward transport of O3-poor air from the MBL, and a small aver-age net upward transport of O3 from below∼16 km in as-sociation with average large scale ascent is simulated in all runs. In order to better quantify the influences of small scale downward transport, additional observations in the vicinity of deep convection are necessary as well as dedicated 3-D model studies with very high vertical resolution. Since cloud system resolving model simulations require meteorological input from comprehensive observation campaigns such as TOGA COARE nested cloud resolving model simulations are likely to be a good alternative in many regions. Further-more, as discussed in Salzmann et al. (2004), the application of observation derived large scale forcings for trace gases would, unlike for water vapor and potential temperature, be problematic.
Acknowledgements. We are very thankful to Larry Horowitz for providing pre-processed NCEP meteorological data for MATCH-MPIC input and to Rolf von Kuhlmann for useful discussions and advice on the chemistry mechanism and the implementation of the ice uptake. Furthermore, we appreciate the comments by two referees which have led to many significant improvements of our initial manuscript. This research was supported by funding from the German Research Foundation (DFG) Collaborative Research Centre 641 (SFB 641) “The Tropospheric Ice Phase (TROPEIS)” and from the German Ministry of Education and Research (BMBF), project 07-ATC-02. The model output files in netCDF format (∼180Gb in total) can be obtained upon request from the authors at the MPI-C.
Edited by: Ronald Cohen
References
Arakawa, A. and Schubert, W. H.: Interaction of a cumulus cloud ensemble with the large-scale environment, Part I, J. Atmos. Sci., 31, 674–701, 1974.
Baker, M. B., Christian, H. J., and Latham, J.: A computational study of the relationships linking lightning frequency and other parameters, Q. J. R. Meteorol. Soc., 121, 1525–1548, 1995. Christian, H. J., Blakeslee, R. J., Boccippio, D. J., Boeck, W. L.,
Buechler, D. E., Driscoll, K. T., Goodman, S. J., Hall, J. M., Koshak, W. J., Mach, D. M., and Stewart, M. F.: Global fre-quency and distribution of lightning as observed from space by
the Optical Transient Detector, J. Geophys. Res., 108, 4005, doi:10.1029/2002JD002347, 2003.
Ciesielski, P. E., Johnson, R. H., Haertel, P. T., and Wang, J.: Cor-rected TOGA COARE sounding humidity data: Impact on diag-nosed properties of convection and climate over the warm pool, J. Climate, 16, 2370–2384, 2003.
Cooray, V.: Energy dissipation in lightning flashes, J. Geophys. Res., 102, 21 401–21 410, 1997.
Corti, T., Luo, B. P., Peter, T., V¨omel, H., and Fu, Q.: Mean ra-diative energy balance and vertical mass fluxes in the equatorial upper troposphere and lower stratosphere, Geophys. Res. Lett., 32, L06802, doi:10.1029/2004GL021889, 2005.
Crawford, J. H., Davis, D. D., Chen, G., Bradshaw, J., Sandholm, S., Kondo, Y., Merill, J., Liu, S., Browell, E., Gregory, G., Anderson, B., Sachse, G., Barrick, J., Blake, D., Talbot, R., and Pueschel, R.: Implications of large shifts in tropospheric NOxlevels in the remote tropical Pacific, J. Geophys. Res., 102, 28 447–28 468, 1997.
Davis, D., Crawford, J., Liu, S., McKeen, S., Bandy, A., Thornton, D., Rowland, F., and Blake, D.: Potential impact of iodine on tro-pospheric levels of ozone and other critical oxidants, J. Geophys. Res., 101, 2135–2147, 1996.
Davis, D., Grodzinsky, G., Chen, G., Crawford, J., Eisele, F., Mauldin, L., Tanner, D., Cantrell, C., Burne, W., Tan, D., Faloona, I., Ridley, B., Montzka, D., Walega, J., Grahek, F., Sandholm, S., Sachse, G., Vay, S., Anderson, B., Avery, M., Heikes, B., Snow, J., O’Sullivan, D., Shetter, R., Lefer, B., Blake, D., Blake, N., Carroll, M., and Wang, Y.: Marine lati-tude/altitude OH distributions: Comparison of Pacific Ocean ob-servations with models, J. Geophys. Res., 106, 32 691–32 708, 2001.
DeCaria, A. J., Pickering, K. E., Stenchikov, G. L., Scala, J. R., Stith, J. L., Dye, J. E., Ridley, B. A., and Laroche, P.: A cloud-scale model study of lightning-generated NOxin an indi-vidual thunderstorm during STERAO-A, J. Geophys. Res., 105, 11 601–11 616, 2000.
DeCaria, A. J., Pickering, K. E., Stenchikov, G. L., and Ott, L. E.: Lightning-generated NOx and its impact on tropo-spheric ozone production: A three-dimensional modeling study of a Stratosphere-Troposphere Experiment: Radiation, Aerosols and Ozone (STERAO-A) thunderstorm, J. Geophys. Res., 110, D14303, doi:10.1029/2004JD005556, 2005.
Dickerson, R. R., Huffman, G. J., Luke, W. T., Nunnermacker, L. J., Pickering, K. E., Leslie, A. C. D., Lindsey, C. G., Slinn, W. G. N., Kelly, T. J., Daum, P. H., Delaney, A. C., Greenberg, J. P., Zim-merman, P. R., Boatman, J. F., Ray, J. D., and Stedman, D. H.: Thunderstorms: An important mechanism in the transport of air pollutants, Science, 235, 460–465, 1987.
Donner, L. J.: A cumulus parameterization including mass fluxes, vertical momentum dynamics, and mesoscale effects, J. Atmos. Sci., 50, 889–906, 1993.
Fehr, T., H¨oller, H., and Huntrieser, H.: Model study on production of lightning-produced NOx in a EULINOX supercell storm, J. Geophys. Res., 109, D09102, doi:10.1029/2003JD003935, 2004. Franzblau, E. and Popp, C. J.: Nitrogen oxides produced from
light-ning, J. Geophys. Res., 94, 11 089–11 104, 1989.
Gallardo, L. and Cooray, V.: Could cloud-to-cloud discharges be as effective as cloud-to-ground discharges in producing NOx?, Tellus, 48B, 641–651, 1996.
Ganzeveld, L. and Lelieveld, J.: Dry deposition parameterization in a chemistry general circulation model and its influence on the distribution of reactive trace gases, J. Geophys. Res., 100, 20 999–21 012, 1995.
Gidel, L. T.: Cumulus cloud transport of transient tracers, J. Geo-phys. Res., 88, 6587–6599, 1983.
Heymsfield, A. J., Johnson, P. N., and Dye, J. E.: Observations of moist adiabatic ascent in northeast Colorado cumulus congestus clouds, J. Atmos. Sci., 35, 1689–1703, 1978.
Holton, J. R., Haynes, P. H., McIntyre, M. E., Douglass, A. R., Rood, R. B., and Pfister, L.: Stratosphere-troposphere exchange, Rev. Geoph., 33, 403–439, 1995.
Huntrieser, H., Schlager, H., Feigl, C., and H¨oller, H.: Transport and production of NOxin electrified thunderstorms: Survey of previous studies and new observations at midlatitudes, J. Geo-phys. Res., 103, 28 247–28 264, 1998.
Kawakami, S., Kondo, Y., Koike, M., Nakajima, H., Gregory, G. L., Sachse, G. W., Newell, R. E., Browell, E. W., Blake, D. R., Ro-driguez, J. M., and Merrill, J. T.: Impact of lightning and convec-tion on reactive nitrogen in the tropical free troposphere, Geo-phys. Res. Lett., 102, 28 367–28 384, 1997.
Kley, D., Crutzen, P. J., Smith, H. G. J., V¨omel, H., Oltmans, S. J., Grassl, H., and Ramanathan, V.: Observations of near-zero ozone concentrations over the convective Pacific: Effects on air chem-istry, Science, 274, 230–233, 1996.
Kley, D., Smit, H. G. J., V¨omel, H., Grassl, H., Ramanathan, V., Crutzen, P. J., Williams, S., Meywerk, J., and Oltmans, S. J.: Tropospheric water-vapour and ozone cross-sections in a zonal plane over the central equatorial Pacific Ocean, Q. J. R. Meteorol. Soc., 123, 2009–2040, 1997.
Labrador, L. J., von Kuhlmann, R., and Lawrence, M. G.: Strong sensitivity of the global mean OH concentration and the tropo-spheric oxidizing efficiency to the source of NOxfrom lightning, Geophys. Res. Lett., 31, L06102, doi:10.1029/2003GL019229, 2004.
Landgraf, J. and Crutzen, P. J.: An efficient method for online cal-culations of photolysis and heating rates, J. Atmos. Sci., 55, 863– 878, 1998.
Lawrence, M. G. and Rasch, P. J.: Tracer transport in deep con-vective updrafts: Plume ensemble versus bulk formulations, J. Atmos. Sci., 62, 2880–2894, 2005.
Lawrence, M. G., Crutzen, P. J., and Rasch, P. J.: Analysis of the CEPEX ozone data using a 3D chemistry-meteorology model, Q. J. R. Meteorol. Soc., 125, 2987–3009, 1999a.
Lawrence, M. G., Crutzen, P. J., Rasch, P. J., Eaton, B. E., and Mahowald, N. M.: A model for studies of tropospheric photo-chemistry: Description, global distributions, and evaluation, J. Geophys. Res., 104, 26 245–26 277, 1999b.
Lawrence, M. G., von Kuhlmann, R., Salzmann, M., and Rasch, P. J.: The balance of effects of deep convective
mix-doi:10.1029/2003GL017644, 2003.
Lelieveld, J. and Crutzen, P. J.: Role of deep cloud convection in the ozone budget of the troposphere, Science, 264, 1759–1761, 1994.
Madden, R. A. and Julian, P. R.: Observations of the 40–50 day tropical oscillation – A review, Mon. Weather Rev., 122, 814– 837, 1994.
Mahowald, N. M., Rasch, P. J., and Prinn, R. G.: Cumulus parame-terizations in chemical transport models, J. Geophys. Res., 100, 26 173–26 189, 1995.
McBride, J. L., , Puri, K., Davidson, N. E., and Tyrell, G. C.: The flow during TOGA COARE as diagnosed by the BMRC tropical analysis and prediction system, Mon. Weather Rev., 123, 717– 736, 1995.
Newell, R. E., Wu, Z.-X., Zhu, Y., Hu, W., Browell, E. V., Gregory, G. L., Sachse, G. W., Collins Jr., J. E., Kelly, K. K., and Liu, S. C.: Vertical fine-scale atmospheric structure measured from NASA DC-8 during PEM-West A, J. Geophys. Res., 101, 1943– 1960, 1996.
Newell, R. E., Thouret, V., Cho, J. Y. N., Stoller, P., Marenco, A., and Smit, H. G.: Ubiquity of quasi-horizontal layers in the tro-posphere, Nature, 398, 316–319, 1999.
Orville, R. E., Zisper, E. J., Brook, M., Weidman, C., Aulich, G., Krider, E. P., Christian, H., Goodman, S., Blakeslee, R., and Cummins, K.: Lightning in the region of the TOGA COARE, Bull. Am. Met. Soc., 78, 1055–1067, 1997.
Petersen, W. A., Rutledge, S. A., and Orville, R. E.: Cloud-to-ground lightning observations from TOGA COARE: Selected re-sults and lightning location algorithms, Mon. Weather Rev., 124, 602–620, 1996.
Phillips, V. T. J. and Donner, L. J.: Cloud microphysics, radiation and vertical velocities in two- and three-dimensional simulations of deep convection, Q. J. R. Meteorol. Soc., 132, 3011–3033, 2006.
Pickering, K. E., Thompson, A. M., Dickerson, R. R., Luke, W. T., McNamara, D. P., Greenberg, J. P., and Zimmerman, P. R.: Model calculations of tropospheric ozone production potential following observed convective events, J. Geophys. Res., 95, 14 049–14 062, 1990.
Pickering, K. E., Thompson, A. M., Tao, W.-K., and Kucsera, T. L.: Upper tropospheric ozone production following mesoscale con-vection during STEP/EMEX, J. Geophys. Res., 98, 8737–8749, 1993.
Pickering, K. E., Thompson, A. M., Wang, Y., Tao, W.-K., Mc-Namara, D. P., Kirchhoff, V. W. J. H., Heikes, B. G., Sachse, G. W., Bradshaw, J. D., Gregory, G. L., and Blake, D. R.: Con-vective transport of biomass burning emissions over Brazil dur-ing TRACE A, J. Geophys. Res., 101, 23 993–24 012, 1996. Pickering, K. E., Wang, Y., Tao, W.-K., Price, C., and M¨uller,
J.-F.: Vertical distributions of lightning NOxfor use in regional and global chemical transport models, J. Geophys. Res., 103, 31 203– 31 216, 1998.
Poulida, O., Dickerson, R. R., and Heymsfield, A.: Stratosphere-troposphere exchange in a midlatitude mesoscale convective complex, J. Geophys. Res., 101, 6823–6836, 1996.
Price, C. and Rind, D.: A simple lightning parameterization for calculating global lightning distributions, J. Geophys. Res., 97, 9919–9933, 1992.
Price, C. and Rind, D.: What determines the cloud-to-ground light-ning fraction in thunderstorms?, Geophys. Res. Lett., 20, 463– 466, 1993.
Price, C., Penner, J., and Prather, M.: NOxfrom lightning: 1. Global distribution based on lightning physics, J. Geophys. Res., 102, 5929–5941, 1997.
Ramanathan, V. R., Dirks, R., Grossman, R., Heymsfield, A., Kuet-tner, J., and Valero, F. P. J.: Central Equatorial Pacific design, Center for Clouds, Chemistry, and Climate, University of Cali-fornia, San Diego, 1993.
Ray, P. S., MacGorman, D. R., Rust, W. D., Taylor W. L., and Wal-ters Rasmussen, L.: Lightning location relative to storm structure in a supercell and a multicell storm, J. Geophys. Res., 92, 5713– 5724, 1987.
Redelsperger, J., Brown, P. R. A., Guichard, F., Hoff, C., Kawasima, M., Lang, S., Montmerle, T., Nakamura, K., Saito, K., Seman, C., Tao, W.-K., and Donner, L. J.: A GCSS model intercompari-son for a tropical squall line observed during TOGA-COARE. I: Cloud-resolving models, Q. J. R. Meteorol. Soc., 26, 823–863, 2000.
Salzmann, M.: Influences of deep convective cloud systems on tropospheric trace gases and photochemistry over the tropical West Pacific: A modeling case study, Ph.D. thesis, Johannes Gutenberg-Universit¨at Mainz, Mainz, Germany, http://nbn-resolving.de/urn/resolver.pl?urn=urn:nbn:de:hebis: 77-9470, 2005.
Salzmann, M., Lawrence, M. G., Phillips, V. T. J., and Donner, L. J.: Modelling tracer transport by a cumulus ensemble: Lat-eral boundary conditions and large-scale ascent, Atmos. Chem. Phys., 4, 1797–1811, 2004,
http://www.atmos-chem-phys.net/4/1797/2004/.
Salzmann, M., Lawrence, M. G., Phillips, V. T. J., and Donner, L. J.: Model sensitivity studies regarding the role of the retention co-efficient for the scavenging and redistribution of highly soluble trace gases by deep convective cloud systems., Atmos. Chem. Phys., 7, 2027–2045, 2007.
Sander, R. and Crutzen, P. J.: Model study indicating halogen ac-tivation and ozone destruction in polluted air masses transported to the sea, J. Geophys. Res., 101, 9121–9138, 1996.
Scala, J. R., Garstang, M., Tao, W.-K., Pickering, K. E., Thomp-son, A. M., SimpThomp-son, J., Kirchhoff, V. W. J. H., Browell, E. V., Sachse, G. W., Torres, A. L., Gregory, G. L., Rasmussen, R. A., and Khalil, M. A. K.: Cloud draft structures and trace gas trans-port, J. Geophys. Res., 95, 17 015–17 030, 1990.
Schumann, U. and Huntrieser, H.: The global lightning-induced ni-trogen oxides source, Atmos. Chem. Phys., 7, 3823–3907, 2007, http://www.atmos-chem-phys.net/7/3823/2007/.
Skamarock, W. C., Klemp, J. B., and Dudhia, J.: Prototypes for the WRF (Weather Research and Forecasting) model, in: Preprints, Ninth Conf. Mesoscale Processes, pp. J11–J15, Amer. Meteor. Soc., Fort Lauderdale, FL, 2001.
Skamarock, W. C., Dye, J. E., Barth, M. C., Stith, J. L., Ridley, B. A., and Baumann, K.: Observational- and modeling-based budget of lightning-produced NOxin a continental thunderstorm, J. Geophys. Res., 108, 4035, doi:10.1029/2002JD002163, 2003. Stenchikov, G., Dickerson, R., Pickering, K., Ellis Jr., W., Dod-dridge, B., Kondragunta, S., Poulida, O., Scala, J., and Tao, W.-K.: Stratosphere-troposphere exchange in a midlatitude mesoscale convective complex, 2. Numerical simulations, J. Geophys. Res., 101, 6837–6851, 1996.
Takemi, T. and Rotunno, R.: The effects of subgrid model mixing and numerical filtering in simulations of mesoscale cloud sys-tems, Mon. Weather Rev., 131, 2085–2191, 2003.
von Kuhlmann, R., Lawrence, M. G., Crutzen, P. J., and Rasch, P. J.: A model for studies of tropospheric ozone and nonmethane hydrocarbons: Model description and ozone results, J. Geophys. Res., 108, doi:10.1029/2002JD002893, 2003.
Walcek, C. J.: Minor flux adjustment near mixing ratio extremes for simplified yet highly accurate monotonic calculation of tracer advection, J. Geophys. Res., 105, 9335–9348, 2000.
Wang, C. and Chang, J. S.: A three-dimensional numerical model of cloud dynamics, microphysics, and chemistry: 3. Redistribution of pollutants, J. Geophys. Res., 98, 16 787–16 798, 1993. Wang, C. and Prinn, R. G.: On the roles of deep convective clouds
in tropospheric chemistry, J. Geophys. Res., 105, 22 269–22 297, 2000.
Wang, C., Crutzen, P. J., Ramanathan, V., and Williams, S. F.: The role of a deep convective storm over the tropical Pacific Ocean in the redistribution of atmospheric chemical species, J. Geophys. Res., 100, 11 509–11 516, 1995.
Webster, P. J. and Lukas, R.: TOGA COARE: The Coupled Ocean-Atmosphere Response Experiment, Bull. Am. Met. Soc., 73, 1377–1416, 1992.
Wild, O.: Modelling the global tropospheric ozone budget: explor-ing the variability in curerent models, Atmos. Chem. Phys., 7, 2643–2660, 2007,
http://www.atmos-chem-phys.net/7/2643/2007/.