ACPD
15, 14733–14781, 2015Advanced source apportionment of trace elements in
London
S. Visser et al.
Title Page
Abstract Introduction
Conclusions References
Tables Figures
◭ ◮
◭ ◮
Back Close
Full Screen / Esc
Printer-friendly Version Interactive Discussion
Discussion
P
a
per
|
Discussion
P
a
per
|
Discussion
P
a
per
|
Discussion
P
a
per
|
Atmos. Chem. Phys. Discuss., 15, 14733–14781, 2015 www.atmos-chem-phys-discuss.net/15/14733/2015/ doi:10.5194/acpd-15-14733-2015
© Author(s) 2015. CC Attribution 3.0 License.
This discussion paper is/has been under review for the journal Atmospheric Chemistry and Physics (ACP). Please refer to the corresponding final paper in ACP if available.
Advanced source apportionment of
size-resolved trace elements at multiple
sites in London during winter
S. Visser1, J. G. Slowik1, M. Furger1, P. Zotter1,*, N. Bukowiecki1, F. Canonaco1, U. Flechsig2, K. Appel3,**, D. C. Green4, A. H. Tremper4, D. E. Young5,***,
P. I. Williams5,6, J. D. Allan5,6, H. Coe5, L. R. Williams7, C. Mohr8,****, L. Xu9, N. L. Ng9,10, E. Nemitz11, J. F. Barlow12, C. H. Halios12, Z. L. Fleming13, U. Baltensperger1, and A. S. H. Prévôt1
1
Laboratory of Atmospheric Chemistry, Paul Scherrer Institute, Villigen, Switzerland
2
Swiss Light Source, Paul Scherrer Institute, Villigen, Switzerland
3
HASYLAB, DESY Photon Science, Hamburg, Germany
4
Analytical and Environmental Sciences, King’s College London, London, UK
5
School of Earth, Atmospheric and Environmental Sciences, University of Manchester, Manchester, UK
6
National Centre for Atmospheric Science, University of Manchester, Manchester, UK
7
Aerodyne Research, Inc., Billerica, MA, USA
8
ACPD
15, 14733–14781, 2015Advanced source apportionment of trace elements in
London
S. Visser et al.
Title Page
Abstract Introduction
Conclusions References
Tables Figures
◭ ◮
◭ ◮
Back Close
Full Screen / Esc
Printer-friendly Version Interactive Discussion
Discussion
P
a
per
|
Discussion
P
a
per
|
Discussion
P
a
per
|
Discussion
P
a
per
|
9
School of Chemical and Biomolecular Engineering, Georgia Institute of Technology, Atlanta, GA, USA
10
School of Earth and Atmospheric Sciences, Georgia Institute of Technology, Atlanta, GA, USA
11
Centre for Ecology and Hydrology, Penicuik, Midlothian, Scotland
12
Department of Meteorology, University of Reading, Reading, UK
13
National Centre for Atmospheric Science, Department of Chemistry, University of Leicester, Leicester, UK
*
now at: Lucerne School of Engineering and Architecture, Bioenergy Research, Lucerne University of Applied Sciences and Arts, Horw, Switzerland
**
now at: European XFEL, Hamburg, Germany
***
now at: Department of Environmental Toxicology, University of California, Davis, CA, USA
****
now at: Institute of Meteorology and Climate Research, Karlsruhe Institute of Technology, Karlsruhe, Germany
Received: 2 March 2015 – Accepted: 4 May 2015 – Published: 26 May 2015
Correspondence to: J. G. Slowik ([email protected])
ACPD
15, 14733–14781, 2015Advanced source apportionment of trace elements in
London
S. Visser et al.
Title Page
Abstract Introduction
Conclusions References
Tables Figures
◭ ◮
◭ ◮
Back Close
Full Screen / Esc
Printer-friendly Version Interactive Discussion
Discussion
P
a
per
|
Discussion
P
a
per
|
Discussion
P
a
per
|
Discussion
P
a
per
|
Abstract
Trace element measurements in PM10−2.5, PM2.5−1.0 and PM1.0−0.3aerosol were
per-formed with 2 h time resolution at kerbside, urban background and rural sites during the ClearfLo winter 2012 campaign in London. The environment-dependent variability of emissions was characterized using the Multilinear Engine implementation of the
Pos-5
itive Matrix Factorization model, conducted on datasets comprising all three sites but segregated by size. Combining the sites enabled separation of sources with high tem-poral covariance but significant spatial variability. Separation of sizes improved source resolution by preventing sources occurring in only a single size fraction from having too small a contribution for the model to resolve. Anchor profiles were retrieved
inter-10
nally by analysing data subsets, and these profiles were used in the analyses of the complete datasets of all sites for enhanced source apportionment.
A total of nine different factors was resolved (notable elements in brackets): in PM10−2.5brake wear (Cu, Zr, Sb, Ba), other traffic-related (Fe), resuspended dust (Si,
Ca), sea/road salt (Cl), aged sea salt (Na, Mg) and industrial (Cr, Ni); in PM2.5−1.0
15
brake wear, other traffic-related, resuspended dust, sea/road salt, aged sea salt and S-rich (S); and in PM1.0−0.3 traffic-related (Fe, Cu, Zr, Sb, Ba), resuspended dust,
sea/road salt, aged sea salt, reacted Cl (Cl), S-rich and solid fuel (K, Pb). Human activities enhance the kerb-to-rural concentration gradients of coarse aged sea salt, typically considered to have a natural source, by 1.7–2.2. These site-dependent
con-20
centration differences reflect the effect of local resuspension processes in London. The anthropogenically-influenced factors traffic (brake wear and other traffic-related pro-cesses), dust and sea/road salt provide further kerb-to-rural concentration enhance-ments by direct source emissions by a factor of 3.5–12.7. The traffic and dust factors are mainly emitted in PM10−2.5and show strong diurnal variations with concentrations
25
resus-ACPD
15, 14733–14781, 2015Advanced source apportionment of trace elements in
London
S. Visser et al.
Title Page
Abstract Introduction
Conclusions References
Tables Figures
◭ ◮
◭ ◮
Back Close
Full Screen / Esc
Printer-friendly Version Interactive Discussion
Discussion
P
a
per
|
Discussion
P
a
per
|
Discussion
P
a
per
|
Discussion
P
a
per
|
pension influences, and concentrations are similar throughout the day and across the regions.
1 Introduction
Acute and chronic exposure to trace elements in ambient aerosols induces adverse respiratory and cardiovascular health effects (WHO, 2013). Brunekreef and Forsberg
5
(2005) and Neuberger et al. (2004) reveal different mortality and morbidity effects for exposure to individual particle size fractions such as PM10−2.5, PM2.5−1.0 and PM1.0
(particulate matter with an aerodynamic diameterd of 10 to 2.5, 2.5 to 1.0 and smaller than 1.0 µm, respectively). These particles are emitted into the atmosphere by different sources.
10
The major source of PM in most urban areas is road traffic, comprising exhaust and non-exhaust (abrasion and resuspension) contributions (Denier van der Gon et al., 2013; Pant and Harrison, 2013). Other sources include industrial activities, fossil fuel use and biomass burning for heating and energy production, crustal material, sea salt, and cooking as well as contributions of secondary inorganic and organic aerosols
15
(EEA, 2010; Viana et al., 2008; Zhang et al., 2011). Source apportionment by Posi-tive Matrix Factorization (PMF; Paatero and Tapper, 1994) is a powerful tool to quantify sources based on trace element measurements. Many studies have applied PMF on either elements alone or in combination with other species, such as carbon species and inorganic ions (Amato et al., 2013; Gu et al., 2011; Hammond et al., 2008; Vedal
20
et al., 2009; Yang et al., 2013; Zhang et al., 2013). However, such measurements are typically performed only for a single size fraction and with 24 h time resolution, pre-venting the study of diurnal behaviours of emission sources and short-term changes in air pollution exposure levels. Anthropogenic sources such as traffic (Fe, Cu, Zn, Ba), resuspension (Al, Si, Ca) and biomass burning for home heating (S, K) typically show
25
ACPD
15, 14733–14781, 2015Advanced source apportionment of trace elements in
London
S. Visser et al.
Title Page
Abstract Introduction
Conclusions References
Tables Figures
◭ ◮
◭ ◮
Back Close
Full Screen / Esc
Printer-friendly Version Interactive Discussion
Discussion
P
a
per
|
Discussion
P
a
per
|
Discussion
P
a
per
|
Discussion
P
a
per
|
et al., 2010; Dall’Osto et al., 2013; Viana et al., 2013). Elements in different size frac-tions typically serve as markers for different sources. S from secondary sulphate for example is mainly found in PM1.0, whereas PM10−1.0 S can indicate sea salt and/or
mineral sulphate (Mazzei et al., 2007). PM1.0 K mostly originates from wood burning, but is attributed to dust in PM10−1.0 (Viana et al., 2008). It is vital to understand the
5
extent to which emission sources affect air quality, especially in urban areas, where the global population has increased from 34 % (in 1960) to 56 % (in 2014) and is expected to grow further (WHO, 2014).
Only a limited number of studies have applied PMF to explore trace element emission sources across multiple sites or size fractions, or with high time resolution (Bukowiecki
10
et al., 2010; Clements et al., 2014; Dall’Osto et al., 2013; Minguillón et al., 2014; Taiwo et al., 2014). Karanasiou et al. (2009) showed a higher degree of source separation by applying PMF on combined PM10and PM2than on PM10 data alone, due to lack of
variability in the sum of PM10 and PM2concentrations of certain key tracers. The Mul-tilinear Engine solver (ME-2, Paatero, 1999) improves on conventional PMF analyses
15
by allowing complete and efficient exploration of the solution space, facilitating source separation. Amato et al. (2009a) and Sturtz et al. (2014) used ME-2 to achieve im-proved source separation by requiring the solution to be consistent with local emission profiles and providing environmentally reasonable element ratios within factor profiles. Some caution is needed by combining sites in PMF, because one needs to assume
20
that the chemical profiles of the resolved sources do not vary significantly between the sites. This prerequisite is usually valid if the sites are only a few kilometres apart (Dall’Osto et al., 2013).
PM10 concentrations in London frequently exceed the legal daily limit. These
ex-ceedances are caused by local and regional emission sources in combination with
25
ACPD
15, 14733–14781, 2015Advanced source apportionment of trace elements in
London
S. Visser et al.
Title Page
Abstract Introduction
Conclusions References
Tables Figures
◭ ◮
◭ ◮
Back Close
Full Screen / Esc
Printer-friendly Version Interactive Discussion
Discussion
P
a
per
|
Discussion
P
a
per
|
Discussion
P
a
per
|
Discussion
P
a
per
|
of size-resolved trace elements measured simultaneously at three sites. We apply the ME-2 implementation of the PMF model to 2 h element concentrations measured at two urban sites in London (Marylebone Road, North Kensington) and one rural site southeast of London (Detling), United Kingdom (UK), during the ClearfLo (Clean Air for London) field campaign (Bohnenstengel et al., 2014). PMF analysis is conducted
5
on datasets comprising all three sites but analysed separately for each size (PM10−2.5,
PM2.5−1.0and PM1.0−0.3). We demonstrate that rotational control of the solutions using
anchor profiles in ME-2 is essential for a successful source apportionment. This ap-proach results in enhanced source separation compared to using unconstrained PMF. We investigate the size-dependence of sources such as traffic, resuspended dust, and
10
sea salt, and also identify sources unique to particular size fractions.
2 Methods
2.1 Measurement sites and instrumentation
Measurements were conducted as part of the ClearfLo project (http://www.clearflo.ac. uk/), a multinational collaboration to investigate the processes driving air quality in and
15
around London (Bohnenstengel et al., 2014). This study focuses on the winter inten-sive observation period (IOP), which took place from 6 January to 11 February 2012. Trace element measurements were conducted at kerbside, urban background and ru-ral sites, at or near permanent air quality measurement stations of the Automatic Ur-ban and Rural Network (AURN) or Kent and Medway Air Quality Monitoring Network
20
(see Supplement Fig. S1). The kerbside site was located at Marylebone Road (MR, lat 51◦31′21′′N, lon 0◦09′17′′W) at the southern side of a street canyon (Charron and Harrison, 2005). Measurements were performed at 1 m from a six-lane road with a traf-fic flow of∼73 000 vehicles per day (15 % heavy duty vehicles; traffic counts by vehicle
group from road sensors (number of vehicles per 15 min)). A signal-controlled junction
25
ACPD
15, 14733–14781, 2015Advanced source apportionment of trace elements in
London
S. Visser et al.
Title Page
Abstract Introduction
Conclusions References
Tables Figures
◭ ◮
◭ ◮
Back Close
Full Screen / Esc
Printer-friendly Version Interactive Discussion
Discussion
P
a
per
|
Discussion
P
a
per
|
Discussion
P
a
per
|
Discussion
P
a
per
|
resulted in frequent braking and stationary vehicle queues in front of the site. The urban background site, the main sampling site during ClearfLo, was located at the grounds of the Sion Manning Secondary School in North Kensington (NK, lat 51◦31′21′′N, lon 0◦12′49′′W). Although in a heavily trafficked suburban area about 4.1 km west of MR, measurements took place away from main roads and this site is representative of the
5
urban background air quality in London (Bigi and Harrison, 2010). The rural site was sit-uated at approximately 45 km to the southeast of downtown London at the Kent Show-grounds at Detling (DE, lat 51◦18′07′′N, lon 0◦35′22′′E) on a plateau at 200 m a.s.l. surrounded by fields and villages (Mohr et al., 2013). A busy road with a traffic flow of
∼42 000 vehicles per day (Department for Transport, 2014) is located approximately
10
150 m south of the site.
Aerosols were sampled by rotating drum impactors (RDIs) with 2 h time resolu-tion and a flow rate of 1 m3h−1, and were segregated by size into PM10−2.5 (coarse),
PM2.5−1.0 (intermediate) and PM1.0−0.3 (fine) fractions. Trace element composition of
the RDI samples was determined by synchrotron radiation-induced X-ray fluorescence
15
spectrometry (SR-XRF) at the X05DA beamline (Flechsig et al., 2009) at the Swiss Light Source (SLS) at Paul Scherrer Institute (PSI), Villigen PSI, Switzerland, and at Beamline L at Hamburger Synchrotronstrahlungslabor (HASYLAB) at Deutsches Elektronen-Synchrotron (DESY), Hamburg, Germany (beamline dismantled November 2012). In total 25 elements were quantified (Na, Mg, Al, Si, P, S, Cl, K, Ca, Ti, V, Cr, Mn,
20
Fe, Ni, Cu, Zn, Br, Sr, Zr, Mo, Sn, Sb, Ba, Pb). Details of the RDI-SR-XRF analysis are described in Visser et al. (2015) and in previous application examples in Bukowiecki et al. (2010) and Richard et al. (2011).
Additional measurements discussed in this paper are briefly described here. Aerosol mass spectrometers (Aerodyne Research, Inc., Billerica, MA, USA) were deployed at
25
ACPD
15, 14733–14781, 2015Advanced source apportionment of trace elements in
London
S. Visser et al.
Title Page
Abstract Introduction
Conclusions References
Tables Figures
◭ ◮
◭ ◮
Back Close
Full Screen / Esc
Printer-friendly Version Interactive Discussion
Discussion
P
a
per
|
Discussion
P
a
per
|
Discussion
P
a
per
|
Discussion
P
a
per
|
Particle light absorption was derived with seven-wavelength Aethalometers (λ=370– 950 nm, model AE 31, Magee Scientific; 5 min resolution) at NK (3.5 µm cyclone) and DE (2.5 µm cyclone). The measured absorption was apportioned to traffic and wood burning based on the absorption coefficients at λ=470 and 950 nm, assuming ab-sorption exponents of 1 and 2 for traffic and wood burning emissions, respectively
5
(Crilley et al., 2014; Mohr et al., 2013; Sandradewi et al., 2008). At MR and NK, NOx measurements were performed with NOxchemiluminescent analysers (API, A Series, model M200A; 15 min resolution). At DE, NO (Thermo Scientific 42i analyser) and NO2
(Aerodyne CAPS-NO2and QCL-76-D) data were collected, and summed to obtain
to-tal NOx concentrations (1 min resolution). Wind direction and wind speed data for the
10
two city sites were taken from the nearby BT Tower, where sonic anemometers (20 Hz) were placed at the top of an open lattice scaffolding tower of 18 m height on top of the main structure (190.8 m a.g.l., lat 51◦31′17′′N, lon 0◦08′19′′W, 30 min resolution; Wood et al., 2010), while local data were used at DE. Relative humidity (RH) data at NK were derived with a Vaisala WXT sensor (5 min resolution). Finally, the UK Met Office’s
Nu-15
merical Atmospheric Modelling Environment (NAME) dispersion model (Jones et al., 2007) provided back trajectory simulations for analysis of air mass origins (Bohnen-stengel et al., 2014).
2.2 Positive Matrix Factorization
PMF is a powerful source apportionment method to describe measurements, using the
20
bilinear factor model (Paatero and Tapper, 1994):
xi j=
p
X
k=1
gi kfkj+ei j (1)
wherexi j is thejth species concentration measured in theith sample,gi k is the con-tribution of the kth source to the ith sample (factor time series) and fkj is the con-centration of thejth species in the kth source (factor profiles). The part of the data
ACPD
15, 14733–14781, 2015Advanced source apportionment of trace elements in
London
S. Visser et al.
Title Page
Abstract Introduction
Conclusions References
Tables Figures
◭ ◮
◭ ◮
Back Close
Full Screen / Esc
Printer-friendly Version Interactive Discussion
Discussion
P
a
per
|
Discussion
P
a
per
|
Discussion
P
a
per
|
Discussion
P
a
per
|
remaining unexplained by the model is represented by the residual matrixei j. The en-tries ofgi k andfkj (required to be non-negative) are fit using a least squares algorithm that iteratively minimizes the objective functionQ:
Q=
n
X
i=1
m
X
j=1
e
i j
σi j
2
(2)
whereσi j are the measurement uncertainties.
5
The PMF model solution is subject to rotational ambiguity; that is, different solutions may be found having similar values ofQ(Paatero et al., 2002). This ambiguity can be reduced within the ME-2 algorithm by adding a priori information into the PMF model (e.g. source profiles) to reduce the available rotational space and direct the solution towards a unique, optimized and environmentally meaningful solution.
10
In this study, trace element source apportionment is performed using the ME-2 imple-mentation of PMF (Paatero, 1999), with configuration and analysis in the SoFi (Source Finder) toolkit (Canonaco et al., 2013) for the IGOR Pro software environment (Wave-metrics, Inc., Portland, OR, USA). The ME-2 solver executes the PMF algorithm similar to the PMF solver (Paatero and Tapper, 1994), but has the advantage that the full
rota-15
tional space is accessible. One way to efficiently explore this space is with theavalue approach. Here one or more factor profiles are constrained by the scalara, which de-fines how much the resolved factors are allowed to deviate from the input “anchor” profiles, according to:
fj,solution=fj±a×fj (3)
20
whereacan be set between 0 and 1. If, for example,a=0.1, all elements in the profile are allowed to vary within±10 % of the input factor profile. For clarity, we here use the term “ME-2” to refer to solving the PMF model with the ME-2 solver using theavalue approach, whereas the term “unconstrained ME-2” refers to solving the PMF model using the ME-2 solver but without a priori constraints on the solution.
ACPD
15, 14733–14781, 2015Advanced source apportionment of trace elements in
London
S. Visser et al.
Title Page
Abstract Introduction
Conclusions References
Tables Figures
◭ ◮
◭ ◮
Back Close
Full Screen / Esc
Printer-friendly Version Interactive Discussion
Discussion
P
a
per
|
Discussion
P
a
per
|
Discussion
P
a
per
|
Discussion
P
a
per
|
These algorithms require both a data matrix (xi j, 25 elements measured with 2 h time
resolution) and a corresponding uncertainty matrix (σi j). Uncertainties that uniformly
affect an entire row or column of the data matrix (e.g. RDI flow rate, absolute or relative calibration) do not alter the PMF solution and are thus not considered in constructing the uncertainty matrix. Uncertainties are calculated according to Eq. (4), and account
5
for the detector counting efficiency (σDet,i j) and the energy calibration of an X-ray line
as function of detector channel (σEC,i j):
σi j=
q
σDet,i j2+σEC,i j2 (4)
TheσDet,i j depend on the efficiency with which one photon is counted by the detector
and is defined as the square root of the signal. TheσEC,i j were estimated at 0.01 keV
10
for SLS spectra (representing∼2 channels) and 0.02 keV for HASYLAB spectra
(repre-senting∼1 channel). Gaussian probability distributions representing energy calibration biases (i.e. keV or energy offsets) are constructed using the above values as the stan-dard deviation (SD). From these distributions, e.g. 20 offsets are selected such that the perturbations are uniformly sampled according to probability, and the XRF spectra
15
are refitted. The σEC,i j are defined as the SD of the refitted spectra across these 20
iterations. Entries inxi j with a signal-to-noise ratio (SNR) below 2 are downweighted
by replacing the correspondingσi j with 2/SNRi j. This approach, as opposed to
down-weighting an entire variable (i.e. increasing the uncertainty associated with an entire column rather than a single point; Paatero and Hopke, 2003), allows variables with low
20
average SNR but high SNR periods to remain in the data matrix, as these peaks might contain valuable information regarding sources (e.g. sources systematically sampled from particular wind vectors).
Missing values in one or several entries in xi (e.g. a line fit failure of one or more
elements) are set to zero and the corresponding error is set to 109. Missing data points
25
ACPD
15, 14733–14781, 2015Advanced source apportionment of trace elements in
London
S. Visser et al.
Title Page
Abstract Introduction
Conclusions References
Tables Figures
◭ ◮
◭ ◮
Back Close
Full Screen / Esc
Printer-friendly Version Interactive Discussion
Discussion
P
a
per
|
Discussion
P
a
per
|
Discussion
P
a
per
|
Discussion
P
a
per
|
2.3 Selection of ME-2 solutions
The multi-size, multi-site nature of this dataset allowed for several methods of con-structing the input dataset for ME-2 (i.e. single size×single site; single size×multiple sites; multiple sizes×single site; multiple sizes×multiple sites). Although all
com-binations were investigated, the analysis herein focuses primarily on the single
5
size×multiple sites option. That is, we investigated three datasets, with each contain-ing a scontain-ingle size (PM10−2.5, PM2.5−1.0or PM1.0−0.3fraction) and data from all three
mea-surement sites (MR, NK and DE). Combining the sites enabled separation of sources with high temporal covariance but significant spatial variability. Separation of sizes im-proved source resolution by preventing sources occurring in only a single size fraction
10
from having too small a contribution toQfor the model to resolve. Sources occurring only at one site were resolved, as discussed below.
ME-2 solutions were evaluated using a number of mathematical and physical crite-ria. The two major aspects of the analysis are (1) selection of the optimum number of factors; and (2) evaluation of whether this solution is acceptable as a final solution or
15
requires additional/modified rotational control. The primary criteria used for this evalu-ation are:
Mathematical
– Investigation of the decrease inQ/Qexp(Qexp=Qexpectedor the number of remain-ing degrees of freedom of the system) with increasremain-ingp(number of factors) due
20
to the increased degrees of freedom in the model (Paatero and Tapper, 1993). A large decrease indicates significantly increased explanation of the data, while a small decrease suggests that additional factors are not providing new informa-tion and a smallerpis sufficient.
– The elementei j/σi j(scaled residuals) are approximately normally distributed
be-25
tween approximately ±3 (Paatero and Hopke, 2003) and show comparable
ACPD
15, 14733–14781, 2015Advanced source apportionment of trace elements in
London
S. Visser et al.
Title Page
Abstract Introduction
Conclusions References
Tables Figures
◭ ◮
◭ ◮
Back Close
Full Screen / Esc
Printer-friendly Version Interactive Discussion
Discussion
P
a
per
|
Discussion
P
a
per
|
Discussion
P
a
per
|
Discussion
P
a
per
|
Physical
– Attribution of elements to sources and element-to-element ratios within a source are consistent with existing measurements.
– Sources retrieved in several size fractions show reasonable consistent attribution of elements with co-varying time series.
5
– Sources show meaningful diurnal variations and concentration gradients from kerbside to urban background to rural sites (local: strong variations and large gradients; regional: flat diurnal patterns and minimal gradients).
– Correlations of factor time series with external tracers (e.g. traffic with NOx) are logical.
10
The goal of the present analysis is to conduct ME-2 analyses (unconstrained or con-strained) that meet the criteria outlined above for each of the three size fractions on the combined data from all three sites. However, for all size fractions, unconstrained ME-2 (i.e. uncontrolled rotations or conventional PMF) yielded factors containing sig-natures of multiple emission sources (e.g. mixed brake wear and other traffic-related
15
processes, or mixed S-rich and solid fuel) and were therefore considered non-optimal solutions (Supplement Figs. S2–S5). Therefore, we applied rotational controls, using theavalue approach (Eq. 3). A central challenge of this approach is the construction of appropriate anchor profiles, which cannot be drawn directly from the literature, be-cause the attribution of elements to sources and the element-to-element ratios within
20
a source are not consistent across different studies (e.g. Viana et al., 2008). Therefore, to find clean model rotations, anchor profiles were determined within the ME-2 analysis as described below.
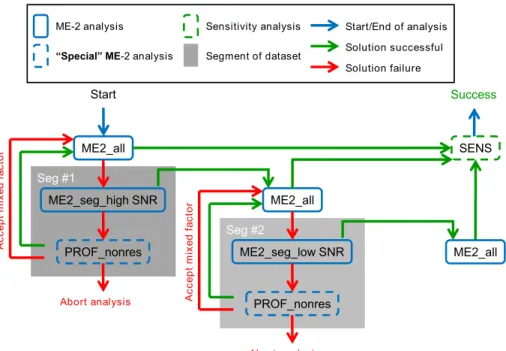
In brief, this analysis strategy (outlined in Fig. 1, and illustrated for the current study in Supplement Fig. S6) involves the construction of a basis set of source profiles by
25
ACPD
15, 14733–14781, 2015Advanced source apportionment of trace elements in
London
S. Visser et al.
Title Page
Abstract Introduction
Conclusions References
Tables Figures
◭ ◮
◭ ◮
Back Close
Full Screen / Esc
Printer-friendly Version Interactive Discussion
Discussion
P
a
per
|
Discussion
P
a
per
|
Discussion
P
a
per
|
Discussion
P
a
per
|
full dataset using the existing basis set as anchors to determine whether the existing basis set is sufficient or additional anchor profiles are needed. Finally, sensitivity tests are used to assess the uncertainties associated with the final solution. Implementa-tion of this analysis strategy requires four types of ME-2 analyses, denoted ME2_all, ME2_seg, PROF_nonres, and SENS, which are discussed in detail below.
5
ME2_all refers to the analysis of the entire dataset (i.e. all time points). The initial ME2_all analysis in Fig. 1 is an unconstrained analysis and is primarily used to identify time segments that may be useful for resolving anchor profiles of specific factors. All subsequent ME2_all analyses utilize the profile basis set built up in previous steps. An ME2_all analysis is defined as successful only when the entire dataset is well explained
10
according to the criteria given above.
ME2_seg denotes analysis of a subset (time segment) of the full dataset. The time segment need not be a single continuous block, and can be constructed e.g. from separate periods in which a particular source is evident. ME2_seg analyses utilize the basis set built up in previous steps and are considered successful if the entire time
seg-15
ment is well explained according to the above criteria. In the present analysis, it was useful to define segments in terms of sampling site, with (high signal-to-noise) MR and NK sites in segment #1 and (low signal-to-noise) DE in segment #2. Different division strategies may be optimal for different datasets, e.g. size fraction, air mass origin, or wind direction. However, it is important that the entire dataset be well-investigated,
ei-20
ther by ensuring that the set of all ME2_seg segments encompasses the entire dataset or by careful inspection of the residuals in ME2_all. In the present dataset, ME2_all residuals indicated the presence of an industrial factor at DE, but this factor could only be retrieved in unmixed form by ME2_seg analysis of DE using the basis set devel-oped through ME2_seg of MR and NK. To maximize the adaptation of the basis set to
25
ACPD
15, 14733–14781, 2015Advanced source apportionment of trace elements in
London
S. Visser et al.
Title Page
Abstract Introduction
Conclusions References
Tables Figures
◭ ◮
◭ ◮
Back Close
Full Screen / Esc
Printer-friendly Version Interactive Discussion
Discussion
P
a
per
|
Discussion
P
a
per
|
Discussion
P
a
per
|
Discussion
P
a
per
|
PROF_nonres addresses factors whose presence is indicated in the solution but that cannot be cleanly resolved by ME2_seg and is therefore focused on the genera-tion of an appropriate anchor profile for a specific source. Thus, while PROF_nonres may employ similar analytical strategies to ME2_seg (e.g. ME-2 analysis of a selected time segment), we are concerned with the resolution of a particular factor and not with
5
the unmixing of the entire dataset, and success/failure in Fig. 1 is defined accordingly. For example, in the present study, an anchor for the PM10−2.5brake wear factor was
re-solved by analyzing NK data using an excessive number of factors. While the non-brake wear factors in this solution exhibited substantial mixing and/or non-physical splitting, the factor of interest (brake wear) yielded an internally consistent profile and time
se-10
ries (element contributions consistent with literature, strong correlation with NOx, low unexplained variation in the solution). For such a successful PROF_nonres analysis, only the factor of interest (brake wear) is added to the basis set. Other PROF_nonres methods could include (1) an average profile over periods where the source of interest dominates the total signal or (2) estimation from the literature.
15
SENS investigates the uncertainties in the ME-2 solution associated with the final ba-sis set (fully constrained ME2_all). The robustness or uncertainty is investigated with anchor sensitivity analyses for each size fraction separately (three sites combined per size). Random profiles are generated over 10 000 runs by varying the relative intensity offkj with an anchor of±20 % of the final model solutions. This allowed a systematic
20
exploration of a large area of the solution space around the final solutions. Physically and mathematically meaningful solutions were selected according to the source profile constraints given in Table 1. In the coarse fraction, 26 % of the runs were classified as good solutions, while 40 and 64 % are good in intermediate and fine fractions. Factor profile and time series uncertainties are defined as one SD of the good solutions (note
25
ACPD
15, 14733–14781, 2015Advanced source apportionment of trace elements in
London
S. Visser et al.
Title Page
Abstract Introduction
Conclusions References
Tables Figures
◭ ◮
◭ ◮
Back Close
Full Screen / Esc
Printer-friendly Version Interactive Discussion
Discussion
P
a
per
|
Discussion
P
a
per
|
Discussion
P
a
per
|
Discussion
P
a
per
|
runs. This indicates that the rotational model uncertainties are rather driven by the cri-teria in Table 1, than by how much the profiles are allowed to vary. In other words, the percent of accepted solutions reflects computational efficiency rather than the ro-bustness of the base solution. The brake wear profile constraint ensures a clean factor without mixing of elements related to other traffic processes or resuspended dust that
5
occurs due to the dominant contribution of MR toQ with its high temporal covariance of most elements. The constraints based on literature values guarantee solutions that have environmentally meaningful attributions of elements to sources and element-to-element ratios within a source.
3 Results and discussion
10
3.1 ME-2 source apportionment
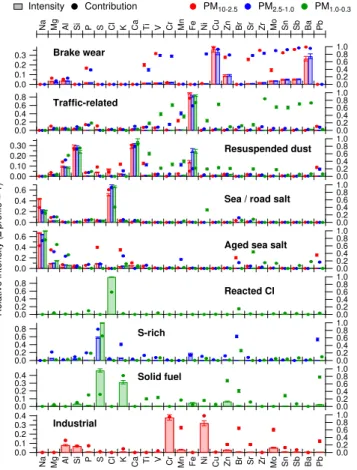
The ME-2 analysis on the three datasets resulted in a total of nine source profiles as shown in Fig. 2 (values in Supplement Tables S1–3), with the factor time series for each site in Supplement Figs. S7–9 (PM10−2.5, PM2.5−1.0 and PM1.0−0.3, respectively). The
coarse fraction yielded the source factors (notable elements in brackets) brake wear
15
(Cu, Zr, Sb, Ba), other traffic-related (Fe), resuspended dust (Si, Ca), sea/road salt (Cl), aged sea salt (Na, Mg) and industrial (Cr, Ni). The intermediate fraction yielded the same factors, except the industrial, and instead an S-rich (S) factor. In the fine frac-tion a traffic-related (Fe, Cu, Zr, Sb, Ba) factor was found as well as resuspended dust, sea/road salt, aged sea salt, reacted Cl (Cl), S-rich and solid fuel (K, Pb). The other
20
elements (Al, P, Ti, V, Mn, Zn, Br, Sr, Mo, Sn) are not uniquely emitted by a particu-lar emission source and are attributed to several factors. It should be noted that the concentrations for the factor time series reported below reflect only the elements mea-sured by SR-XRF analysis and not the other constituents associated with the various source types. In particular the lighter elements (H, C, N, O) are not included and may
25
contribu-ACPD
15, 14733–14781, 2015Advanced source apportionment of trace elements in
London
S. Visser et al.
Title Page
Abstract Introduction
Conclusions References
Tables Figures
◭ ◮
◭ ◮
Back Close
Full Screen / Esc
Printer-friendly Version Interactive Discussion
Discussion
P
a
per
|
Discussion
P
a
per
|
Discussion
P
a
per
|
Discussion
P
a
per
|
tion to the factors discussed herein are also relative to the measured elemental mass resolved.
3.1.1 Brake wear and other traffic-related
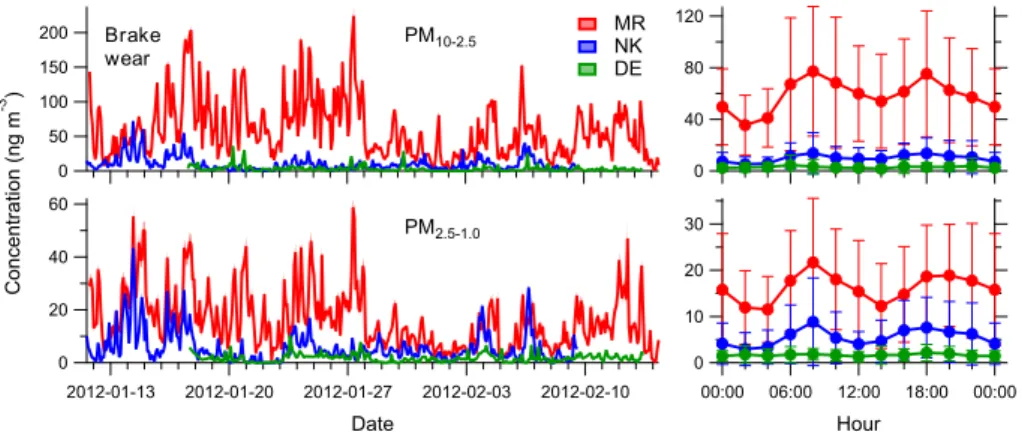
Factors related to brake wear were resolved in PM10−2.5 and PM2.5−1.0 size fractions;
the profiles are shown in Fig. 2, with time series and diurnal variations in Fig. 3. The
5
relative contribution to this factor is more than 70 % for V, Cu, Zn, Zr, Sn, Sb and Ba in both size fractions, and more than 70 % for Cr, Ni, Sr and Mo in PM2.5−1.0. Zn can be
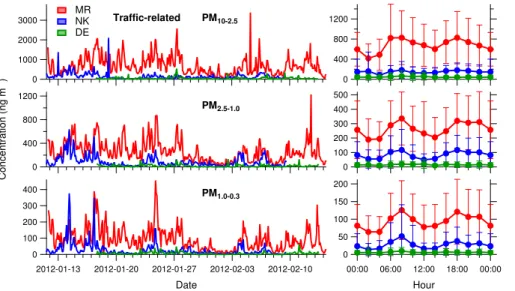
emitted both from brake and tyre wear, indicating that these factors might be a mixture of various wearing processes (Pant and Harrison, 2013). Factors for other traffic-related emissions in these two size fractions (Figs. 2 and 4) are dominated by Fe, with around
10
86 % of the mass explained by this element. The fine fraction analysis retrieved one traffic factor with a mixture of brake wear and other traffic-related emissions with 84 % of the mass explained by Fe (relative contributions more than 70 % for Fe, Cu, Zr, Sb and Ba). This mixed factor is similar to that reported by Amato et al. (2009b, 2013) and Bukowiecki et al. (2010) although the ratio of Fe to other elements is variable
15
between studies. V and Sr are typically not attributed to traffic factors, but rather to industrial or oil combustion emissions (V) and dust resuspension (Sr) (Minguillón et al., 2014; Moreno et al., 2011). However, both elements are found in trace amounts in fuel additives and brake lining, and Handler et al. (2008) have shown enhanced Sr and V concentrations inside a tunnel compared with ambient concentrations outside. In the
20
absence of other sources, the relative contribution of these elements might dominate these traffic factors.
For the brake wear and the PM1.0−0.3traffic factors, the Cu/Sb ratios of 6.3–7.1 fall
within the range of 5.7–8.2 for previous measurements at MR and NK by Harrison et al. (2012b) and depend on brake pad compositions and contributions of metals from other
25
ACPD
15, 14733–14781, 2015Advanced source apportionment of trace elements in
London
S. Visser et al.
Title Page
Abstract Introduction
Conclusions References
Tables Figures
◭ ◮
◭ ◮
Back Close
Full Screen / Esc
Printer-friendly Version Interactive Discussion
Discussion
P
a
per
|
Discussion
P
a
per
|
Discussion
P
a
per
|
Discussion
P
a
per
|
All the traffic-related factors are strongly influenced by local traffic emissions with steep MR to NK to DE concentration gradients (Figs. 3–4). Concentrations at MR are 3.6–6.8 and 9.9–28 times higher than at NK and DE, respectively. The diurnal variations show a double maximum during the day corresponding to rush hours. Most of the mass is emitted in the coarse fraction with concentrations at MR being 2.6–3.6 and 7.5
5
times higher than in PM2.5−1.0 and PM1.0−0.3, respectively. The time series correlate
well across sizes (Pearson’sR 0.67–0.81), indicating similar emission processes. Both traffic sources are well correlated with NOx across sites and sizes (Pearson’sR 0.53–
0.72) as shown in Fig. 5 for MR (NK and DE in Supplement Fig. S10). Figure 5 also shows traffic flows at MR of light and heavy duty vehicles (veh. <5.2 m long, LDV;
10
veh.>5.2 m long, HDV). The diurnal variations are much stronger for NOx and HDV than for the traffic factors and LDV. The ratios between values at 08:00 and 02:00 UTC are about 4.1 for the former and 2.0 for the latter, probably caused by more strongly enhanced emissions between HDV and LDV for NOx (factor of∼37) relative to brake
wear (factor of∼10), as identified by Bukowiecki et al. (2010). NOx seems therefore
15
more directly related to HDV numbers, while the traffic factors are more influenced by total vehicle number.
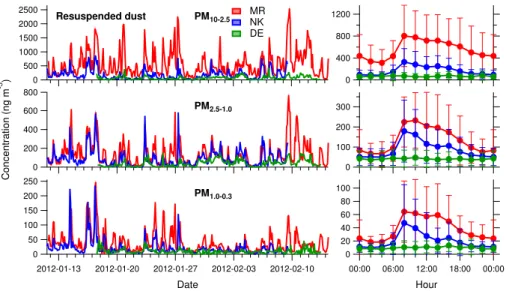
3.1.2 Resuspended dust
Resuspended dust factors were resolved in all size fractions; the profiles are shown in Fig. 2, with time series and diurnal variations in Fig. 6. The source profiles are
20
very similar across sizes and the mass is dominated by Si, Ca and Fe, consistent with the upper continental crust composition (Rudnick and Gao, 2003) and previous source apportionment studies (Amato et al., 2009a; Dall’Osto et al., 2013; Richard et al., 2011).
The scaled residuals (ei j/σi j) ratios exceed±3 for Na, Si and Ca (coarse), Na, Al,
25
ACPD
15, 14733–14781, 2015Advanced source apportionment of trace elements in
London
S. Visser et al.
Title Page
Abstract Introduction
Conclusions References
Tables Figures
◭ ◮
◭ ◮
Back Close
Full Screen / Esc
Printer-friendly Version Interactive Discussion
Discussion
P
a
per
|
Discussion
P
a
per
|
Discussion
P
a
per
|
Discussion
P
a
per
|
This is potentially caused by varying dust compositions or emission processes, with resuspension in the city dominated by road dust influenced by anthropogenic activi-ties in contrast to influences from natural soils at DE. This is in line with Sturtz et al. (2014) where city-specific soil profiles are constrained in the ME-2 analysis on data of combined cities, and with Amato et al. (2009a) where ME-2 yielded a road dust
resus-5
pension distinct from a mineral dust factor. In the current study, increasingp yielded factors with high relative intensities of Ca and of Al and Si. However,Q/Qexpand
struc-tures inei j/σi j remain unaffected, indicating that temporal co-variance and emission
source strengths of these elements are too similar across sites for the model to retrieve more than one dust factor.
10
Similar to the factor termed “traffic-related”, dust is mainly emitted in PM10−2.5with up
to 13.6 times higher concentrations than in the smaller fractions. The factor time series (Fig. 6) indicate enrichment at MR relative to NK and DE, especially for the coarse frac-tion (MR/NK ratio of 3.4 and MR/DE of 7.8) and are well correlated among all sizes (Pearson’sR 0.62–0.78). The diurnal variations show strong daytime maxima, most
15
likely from anthropogenic activities (mainly traffic) throughout the day. The increase at 08:00 UTC (sampling 08:00–10:00 UTC) occurs two hours after increasing traffic num-bers, NOx and traffic-related source emissions (Fig. 5). The delay is probably caused by a combination of two effects. On the one hand, the RH still increases during morning hours, resulting in wetter road surfaces than later in the day (Supplement Fig. S11). On
20
the other hand, increasing traffic flows induce increased wind movements in the street canyon, resulting in enhanced particle resuspension (Bukowiecki et al., 2009).
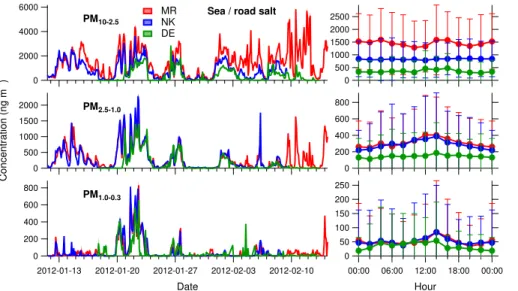
3.1.3 Sea/road salt, aged sea salt and reacted Cl
Sea/road salt and aged sea salt were resolved in all sizes; Fig. 2 shows the profiles, with time series and diurnal variations in Figs. 7–8. The mass of sea/road salt comes
25
ACPD
15, 14733–14781, 2015Advanced source apportionment of trace elements in
London
S. Visser et al.
Title Page
Abstract Introduction
Conclusions References
Tables Figures
◭ ◮
◭ ◮
Back Close
Full Screen / Esc
Printer-friendly Version Interactive Discussion
Discussion
P
a
per
|
Discussion
P
a
per
|
Discussion
P
a
per
|
Discussion
P
a
per
|
relative contributions of more than 50 % for coarse Mg, S and K, but depleted Cl sup-ports aged particles with a sea salt origin, in which the Na is neutralized by compounds not resolved by our analysis (e.g. nitrate). The Mg/Na mass ratio of the sea/road salt factor is only 0.054 in PM10−2.5 (theoretical sea salt ratio is 0.12; Seinfeld and Pandis,
2006). De-icing salt was applied on the roads in London during the measurement
cam-5
paign, and this salt is typically composed of coarse NaCl, resulting in enriched coarse Na relative to Mg concentrations after the particles are resuspended in the air. The low concentrations of fine sea salt are in line with Mazzei et al. (2007), since sea salt is mainly emitted as particles withd >1.0 µm.
The data suggests that a fraction of the aged sea salt is directly transported from the
10
sea, while part comes from resuspended sea salt particles after deposition on roads. The latter is based on the strong concentration gradient in PM10−2.5with concentrations
at MR being 1.3 and 2.2 times higher than at NK and DE, the former on the diurnal variations (Figs. 7–8) without a particular pattern (peaks occur at different hours of the day throughout the time series) and back trajectory analysis. NAME dispersion
15
modelling and wind direction analysis indicate that high concentration episodes in the aged sea salt factor coincide with air masses from the sea. The sea salt concentrations also increase with increasing wind speed, consistent with other Na observations in the UK (Supplement Fig. S12; Twigg et al., 2015).
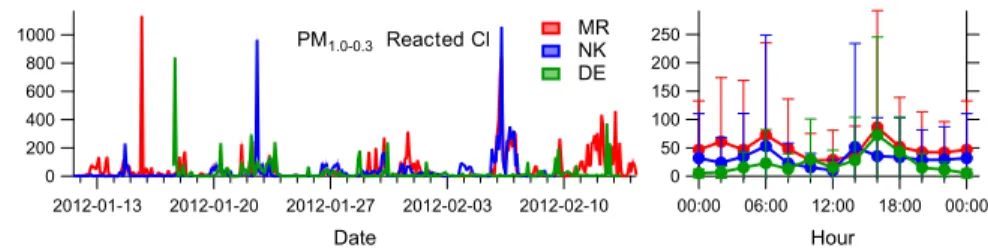
Reacted Cl is unique to PM1.0−0.3(profile in Fig. 2) and is mainly driven by an event at
20
MR and NK lasting from 5 February 16:00 to 7 February 2012 04:00 UTC (time series and diurnal variations in Fig. 9; around 12 February concentrations at MR are high as well, but SR-XRF data at NK and meteorological data at BT Tower are absent during this period, making it impossible to study this episode in detail). Stagnant conditions prevailed in the city with low average wind speed of 2.1 m s−1at about 190 m a.g.l. (data
25
ACPD
15, 14733–14781, 2015Advanced source apportionment of trace elements in
London
S. Visser et al.
Title Page
Abstract Introduction
Conclusions References
Tables Figures
◭ ◮
◭ ◮
Back Close
Full Screen / Esc
Printer-friendly Version Interactive Discussion
Discussion
P
a
per
|
Discussion
P
a
per
|
Discussion
P
a
per
|
Discussion
P
a
per
|
2008) and coal combustion (Yao et al., 2002), this factor does not correlate with com-bustion related species such as K, Zn, Pb and SO2. The event discussed above does
correlate with a strong peak in coarse mode aged sea salt (Figs. 8–9). Sea salt parti-cles in all size fractions have likely reacted with nitric acid (HNO3) forming hydrochloric acid (HCl). Due to stagnant conditions, follow-up reactions between HCl and ammonia
5
(NH3) could have taken place, forming ammonium chloride (NH4Cl). These particles
occur mainly in the fine mode due to the highest surface-to-volume ratios. NO−3 and NH3 concentrations were high during this event, favouring such reactions. AMS
mea-surements also show this unique Cl− episode at MR and NK (Cl− is negligible during the rest of the IOP and at DE). For this specific period the AMS aerosol charge balance
10
in the city holds when Cl− is included, while this ion is not needed at DE or during the rest of the time to balance NH+4 within the uncertainties of the measurements, indicating the presence of fine NH4Cl particles.
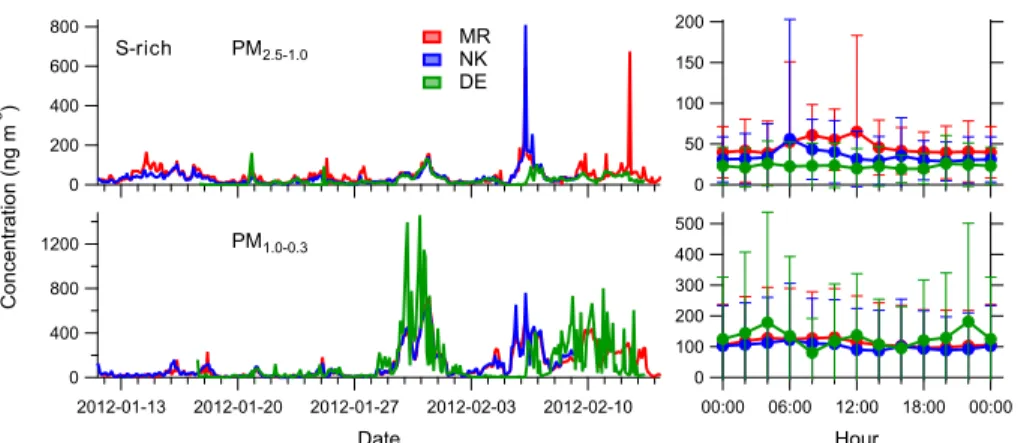
3.1.4 S-rich and solid fuel
The S-rich factor, mainly composed of S, was resolved in PM1.0−0.3; the profile is shown
15
in Fig. 2, with time series and diurnal variations in Fig. 10. Such factors have been iden-tified in the fine fraction by many trace element source apportionment studies at diff er-ent locations, and are typically characterized as regionally transported secondary sul-phate (Mazzei et al., 2007; Richard et al., 2011; Viana et al., 2007). All sites show sim-ilar concentrations without any patterns visible in the diurnal variations, consistent with
20
regional sources. This factor correlates well with AMS SO24−measurements (Pearson’s
R 0.61–0.86) and is elevated with air masses from the European mainland, mainly occurring during the second half of the campaign (Supplement Fig. S13).
The solid fuel factor was also resolved in the fine fraction (profile in Fig. 2, time series and diurnal variations in Fig. 11). The mass of this factor is dominated by S
25
ACPD
15, 14733–14781, 2015Advanced source apportionment of trace elements in
London
S. Visser et al.
Title Page
Abstract Introduction
Conclusions References
Tables Figures
◭ ◮
◭ ◮
Back Close
Full Screen / Esc
Printer-friendly Version Interactive Discussion
Discussion
P
a
per
|
Discussion
P
a
per
|
Discussion
P
a
per
|
Discussion
P
a
per
|
stations, including wood, coal and peat emissions in varying contributions (Harrison et al., 2012a; Young et al., 2015). The S/K ratio of 1.5 is well within the observed range of 0.5–8 for fresh to transported and aged emissions (Bukowiecki et al., 2010; Richard et al., 2011; Viana et al., 2013). The solid fuel source is compared to particle light absorption data by Aethalometer measurements (babs,wb in m
−1
; not available at
5
MR) and biomass burning/solid fuel factors resolved by AMS-PMF on organic aerosol data (Detournay et al., 2015; Young et al., 2014, 2015). The time series of the various solid fuel tracers are very similar, especially for the light absorbing particles and organic aerosol as shown for NK and DE in Fig. 12 (tracers at MR are similar to NK).
In the intermediate fraction S contributes around 58 % to the mass of the S-rich
10
factor (profile in Fig. 2, time series and diurnal variations in Fig. 10) and the relative contributions of S, Br and Pb are>50 % in this factor. Mazzei et al. (2007) have shown that S is predominantly found in PM1, but particles of up to several µm were identified
to contain S as well. The intermediate S-rich factor contains signatures of both fine fraction S-rich and solid fuel with similar concentrations at all sites and no obvious
15
diurnal patterns.
3.1.5 Industrial
Constrained ME-2 analysis in the PM10−2.5fraction on data across sites revealed large
residuals with clear structures at DE for Cr, Ni and Mo, indicating that the data at the rural site was not fully explained. The “ME2_seg_low_SNR” analysis on DE PM10−2.5
20
(see Fig. 1 and Supplement Fig. S6) successfully yielded a factor, potentially industrial, containing mainly these three elements without significant residuals.
Figure 2 shows the source profile and Fig. 13 the time series and diurnal variations. This source is mainly found at DE (time series at MR and NK show only a few single peaks and cannot be attributed to a particular emission source) and consists for 70 %
25
ACPD
15, 14733–14781, 2015Advanced source apportionment of trace elements in
London
S. Visser et al.
Title Page
Abstract Introduction
Conclusions References
Tables Figures
◭ ◮
◭ ◮
Back Close
Full Screen / Esc
Printer-friendly Version Interactive Discussion
Discussion
P
a
per
|
Discussion
P
a
per
|
Discussion
P
a
per
|
Discussion
P
a
per
|
towards the SW of the Kent Showgrounds. Walterson (1998) has studied Cr, Ni and Mo in Sweden and found that road traffic including road wear is the largest emitter of these elements, followed by industries, incineration, agriculture and waste water treatment. DeWees et al. (1992) identified Pb, Ni and Cr in emissions from municipal wastewater sludge incinerators. Except for agricultural fields, none of those activities
5
likely contribute to the emission source at DE. Probably some local activities at the Kent Showgrounds or small-scale industry in Maidstone like stainless steel production (Querol et al., 2007; Witt et al., 2010) contribute to this factor.
3.2 Synthesis
The trace element source apportionment results indicate the ability to characterize the
10
environment-dependent variability of emissions in and around London. The analyses of data from the combined sites retrieve a single source profile representative of all three sites, thus allowing a direct comparison of the source strengths across sites. Source strengths strongly differ between sites and sizes as seen in Fig. 14. Most of the analysed element mass is emitted in PM10−2.5with 78 % at MR, 73 % at NK and 65 % at
15
DE, while only 17–22 % and 6–13 % is emitted in PM2.5−1.0and PM1.0−0.3, respectively.
The separate analyses on the three size fractions provide insights into the emissions of sources to specific size fractions (Fig. 14). The regionally-influenced S-rich and solid fuel factors are restricted to the smaller size fractions with concentration ratios of 1.0– 1.8 between sites roughly 50 km apart. These factors, especially solid fuel, are affected
20
by many anthropogenic point sources and are not only influenced by emissions in and around London but also from elsewhere in the UK and northern Europe. In contrast to other sources, solid fuel is expected to be more prevalent in more rural parts of the UK than in the smoke-controlled inner city areas. The industrial factor is restricted to PM10−2.5and affects the air quality under specific meteorological conditions around the
25
rural site, which is generally a region characterised by much lower pollution.
ACPD
15, 14733–14781, 2015Advanced source apportionment of trace elements in
London
S. Visser et al.
Title Page
Abstract Introduction
Conclusions References
Tables Figures
◭ ◮
◭ ◮
Back Close
Full Screen / Esc
Printer-friendly Version Interactive Discussion
Discussion
P
a
per
|
Discussion
P
a
per
|
Discussion
P
a
per
|
Discussion
P
a
per
|
levels of locally-influenced sources directly related to population density. Brake wear, other traffic-related and resuspended dust factor concentrations are drastically different within different micro-environments and size fractions, indicating major heterogeneity in human exposure patterns. Concentrations at the kerbside are up to 7 and 28 times higher than at NK and DE, respectively, and PM10−2.5 concentrations are up to 4 and
5
14 times higher than PM2.5−1.0 and PM1.0−0.3, respectively. During this winter period
the sea salt sources, although from natural origin and strongly meteorologically driven, are enriched in the city in the form of sea salt resuspension from the roads.
Both direct emissions and resuspension have been identified above as important sources of trace elements. The trend in coarse aged sea salt across the three sites
10
provides insight into the relative importance of these processes. We assume that all aged sea salt originates from a regional, site-independent source, and that the concen-tration gradient in this factor between sites thus reflects the effect of local resuspension processes of naturally deposited aged sea salt. Although sea salt emissions are typ-ically considered a natural process, human activities (vehicle-induced resuspension)
15
enhance the concentrations of the coarse aged sea salt by 1.7–2.2 in the city relative to the rural site (Fig. 14). These ratios provide an upper limit for the resuspension en-hancement (and thus a lower limit for the enen-hancement due to direct emissions) for the anthropogenically-influenced factors, whose concentrations at DE may already be increased by local emissions. The lower limits for direct emission enhancement ratios
20
in the coarse fraction at MR relative to DE are 3.5 to 12.7 for brake wear, other traffi c-related, dust and sea/road salt factors (1.4–5.5 for NK/DE). Direct emissions for the traffic-related factor show similar enhancement in all size fractions, whereas enhance-ment of the other anthropogenically-influenced factors are a factor of 1.5–3.0 lower in the smaller size fractions. These results indicate that direct source emission processes
25
ACPD
15, 14733–14781, 2015Advanced source apportionment of trace elements in
London
S. Visser et al.
Title Page
Abstract Introduction
Conclusions References
Tables Figures
◭ ◮
◭ ◮
Back Close
Full Screen / Esc
Printer-friendly Version Interactive Discussion
Discussion
P
a
per
|
Discussion
P
a
per
|
Discussion
P
a
per
|
Discussion
P
a
per
|
Trace elements are often used as chemically conserved source markers. Here we assess the ability of elements measured herein to serve as unique tracers for specific sources. To be considered a good tracer, we require that a given source has a high relative contribution (>70 %) to a specific element, i.e. that the element is mainly at-tributed to a single source (Fig. 2). We suggest Cu, Zr, Sb or Ba as markers for brake
5
wear in PM10−2.5 and PM2.5−1.0. The relative contributions are>93, 83, 93 and 96 %
for Cu, Zr, Sb and Ba, respectively. The attribution of these elements to the traffic factor in PM1.0−0.3with relative contributions between 69 and 84 % also suggests brake wear
emissions in this size fraction. Fe is typically also attributed to brake wear emissions (Amato et al., 2009b; Bukowiecki et al., 2010; Harrison et al., 2012b). However, we
10
observed no Fe in the brake wear factors, instead 86 and 65 % of Fe was attributed to other traffic-related processes in PM10−2.5 and PM2.5−1.0 (74 % of Fe to the traffi
c-related factor in PM1.0−0.3). Furthermore, around 19 % of Fe contributed to the
resus-pended dust factors in all three size fractions. We therefore recommend attributing Fe only to a specific source in combination with other markers. Si and Ca in all size
15
fractions can be used as surrogate for resuspended dust with relative contributions be-tween 72 and 75 % for Si and bebe-tween 80 and 85 % for Ca, respectively. Coarse and intermediate fraction Cl (relative contributions>87 %) are markers for fresh sea salt (preferably combined with Na and Mg), while fine fraction Cl is not a unique source indicator. Depending on the dataset it can indicate waste incineration (Moffet et al.,
20
2008), coal combustion (Yao et al., 2002) or reacted Cl as NH4Cl particles (current
study, relative contribution 59 %). A combination of fine fraction K and Pb with relative contributions of around 80 % indicates solid fuel in this study, but can also be attributed to wood, coal or peat burning separately. Fine fraction S can typically be attributed to re-gionally transported secondary sulphate (here only a 65 % relative contribution). Other
25
ACPD
15, 14733–14781, 2015Advanced source apportionment of trace elements in
London
S. Visser et al.
Title Page
Abstract Introduction
Conclusions References
Tables Figures
◭ ◮
◭ ◮
Back Close
Full Screen / Esc
Printer-friendly Version Interactive Discussion
Discussion
P
a
per
|
Discussion
P
a
per
|
Discussion
P
a
per
|
Discussion
P
a
per
|
4 Conclusions
Trace element measurements were performed at kerbside, urban background and rural sites to characterize the environment-dependent variability of emissions in the European megacity of London during winter 2012. Sampling with rotating drum im-pactors and subsequent synchrotron radiation-induced X-ray fluorescence
spectrom-5
etry yielded 2 h element mass concentrations in PM10−2.5, PM2.5−1.0 and PM1.0−0.3
aerosol. Source apportionment using the ME-2 algorithm in the PMF model was con-ducted on datasets comprising all three sites but analysed separately for each size. Combining the sites enabled separation of sources with high temporal covariance but significant spatial variability. Separation of sizes improved source resolution by
prevent-10
ing sources occurring in only a single size fraction from having too small a contribution for the model to resolve. Anchor profiles for several factors were retrieved by analysing specific data subsets and these profiles were successfully used in the analyses of the complete datasets to retrieve clean factor profiles and time series at all sites.
The coarse fraction yielded (elements with highest relative contributions in
brack-15
ets) brake wear (Cu, Zr, Sb, Ba), other traffic-related (Fe), resuspended dust (Si, Ca), sea/road salt (Cl), aged sea salt (Na, Mg) and industrial (Cr, Ni) factors. The interme-diate fraction yielded the same factors, except the industrial, and instead yielded an S-rich (S) factor. In the fine fraction a traffic-related factor (Fe, Cu, Zr, Sb, Ba) was found as well as resuspended dust, sea/road salt, aged sea salt, reacted Cl (Cl), S-rich
20
and solid fuel (K, Pb). The other analysed elements (Al, P, Ti, V, Mn, Zn, Br, Sr, Mo, Sn) could not be attributed to a single factor. The brake wear, industrial, reacted Cl and solid fuel factors could only be resolved with the help of anchor profiles retrieved internally in the datasets.
The regionally-influenced S-rich and solid fuel factors are restricted to the smaller
25
ACPD
15, 14733–14781, 2015Advanced source apportionment of trace elements in
London
S. Visser et al.
Title Page
Abstract Introduction
Conclusions References
Tables Figures
◭ ◮
◭ ◮
Back Close
Full Screen / Esc
Printer-friendly Version Interactive Discussion
Discussion
P
a
per
|
Discussion
P
a
per
|
Discussion
P
a
per
|
Discussion
P
a
per
|
resuspended dust sources show steep concentration gradients from kerbside to urban background to rural sites and from PM10−2.5 to PM2.5−1.0to PM1.0−0.3 (ratios up to 28
and 14 for kerb-to-rural and PM10−2.5-to-PM1.0−0.3, respectively) and are directly related
to anthropogenic activities (mainly traffic flows) with concentrations up to a factor of 4 higher during daytime relative to night-time. The relative mass contributions are
domi-5
nated by the sea salt factors in PM10−2.5and PM2.5−1.0, while the regionally-influenced
factors dominate PM1.0−0.3.
The site-dependent concentration gradients in aged sea salt reflect the effect of lo-cal resuspension processes. Human activities enhance the kerbside concentrations of the coarse aged sea salt by a factor of 1.7–2.2 compared with the rural site. For
10
anthropogenically-influenced factors, direct source emissions provide a further kerb-to-rural enhancement of concentrations by a factor of 3.5–12.7, and these direct emis-sions occur mainly for coarse particles.
The Supplement related to this article is available online at doi:10.5194/acpd-15-14733-2015-supplement.
15
Acknowledgements. We thank the Swiss National Science Foundation (SNSF grant
200021_132467/1), the UK Natural Environment Research Council (NERC) ClearfLo consor-tium (NERC grant NE/H00324X/1, NE/H0081368/1), and the European Community’s Seventh Framework Programme (FP/2007-2013, grant number 312284). J. G. Slowik was supported by the SNSF Ambizione program (grant PX00P2_31673), and D. E. Young by a NERC Ph.D.
20
studentship (grant NE/I528142/1). The Detling site was supported by the US Department of Energy Atmospheric Systems Research Program (DOE Award No. DE-SC0006002). We thank Empa for the RDI they loaned us during the ClearfLo project. Parts of the work were carried out at the Swiss Light Source, Paul Scherrer Institute, Villigen, Switzerland. We thank Andreas Jaggi and Christophe Frieh for technical support at the beamline X05DA. Parts were performed
25
ACPD
15, 14733–14781, 2015Advanced source apportionment of trace elements in
London
S. Visser et al.
Title Page
Abstract Introduction
Conclusions References
Tables Figures
◭ ◮
◭ ◮
Back Close
Full Screen / Esc
Printer-friendly Version Interactive Discussion
Discussion
P
a
per
|
Discussion
P
a
per
|
Discussion
P
a
per
|
Discussion
P
a
per
|
References
Amato, F., Pandolfi, M., Escrig, A., Querol, X., Alastuey, A., Pey, J., Perez, N., and Hopke, P. K.: Quantifying road dust resuspension in urban environment by multilinear engine: a compari-son with PMF2, Atmos. Environ., 43, 2770–2780, 2009a. 14737, 14749, 14750
Amato, F., Pandolfi, M., Viana, M., Querol, X., Alastuey, A., and Moreno, T.: Spatial and chemical
5
patterns of PM10in road dust deposited in urban environment, Atmos. Environ., 43, 1650– 1659, 2009b. 14748, 14756
Amato, F., Schaap, M., Denier van der Gon, H. A. C., Pandolfi, M., Alastuey, A., Keuken, M., and Querol, X.: Short-term variability of mineral dust, metals and carbon emission from road dust resuspension, Atmos. Environ., 74, 134–140, 2013. 14736, 14748
10
Bigi, A. and Harrison, R. M.: Analysis of the air pollution climate at a central urban background site, Atmos. Environ., 44, 2004–2012, 2010. 14739
Bohnenstengel, S. I., Belcher, S. E., Aiken, A., Allan, J. D., Allen, G., Bacak, A., Bannan, T. J., Barlow, J. F., Beddows, D. C. S., Bloss, W. J., Booth, A. M., Chemel, C., Coceal, O., Di Marco, C. F., Dubey, M. K., Faloon, K. H., Fleming, Z. L., Furger, M., Gietl, J. K.,
15
Graves, R. R., Green, D. C., Grimmond, C. S. B., Halios, C. H., Hamilton, J. F., Harri-son, R. M., Heal, M. R., Heard, D. E., Helfter, C., Herndon, S. C., Holmes, R. E., Hop-kins, J. R., Jones, A. M., Kelly, F. J., Kotthaus, S., Langford, B., Lee, J. D., Leigh, R. J., Lewis, A. C., Lidster, R. T., Lopez-Hilfiker, F. D., McQuaid, J. B., Mohr, C., Monks, P. S., Ne-mitz, E., Ng, N. L., Percival, C. J., Prévôt, A. S. H., Ricketts, H. M. A., Sokhi, R., Stone, D.,
20
Thornton, J. A., Tremper, A. H., Valach, A. C., Visser, S., Whalley, L. K., Williams, L. R., Xu, L., Young, D. E., and Zotter, P.: Meteorology, air quality, and health in London: the ClearfLo project, B. Am. Meteorol. Soc., doi:10.1175/BAMS-D-12-00245.1, online release, 2014. 14738, 14740
Brunekreef, B. and Forsberg, B.: Epidemiological evidence of effects of coarse airborne
parti-25
cles on health, Eur. Respir. J., 26, 309–318, 2005. 14736
Bukowiecki, N., Lienemann, P., Hill, M., Figi, R., Richard, A., Furger, M., Rickers, K., Falken-berg, G., Zhao, Y. J., Cliff, S. S., Prévôt, A. S. H., Baltensperger, U., Buchmann, B., and Gehrig, R.: Real-world emission factors for antimony and other brake wear related trace ele-ments: size-segregated values for light and heavy duty vehicles, Environ. Sci. Technol., 43,
30