1Centro Polar e Climático, Instituto de Geociências, Universidade Federal do Rio Grande do Sul – UFRGS, Porto Alegre (RS), Brazil. E-mail: [email protected]
[email protected], [email protected], [email protected]
2Climate Change Institute and Department of Earth Sciences, University of Maine, Orono, USA. E-mail: [email protected], [email protected]
*Corresponding author.
Manuscript ID: 20150035. Received in: 09/29/2015. Approved in: 01/13/2016. ABSTRACT: Anice core, 92.26 m in length, was collected near the ice divide of the West Antarctica ice sheet during the 2008/2009 austral summer. his paper described the ieldwork at the Mount Johns site (79º55’S; 94º23’W) and presented the irst results of the upper 45.00 m record covering approximately 125 years (1883 – 2008), dated by annual layer counting and volcanic reference ho-rizons. Trace element concentrations in 2,137 samples were deter-mined using inductively coupled plasma mass spectrometry. he concentrations obtained for Al, Ba, Ca, Fe, K, Mg, Mn, Na, Sr and Ti are controlled by climate variations, the transport distance, and the natural sources of these aerosols. Natural dust contributions, mainly derived from the arid areas of Patagonia and Australia, are important sources for aluminum, barium, iron, manganese and ti-tanium. Marine aerosols from sea ice and transported by air masses are important sources of sodium and magnesium. Calcium, potas-sium and strontium showed considerable inputs of both continen-tal dust and marine aerosols.
KEYWORDS: Trace elements; Ice core; West Antarctica ice sheet; ICP-SFMS.
RESUMO: Um testemunho de neve de 92,26 m foi coletado em um dos divisores da bacia de drenagem glacial do manto de gelo da Antártica Ocidental no verão austral de 2008/2009. Este artigo descreveu os trabalhos de campo no sítio Mount Johns (79º55’S; 94º23’W) e apresentou os resultados das análises dos 45,00 m do registro superiores do testemunho e que representam cerca de 125 anos (1883 – 2008) de precipitação de neve, datados por meio da conta-gem anual das camadas e dos horizontes vulcânicos de referência. Os elemen-tos-traço estudados neste trabalho foram determinados usando espectrometria de massas por plasma indutivamente acoplado em 2.137 amostras. As concen-trações obtidas para Al, Ba, Ca, Fe, K, Mg, Mn, Na, Sr e Ti são controladas pelas variações climáticas, pela distân cia de transporte e pelas fontes naturais desses aerossóis. Contribuições naturais de poeira, oriundas principalmente das áreas áridas da Patagônia e da Austrália, são importantes fontes para alumínio, bário, ferro, manganês e titânio. Os aerossóis marinhos, provenientes do gelo marinho e transportados pelas massas de ar, são fontes importantes de sódio e magnésio. Cálcio, potássio e estrôncio apresentam aportes consideráveis tanto de poeira continental como de aerossóis marinhos.
PALAVRAS-CHAVE: Elementos-traço; Testemunho de gelo; Manto de gelo antártico; ICP-SFMS.
Drilling, processing and irst
results for Mount Johns ice core in
West Antarctica Ice Sheet
Perfuração, processamento e primeiros resultados de um
testemunho do manto de gelo da Antártica Ocidental
Franciele Schwanck1*, Jeferson Cardia Simões1, Michael Handley2,
Paul Andrew Mayewski2, Ronaldo Torma Bernardo1, Francisco Eliseu Aquino1
INTRODUCTION
Air temperature on the surface of the Antarctic Peninsula and West Antarctica have increased dramatically in recent decades with some reports suggesting that these are the regions which are warming faster on Earth (Turner et al. 2006, Bromwich et al. 2013). Even though climate models suggest large natural climate variability over West Antarctica (Hawkins & Sutton 2012), instrumental records in this part of the continent are scarce, and there is a lack of long-term records, which make diicult the assessment on a larger time scale.
Weather information obtained from ice cores in Antarctica provide a longer and detailed historical record than the cur-rently available from instrumental observations. he high resolution of ice records provide information about the composition of the atmosphere in the past, in particular, changes in regions of aerosols origin and transport path-ways (Legrand & Mayewski 1997, Schneider et al. 2006, Mayewski et al. 2009). However, most of these records are sites in East Antarctica. Often, climate reconstructions from West Antarctica are discarded for producing inconsistent results due to discontinuous records and the lack of data (Monaghan et al. 2008, Steig et al. 2009).
West Antarctica has lower elevation compared to East Antarctica, making West Antarctica more subject to the inluence of marine air masses (Noone & Simmonds 2004, Nicolas & Bromwich 2011). Places with such inluence are important because they relect more directly the atmospheric conditions resulting from changes in ocean circulation and sea ice extent.
In this study, we presented ield data and the irst lab-oratory results of an ice core obtained in West Antarctica, around 75 km from Mount Johns nunatak1 (79°33’S,
91°14’W). he core is part of the ITASE (International Trans-Antarctic Scientiic Expedition) collection, an inter-national initiative that has the emphasis to collect data from the past 200 years (although some records reach 1,000 years) by ice cores spaced 200 km (Mayewski & Goodwin 1997).
MATERIALS AND METHODS
Drilling site
he drilling mission in the austral summer 2008/2009 was developed from a base camp near the airstrip at Patriot Hills (80°18’S, 81°22’W) in the Ellsworth mountains, as part of the multidisciplinary expedition called “Deserto de Cristal”. From that point, four researchers lew by a twin-engine plane,
Twin-Otter, to the drilling site at 79°55’28 “S, 94°23’18 “W, 2,100 m of altitude, here called Mount Johns (MJ), where the ice thickness exceeds 2,400 m (project data BedMap 2: Bed Topography of the Antarctic; Fretwell et al. 2013).
his drilling site (Fig. 1) was selected considering the following characteristics:
1. it has a relatively high accumulation rate,
2. it is located on a drainage basin divide (separating the Pine Island Glacier drainage basin from the one that lows to the Filchner-Ronne Ice Shelf ),
3. it is located in an area of air mass confluence (air masses from the Weddell, Amundsen and Bellingshausen seas), and
4. no ice cores have been drilled nearby.
Fieldwork
Drilling
Drilling was performed with the use of an electrome-chanical drill FELICS (Fast Electromeelectrome-chanical Lightweight Ice Coring System) that retrieve cores of 8.5 cm in diameter and up to 80 cm long, reaching a maximum of 160 m in depth in the ice (Ginot et al. 2002). he ice core MJ reached a depth of 92.26 m.
Density
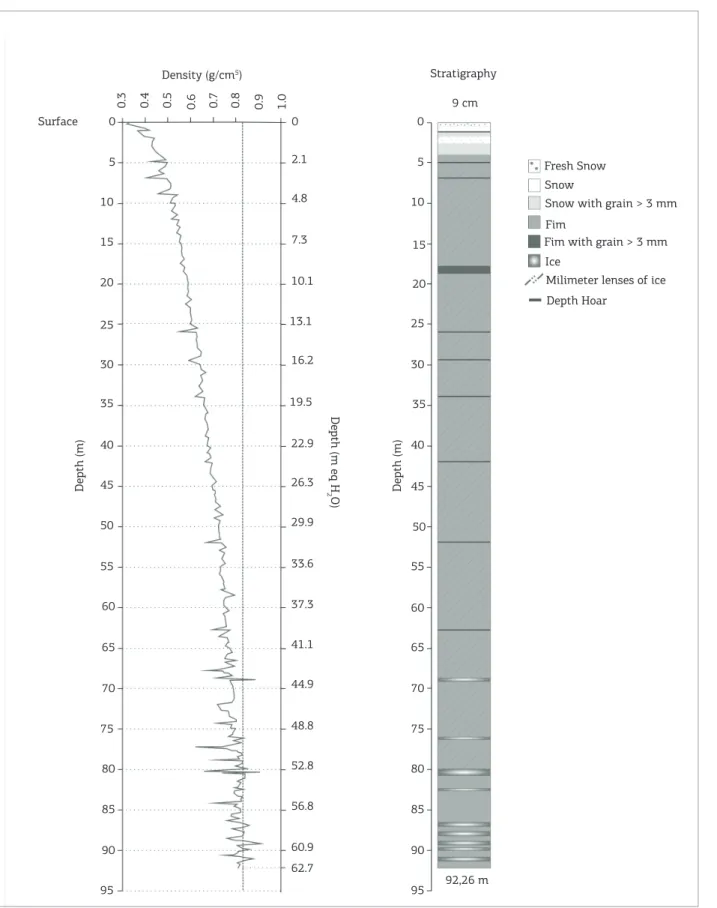
Each core obtained was immediately weighed with an electronic balance, Bioprecisa BS3000A model, with a pre-cision of 0.1 g. From this measure and the linear dimen-sions (length and diameter), we made the density proile by the depth (Fig. 2). Determination of density allows correct-ing the proile in equivalent water and then calculatcorrect-ing the annual accumulation. MJ ice core represents 62.70 m of water equivalent after correction for density. his depth is the sum of the length of each section multiplied by its density.
MJ ice core has an average density of 0.70 g cm-3,
rang-ing of 0.34 to 0.91 g cm-3. he density increases gradually
(as expected at a site without evidence of surface melting of snow) and reaches the transition irn/ice (density 0.83 g cm-3)
at depth 68.88 m (44.00 m in water equivalent).
Stratigraphy
he transformation of snow to ice occurs for densiica-tion (with partial air expulsion) and recrystallizadensiica-tion. Note that in polar glaciers this whole process occurs without for-mation of seasonal melt water. he classiication used by gla-ciologists (e.g., Cufey & Paterson 2010) has the following sequence with increasing depth:
1. snow is usually restricted to material that has not changed much since it deposition;
2. irn are the crystals in an intermediate phase, indicat-ing a continuous transformation of the physical prop-erties of snow, increasing the diameter of the crystals and partial expulsion of air, while maintaining the per-meability and communication with the atmosphere; 3. ice is snow that sufered intense compaction and meta-morphism, whose pores are inally closed (i.e., loss of permeability), which occurs approximately when snow reaches a density of 0.83 g cm-3.
MJ stratigraphy was described visually using the crite-ria above and density measurements (Fig. 2). First 4 m are constituted principally of fresh snow and snow with smaller grains alternating with larger grain (> 3 mm) followed by irn layers until a depth of 68.80 m. he following meters until the depth of 92.26 m constitute a transition zone, alternating
layers of irn and ice. hroughout the MJ ice core, it is pos-sible to observe millimeter ice layers. Depth hoar2 layers are
observed on some levels, for example the 18 m depth. he recorded observations do not show evidence of per-colation of water or refreezing across the proile. In addition, layers containing microparticles have not been observed (e.g., volcanic ash), which could be correlated to speciic volcanic events.
Borehole temperature
The temperature distribution in glaciers and ice sheets depends on several factors, e.g. geothermal heat flux and heat generated by frictional heating basal slip warm or melt the base (Cuffey & Patterson 2010). However, in the first 10 to 15 m, the temperature of the snowpack is controlled by seasonal variations in air temperature. Thus, in glaciers not subjected to seasonal snow melting at the surface (the melting water would
Figure 1. Map of Antarctica showing the collection site in Mount Johns (79°55’28”S, 94°23’18”W, arrow) and the main toponyms mentioned in this paper (Figure adapted from Simões 2011). The perspective view in the lower right corner shows the Mount Johns (marked area) in relation to the southern hemisphere.
Ice Shelf Ice Sheet Exposed Rock
90oW 90oE
180o
0o
0 1000km
Weddell Sea
Antarctic P
eninsula
South
Shetlands
Larsen ice Shelf
Filchner-Ronne Ice Shelf
Queen Maud Land
East Antarctica
Vinson Massif
Mount Johns
Transantartic
Mountains
Marie Byrd Land
Bellingshaussen Sea
Amundsen Sea
South Pole
Ross Ice Shelf
McMurdo (USA)
Dome Fuji
Dome A
Subglacial Lake Vostok
Vostok
Dome C
V
ictoria
Land
West Antarctica
Figure 2. On the let, Mount Johns ice core density proile (in g cm-3). Note the two depth scales (real depth on the
let side and meter water equivalent on the right side). The dashed line marks the transition between irn and ice (i.e., density greater than 0.83 g cm-3). The right proile shows the stratigraphy over the 92.26 m of the Mount
Johns ice core.
0 0
5 5
10 10
15 15
20 20
25 25
30 30
35 35
40 40
45 45
50 50
55 55
60 60
65 65
70 70
75 75
80 80
85 85
90 90
92,26 m
95 95
Surface
Depth (m)
Depth (m eq H
2O) Depth (m)
Fresh Snow
Snow
Snow with grain > 3 mm
Fim
Fim with grain > 3 mm
Ice
Milimeter lenses of ice
Depth Hoar
Density (g/cm5) Stratigraphy
9 cm 0.3 0.4 0.5 0.6 0.7 0.8 0.9 1.0
22.9
26.3
29.9
33.6
37.3
41.1
44.9
48.8
52.8
56.8
60.9
62.7 0
2.1
4.8
7.3
10.1
13.1
16.2
liberate latent heat and increase the temperature of the snow), the temperature between 10 and 15 m is the aver-age air temperature at the site.
Temperature at 12 m deep at MJ ice core was measured by a probe composed of a silver strength previously cali-brated and placed onto the tip of an electric cable. he probe remained in the pit 24 hours for establishment of thermal equilibrium with the walls of the well. he value of the tem-perature measured was -33°C.
Storage and transport
Sections of 1 m in length were packed in tubular coils of poly-ethylene, then organized in polystyrene boxes and transported by air in a cargo plane to Punta Arenas (Chile), where they were stored in cold room at -20°C. he ice cores were lown under refrigeration in 2009 of Punta Arenas to New York and after in a refrigerator truck to Bangor, Maine, where it was kept solid in an industrial refrigerator until the time of preparation for analysis.
Laboratory work
Decontamination and subsampling by Continuous Ice Core Melter System
Sample preparation and decontamination were per-formed at the Climate Change Institute (CCI), University of Maine, USA. During all transport and storage, the MJ ice core remained frozen at temperatures below -20°C.
Decontamination of the MJ ice core was conducted in a certiied cold room (-20°C) of class 100. he outer layer of the irn and ice was scraped (between 2 and 4 mm) using a clean ceramic knife to prevent contamination (procedure performed according Tao et al. 2001). he ends of each section were removed because they are most susceptible to contamination.
he core was melted using a Continuous Ice Core Melter System (housed in clean room class 100) developed by CCI researchers from the model proposed by Röthlisberger et al. (2000), which enables a discrete sampling and automatic quartering section. According to Osterberg et al. (2006), this system can simultaneously and continuously sample the ice core for three different glaciochemical analyses: major elements by Ion Chromatography (IC), trace ele-ments by Inductively Coupled Plasma Sector Field Mass Spectrometry (ICP-SFMS) and stable isotopes by Cavity Ring-Down Spectroscopy (CRDS). he samples were col-lected into acid-cleaned (Optima HNO3) LDPE vials and acidiied to 1% with double-distilled HNO3 before analysis.
Determination of trace elements by ICP-SFMS
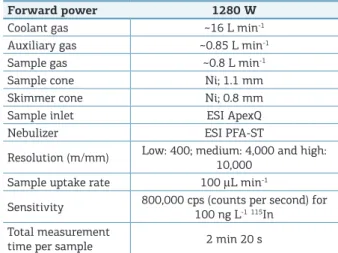
Trace element concentrations (Al, Ca, Fe, K, Mg, Mn, Na, Sr, and Ti) in 2,137 samples (corresponding to the upper 45 m of the MJ ice core) were determined using the
CCI hermo Electron Element2 ICP-SFMS coupled to an ESI model SC-4 autosampler. Working conditions and measurement parameters are described in Table 1. he ICP-SFMS is calibrated daily with ive standards that bracket the expected sample concentration range. Although there is no certiied reference material for trace elements in polar snow and ice, the analyzed samples were certiied with water refer-ence material (SLRS-4, National Research Council Canada, Ottawa, Canada) to ensure the concentrations within the certiication range, conirming the accuracy of this method (details in Osterberg et al. 2006).
RESULTS
Ice core dating
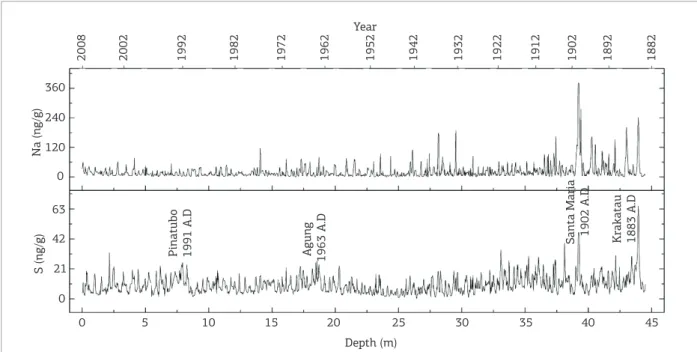
The MJ ice core record (upper 45 m) was dated by annual layer counting based on seasonal variations of Na and S concentrations (Fig. 3). Based on the elemental con-centrations determined by ICP-MS, the annual seasonal peaks were identiied and estimated, sequentially, the depo-sition dates (Steig et al. 2005). Layer dating by this type of counting is reliable in polar ice cores, as the original depos-ited snow sequence is preserved because melting, percola-tion and refreezing processes are rare in the Antarctic and Greenland ice sheets (Cufey & Paterson 2010).
Most of the Na in Antarctic snow precipitation origi-nates from open ocean sources. Peaks in Na concentrations in continental Antarctica occur primarily in winter/spring due to more intense atmospheric circulation and trans-port during this time of the year (Legrand & Mayewski 1997, Korotkikh et al. 2014). Sulfur deposition in the West Antarctica ice sheet relects both marine and non-marine
Forward power 1280 W
Coolant gas ~16 L min-1
Auxiliary gas ~0.85 L min-1
Sample gas ~0.8 L min-1
Sample cone Ni; 1.1 mm
Skimmer cone Ni; 0.8 mm
Sample inlet ESI ApexQ
Nebulizer ESI PFA-ST
Resolution (m/mm) Low: 400; medium: 4,000 and high: 10,000
Sample uptake rate 100 μL min-1
Sensitivity 800,000 cps (counts per second) for 100 ng L-1115In
Total measurement
time per sample 2 min 20 s
sources, and, in some cases, volcanic contribution is very important to the levels of this element (Steig et al. 2005). A regular pattern was observed in the concentrations obtained from both marine as continental origin, except anomalous peaks in the concentration proile that have been identiied as major explosive volcanic events around the globe.
Major historical volcanic eruptions, such as Pinatubo (1991), Agung (1963), Santa Maria (1902) and Krakatoa (1883), were identiied by large sulfur concentration peaks and were used as absolute time horizons during the times-cale elaboration. Based on these data, the upper 45 m of the MJ ice core cover the period from 1883 – 2008 (± 2 years) A.D.
First results on concentration
of trace elements
We measured the concentrations of 10 trace elements (Al, Ba, Ca, Fe, K, Mg, Mn, Na, Sr and Ti) in 2,137 sam-ples. hese samples represent the upper 45 m of MJ ice core, totaling about 125 years of continuous record. Table 2 shows a statistical summary of the trace element concentrations measured at Mount Johns site.
Contributions from primary natural sources in each sample were estimated using the following indicators: alu-minum (Al) for rock, and soil dust and sea-salt-sodium (ss-Na) for sea-salt spray. Aluminum and sodium were chosen for being the major constituent of the earth’s crust (Planchon
Figure 3. Mount Johns ice core timescale based on the Na and S concentration variations and major volcanic events in the period.
2008 2002 1992 1982 1972 1962 1952 1942 1932 1922 1912 1902 1892 1882
Year
360
240
120
0
63
42
21
0
Na (ng/g)
S (ng/g)
10 15 20
0 5 35 40 45
Depth (m) Pinatubo 1991 A.D Agung 1963 A.D
Krakatau 1883 A.D
25 30
Santa Maria 1902 A.D
Element Concentration Deviation Standard (±) Samples number
Mean Minimum Maximum
Al (ng g-1) 2.64 0.30 22.77 1.65 2132
Ba (pg g-1) 9.31 0.38 93.46 11.45 2120
Ca (ng g-1) 3.01 0.09 21.22 3.24 2095
Fe (ng g-1) 0.62 0.05 5.58 0.68 2124
K (ng g-1) 1.78 0.06 39.54 3.39 2125
Mg (ng g-1) 9.27 0.66 45.18 4.71 2132
Mn (pg g-1) 28.10 0.94 783.79 61.60 2132
Na (ng g-1) 21.91 0.21 381.61 33.10 2132
Sr (pg g-1) 23.21 0.74 117.94 17.85 2116
Ti (pg g-1) 14.15 0.66 209.35 18.76 2127
et al. 2002) and the main constituent of sea salt respectively (Weller et al. 2008, Dixon et al. 2013).
he soil and rock dust contribution for the trace elements studied were given by the crustal Enrichment Factor (EFc) using the following equation (Osterberg 2007):
EFC=Xice/Alice
Xref/Alref
in which Xice is the trace element concentration in the sam-ple, Alice is the aluminum concentration in the sample, and Xref and Alref are the trace element and the aluminum con-centrations in the reference material, respectively. he mean elemental concentration used for reference is the average composition of the upper continental crust taken from the literature (Wedepohl 1995).
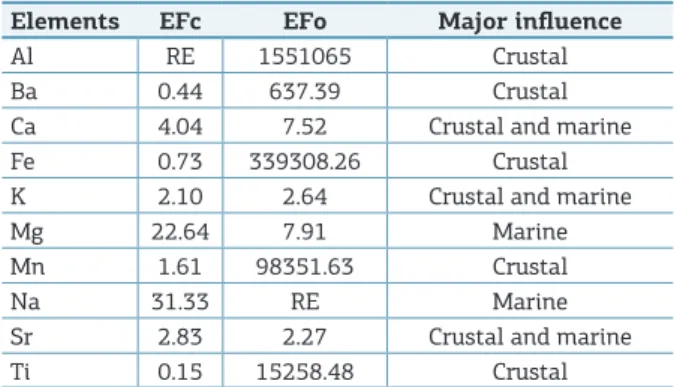
Usually, elements with EFc lower than 10 are considered to be non-enriched and predominantly have a crustal dust origin (Duce & Zoller 1975). Our calculations for the study period show that EFc values for the trace elements Ba, Ca, Fe, K, Mn, Sr, and Ti are low (Tab. 3), indicating a majority ter-rigenous contribution to the concentration of these elements. Marine aerosols contributions were estimated using the oceanic Enrichment Factor (EFo) from the following equa-tion (Osterberg 2007):
EFO=Xice/Naice
Xref/Naref
in which Xice is the trace element concentration in the sample, Naice is the Na concentration in the sample, and Xref and Naref are the trace element and Na concentration in the reference material. We used the average composition of ocean water (Lide 2005) as a reference for the ocean elemental abundances.
Ca, K, Mg, and Sr presented low oceanic enrichment fac-tor (less than 10). he results obtained show a strong marine inluence in these elements. For Na and Mg marine contribution was considered the main constituent in the concentrations mea-sured. For Ca, K and Sr both continental and marine aerosols are important sources (crustal Enrichment Factor and oceanic Enrichment Factor less than 10), details in the Table 3.
DISCUSSION
Contributions from volcanic and anthropogenic emis-sions were also evaluated, but, for the trace elements stud-ied, the enrichment found these sources to be considered
insigniicant. he data presented here allow a preliminary assessment of the origin of aerosol deposited at Mount Johns site, and provides a pre-classiication of these trace elements.
Based on the elements analyzed, we determined that the concentrations of Al, Ba, Fe, Mn and Ti are predominantly crustal origin (dust of rock and soil), while Mg and Na con-centrations have high marine inluence (sea spray). Ca, K and Sr concentrations indicate inluences of both sources.
Figure 4 shows a high variability of the concentrations for all studied trace elements. his variation relects sea-sonality (summer and winter) and the complex process of transport and deposition. Long distances between source area and depositional site and climate interference (e.g., El Niño) are some of the factors afecting transport.
Marine aerosol is generated by the formation and rup-ture of bubbles in the open sea (Leeuw et al. 2011). While large particles are deposited rapidly on the ocean, smaller particles are carried along the continents, and, as a result, the amount of sea salt deposited in an interior location decreases rapidly as it moves away from the coast (Guelle et al. 2001).
Marine derived trace elements in inland ice cores have showed a clear seasonal signal, with highest concentrations in winter and spring (March to November), and lowest con-centrations in summer (December-February) (Kaspari et al. 2005); the same pattern was found in our analysis (Fig. 5). hus, marine aerosol transport in Antarctica is greater during cold periods, when sea ice extent increases the distance between the drilling site and the open sea. If the major marine aero-sol source is the open sea, then a more eicient transport or a higher production rate of aerosols by bubbles bursting is required to account for the higher levels of salt spray during the winter. Previous studies have attributed high marine aerosol concentrations (in ice cores) to intensify production
Elements EFc EFo Major inluence
Al RE 1551065 Crustal
Ba 0.44 637.39 Crustal
Ca 4.04 7.52 Crustal and marine
Fe 0.73 339308.26 Crustal
K 2.10 2.64 Crustal and marine
Mg 22.64 7.91 Marine
Mn 1.61 98351.63 Crustal
Na 31.33 RE Marine
Sr 2.83 2.27 Crustal and marine
Ti 0.15 15258.48 Crustal
Table 3. Average enrichments of elements measured in Mount Johns site for the study period. The reference element used for continental crust was aluminum (based on its high oceanic Enrichment Factor) and for marine aerosol was sodium (based on its high crustal Enrichment Factor).
of aerosols associated with high wind speeds and turbulent conditions related to increased cyclonic activity during the winter (Curran et al. 1998, Kreutz et al. 2000).
While regional and local sources are important for sea salt aerosols, the source regions for mineral dust are located more than 4,000 km away, and, consequently, the long-distance transport, most likely through the troposphere, is decisive (Genthon 1992, Krinner & Genthon 2003). he lower eleva-tion of West Antarctica facilitates the air masses advance (Nicolas & Bromwich 2011) and therefore it receives two to four times
more dust than East Antarctica (Nef & Bertler 2015). Studies have demonstrated that the most important source of mineral dust in this part of Antarctica are the arid and semi-arid regions of Australia, New Zealand and Patagonia (Smith et al. 2003, Delmonte et al. 2008, Albani et al. 2012).
he mobilization of continental dust to Antarctica relects several factors, including climatic and environmental con-ditions (e.g., type and vegetation density, moisture, and soil property), so that both the land use and climate change influence on dust mobility (Prospero et al. 2002).
Figure 4. Proiles of Al, Ca, Fe, K, Mg, Mn, Na, Sr, and Ti measured at Mount Johns ice core, West Antarctica. 2010
2000
1990
1980
1970
1960
1950
1940
1930
1920
1910
1900
1890
1880 0
Al (ng g-1) Ba (pg g-1) Ca (ng g-1) Fe (ng g-1) K (ng g-1)
0 10 20 30 40 50 0 2 4 6 8 10 0 1 2 3 0 3 6
3 6 9 9 12 15
12.28
63.02
69.54
11.68 24.69
4.49
Y
ear
2010
2000
1990
1980
1970
1960
1950
1940
1930
1920
1910
1900
1890
1880
Y
ear
0 9 18 27 0 50 100150200 250 0 20 40 60 80100 0 20 40 60 80 0 10 20 30 40 50 60
Mg (ng g-1) Mn (pg g-1) Na (ng g-1) Sr (pg g-1) Ti (pg g-1)
450.88
Previous studies show that deposition of dust presents a well-deined seasonal cycle (Albani et al. 2012), but direct observation of dust deposition in Antarctica are very dii-cult because of very low concentrations and variability in atmospheric deposition rates (Bigler et al. 2006). he irst observations of the seasonal dust cycle suggested peaks in winter (hompson 1975); later studies have questioned this evidence (Mumford & Peel 1982). Recent studies using trace elements analysis (Burn-Nunes et al. 2011) and atmospheric simulations (Albani et al. 2012) had demon-strated that the deposition of dust in East Antarctica has minimum in June, followed by maximum in late winter/ spring. Observations based in aluminum concentration in the Antarctic Peninsula have indicated concentration peaks in late winter (McConnell et al. 2007). For West Antarctica, no data are available yet. We found in our anal-ysis, concentrations peak in late winter/spring, consistent with deposition patterns in interior areas of East Antarctica.
Between 1883 and 2008, the high-resolution Mount Johns ice core record indicates that the trace element concentrations (mainly Al, Ba, Fe, Mg and Ti) were highly variable through time, with a declining trend in the decade of 1940 and further increase (Fig. 6). Low concentrations observed around the year 1940 would be associated with weather events; in this case, the strong El Niño occurred between 1939 and 1942 (Schneider
& Steig 2008), which directly affected the South Pacific and West Antarctica. Not all El Niño events are asso-ciated with strong anomalies in Antarctica, but some studies have shown that there is an important influence on climate variability in high latitude (Turner 2004, Bromwich & Fogt 2004).
After 1980, there is a slight increase in variability concen-trations of Al, Ba, Ca, Fe, Mg and Ti, indicating that there was an increased transport of dust during this period. A study on James Ross Island (64.2°S, 57.7°W; 1600 m altitude), north of the Antarctic Peninsula, revealed that the aluminum concentration has increased substantially since 1980, coin-ciding with the warming of 1°C in the southern hemisphere (McConnell et al. 2007). his increase in dust entry into the Antarctic Peninsula is also directly related to changes in South America, especially deforestation widespread in Patagonia and northern Argentina (McConnell et al. 2007).
CONCLUSION
his paper presents the irst results on variability of trace elements concentrations (Al, Ba, Ca, Fe, K, Mg, Mn, Na, Sr and Ti) in Mount Johns ice core between 1883 and 2008. EFc and EFo analysis suggest that the main trace elements found in polar ice are originated from various sources, such
Figure 5. Na and Mg variability concentrations measured at Mount Johns ice core over a range of ten years. 90
80 70 60 50 40 30 20
0 10
14
12
10
8
6
4
2
0
2008 2007 2006 2005 2004 2003 2002 2001 2000 1999
Mg (ng/g)
as oceans and landmasses. Our results show a marked sea-sonality of mineral dust and sea spray in the trace element concentrations studied that agree with observations of previ-ous work performed on the Antarctic Peninsula and in West Antarctica. Our results also suggest that the dust concen-tration at the sampling site has increased since the 1980s, a result consistent with the increase of deforestation in South America, which would generate increased availability and transport of dust to Antarctica.
ACKNOWLEDGMENTS
This research is part of the Brazilian Antarctic Program (PROANTAR) and was financed with funds from the Conselho Nacional de Desenvolvimento Científico e Tecnológico (CNPq), project 407888/2013-6. The authors are gratefully for the participation in field-work of the colleagues Luiz Fernando M. Reis and Marcelo Arevalo.
Figure 6. Mean annual concentration proile of the Al, Fe, Mg and Ti in the upper 45 m of Mount Johns ice core. Dashed line indicate a period of decrease in the deposition these trace elements.
2010
2000
1990
1980
1970
1960
1950
1940
1930
1920
1910
1900
1890
1880
Y
ear
0
Al (ng g-1)
3 6 9
Ba (pg g-1)
0 10 20 30 40 50
Fe (ng g-1)
0 1 2 3 0 9 18 27
Mg (ng g-1)
0 10 20 30 40 50 60 Ti (pg g-1)
69.54 4.49
63.02 12.28
Albani S., Mahowald N.M., Delmonte B., Maggi V., Winckler G. 2012. Comparing modeled and observed changes in mineral dust transport and deposition to Antarctica between the Last Glacial Maximum and current climates. Climate Dynamics, 38(9-10):1731-1755.
Bigler M., Röthlisberger R., Lambert F., Stocker T.F., Wagenbach D. 2006. Aerosol deposited in East Antarctica over the last glacial cycle: Detailed apportionment of continental and sea-salt contributions. Journal of Geophysical Research, 111:D08205, doi: 10.1029/2005JD006469. Bromwich D.H. & Fogt R.L. 2004. Strong trends in the skill of the ERA-40 and NCEP/NCAR reanalyses in the high and middle latitudes of the Southern Hemisphere, 1958-2001. Journal of Climate, 17:4603-4619. Bromwich D.H., Nicolas J.P., Monaghan A.J., Lazzara M.A., Keller L.M., Weidner G.A., Wilson A.B. 2013. Central West Antarctica among the most rapidly warming regions on Earth. Nature Geoscience, 6:139-145. Burn-Nunes L.J., Vallelonga P., Loss R.D., Burton G.R., Moy A., Curran M., Hong S., Smith A.M., Edwards R., Morgan V.I., Rosman K.J.R. 2011.
REFERENCES
Seasonal variability in the input of lead, barium and indium to Law Dome, Antarctica. Geochimica et Cosmochimica Acta, 75(1):1-20.
Cufey K.M. & Paterson W.S.B. 2010. The Physics of Glaciers. 4ª ed. Oxford, Pergamon/Elsevier. 704 p.
Curran M.A.J., Ommen T.D., Morgan V. 1998. Seasonal characteristics of the major ions in the high-accumulation Dome Summit South ice core, Law Dome, Antarctica. Annals of Glaciology, 27:385-390. Delmonte B., Andersson P.S., Hansson M., Schoöberg H., Petit J.R., Basile-Doelsch I., Maggi V. 2008. Aeolian dust in East Antarctica (EPICA-Dome C and Vostok): Provenance during glacial ages over the last 800 kyr. Geophysical Research Letters, 35, L07703, doi:
10.1029/2008GL033382.
Dixon D.A., Mayewski P.A., Korotkikh E., Sneed S.B., Handley M.J., Introne D.S., Scambos T.A. 2013. Variations in snow and irn chemistry along US ITASE traverses and the efect of surface glazing.
Duce & Zoller. 1975. Atmospheric trace-metals at remote northern and southern hemisphere sites e pollution or natural? Science, 187(4171):59-61.
Fretwell P., Pritchard H.D., Vaughan D.G., Bamber J.L., Barrand N.E.,
Bell R., Bianchi C., Bingham R.G., Blankenship D.D., Casassa G., Catania G., Callens D., Conway H., Cook A.J., Corr H.F. J., Damaske D., Damm V., Ferraccioli F., Forsberg R., Fujita S., Gim Y., Gogineni P., Griggs J.A., Hindmarsh R.C.A., Holmlund P., Holt J.W., Jacobel R.W., Jenkins A., Jokat W., Jordan T., King E.C., Kohler J., Krabill W., Riger-Kusk M., Langley K.A., Leitchenkov G., Leuschen C., Luyendyk B.P., Matsuoka K., Mouginot J., Nitsche F.O., Nogi Y., Nost O.A., Popov S.V., Rignot E., Rippin D.M., Rivera A., Roberts J., Ross N., Siegert M.J., Smith A.M., Steinhage D., Studinger M., Sun B., Tinto B.K., Welch B.C., Wilson D., Young D.A., Xiangbin C., Zirizzotti A. 2013. Bedmap2: improved ice bed, surface and thickness datasets for Antarctica. The Cryosphere, 7:375-393.
Genthon C. 1992. Simulations of desert dust and sea-salt aerosols in Antarctica with a general circulation model of the atmosphere.
Tellus, 44B(4):371-389.
Ginot P., Stampli F., Stampli D., Schwikowski M., Gäggeler H.W. 2002. FELICS, a new ice core drilling system for high-altitude glaciers. Memoirs of National Institute of Polar Research, Special Issue, 56:38-48.
Guelle W., Schulz M., Balkanski Y. 2001. Inluence of the source formulation on modeling the atmospheric global distribution of sea salt aerosol. Journal of Geophysical Research,
106(D21):27509-27524.
Hawkins E., Sutton R. 2012. Time of emergence of climate signals. Geophysical Research Letters, 39(L01702), doi:
10.1029/2011GL050087.
Kaspari S., Dixon D.A., Sneed S.B., Handley M.J. 2005. Sources and transport pathways of marine aerosol species into West Antarctica.
Annals of Glaciology, 41(1):1-9.
Korotkikh E.V., Mayewski P.A., Dixon D., Kurbatov A.V., Handley J.M. 2014. Recent increase in Ba concentrations as recorded in a South Pole ice core. Atmospheric Environment,89:683-687.
Kreutz K.J., Mayewski P.A., Pittalwala I.I., Meeker L.D., Twickler M.S., Whitlow S.I. 2000. Sea level pressure variability in the Amundsen Sea region inferred from a West Antarctic glaciochemical record.
Journal of Geophysical Research, 105(D3):4047-4059.
Krinner G. & Genthon C. 2003. Tropospheric transport of continental tracers towards Antarctica under varying climatic conditions. Tellus, 55B(1):54-70.
Leeuw G., Andreas E.L., Anguelova M.D., Fairall C.W., Lewis E.R., O’Dowd C., Schulz M., Schwartz S.E. 2011. Production lux of sea spray aerosol. Reviews of Geophysics, 49(RG2001), doi: 10.1029/2010RG000349.
Legrand M. & Mayewski P. 1997. Glaciochemistry of polar cores: A review. Reviews of Geophysics, 35(3):219-243.
Lide D.R. 2005. Abundance of Elements in the Earth’s crust and in the sea. In: Lide D.R. (ed.) CRC Handbook of Chemistry and Physics. Internet Version 2005. Boca Raton, CRC Press. p. 14-17.
Mayewski P.A. & Goodwin D. 1997. International Trans-Antarctic Scientiic Expedition (ITASE) – “200 years of past Antarctic and Environmental Change”. Science and Implementation Plan. Workshop Report, Series 97-1, report from the ITASE workshop. Cambridge, 2-3 August 1996, United Kingdon, 48 pp.
Mayewski P.A., Meredith M.P., Summerhayes C.P., Turner J., Worby A., Barrett P.J., Casassa G., Bertler N.A.N., Bracegirdle T., Naveira Garabato A.C., Bromwich D., Campbell H., Hamilton G.S., Lyons W.B., Maasch K.A., Aoki S., Xiao C., Ommen T. 2009. State of the Antarctic and southern ocean climate system. Reviews of Geophysics,47(RG1003), doi: 10.1029/2007RG000231.
McConnell J.R., Aristarain A.J., Banta J.R., Edwards P.R., Simões, J.C. 2007. 20th-Century doubling in dust archived in an Antarctic
Peninsula ice core parallels climate change and desertiication in South America. PNAS, 104(14):5743-5748.
Monaghan A.J., Bromwich D.H., Chapman W., Comiso J.C. 2008. Recent variability and trends of Antarctic near-surface temperature. Journal of Geophysical Research, 113(D04105), doi: 10.1029/2007JD009094.
Mumford J.W. & Peel D. A. 1982. Microparticles, marine salts and stable isotopes in a shallow irn core from the Antarctic Peninsula.
British Antarctic Survey Bulletin, 56:37-47.
Nef P.D. & Bertler N.A.N. 2015. Trajectory modeling of modern dust transport to the Southern Ocean and Antarctica.
Journal of Geophysical Research: Atmospheres, 120, doi:10.1002/2015JD023304.
Nicolas J.P. & Bromwich D.H. 2011. Climate of West Antarctica and inluence of marine air intrusions. Journal of Climate, 24:49-67. Noone D & Simmonds I. 2004. Sea ice control of water isotope transport to Antarctica and implications for ice core interpretation. Journal of Geophysical Research, 109(D07105), doi: 10.1029/2003JD004228.
Osterberg E.C., Handley M.J., Sneed S.B., Mayewski P.A., Kreutz K.J. 2006. Continuous ice core melter system with discrete sampling for major ion, trace element, and stable isotope analysis. Environmental Science & Technology, 40(10):3355-3361.
Osterberg E.C. 2007.North Paciic late Holocene climate variability and atmospheric composition. Tese de doutorado da Universidade do
Maine, Orono, EUA, 161 pp.
Planchon F.A.M., Boutron C.F., Barbante C., Cozzi G., Gaspari V., Wolf E.W., Ferrari C.P., Cescon P. 2002. Changes in heavy metals in Antarctic snow from Coats Land since the mid-19th
to the late-20th century. Earth and Planetary Science Letters,
200(1-2):207-222.
Prospero J.M., Ginoux P., Torres O., Nicholson S.E., Gill T.E. 2002. Environmental characterization of global sources of atmospheric soil dust identiied with the Nimbus 7 total ozone mapping spectrometer (TOMS) absorbing aerosol product. Reviews of Geophysics, 40(1), doi: 10.1029/2000RG000095.
Röthlisberger R., Bigler M., Hutterli M., Sommer S., Staufer B., Junghans H., Wagenbach D. 2000. Technique for continuous high-resolution analysis of trace substances in irn and ice cores.
Environmental Science & Technology, 34(2):338-342.
Schneider D.P., Steig E.J., Ommen T.D., Dixon D.A., Mayewski P.A., Jones J.M., Bitz C.M. 2006. Antarctic temperatures over the past two centuries from ice cores. Geophysical Research Letters, 33(L16707),
doi: 10.1029/2006GL027057.
Schneider D.P., Steig E.J. 2008. Ice cores record signiicant 1940s Antarctic warmth related to tropical climate variability. PNAS, 105(34):12154-12158.
Simões J.C. 2004. Glossário da língua portuguesa da neve, gelo e termos correlatos. Pesquisa Antártica Brasileira, 4(119-154).
Simões J.C. 2011. O ambiente antártico: domínio de extremos. In: Simões J.C., Garcia C.A.E., Evangelista H., Campos L.S., Mata M.M., Bremer U.F. (eds). Antártica e as Mudanças Globais: um desaio para a humanidade. São Paulo, Edgard Blucher, p. 15-27.
Steig E.J., Mayewski P.A., Dixon D.A., Kaspari S.D., Frey M.M., Schneider D.P., Arcone S.A., Hamilton G.S., Spikes V.B., Albert M., Meese D., Gow A.J., Shuman C.A., White J.W.C., Sneed S., Flaherty J., Wumkes M. 2005. High-resolution ice cores from US ITASE (West Antarctica): development and validation of chronologies and determination of precision and accuracy.
Annals of Glaciology, 41:77-84.
Steig E.J., Schneider D.P., Rutherford S.D., Mann M.E., Comiso J.C., Shindell D.T. 2009. Warming of the Antarctic ice-sheet surface since the 1957 International Geophysical Year. Nature, 457:459-462, doi: 10.1038/nature07669.
Tao G., Yamada R., Fujikawa Y., Kudo A., Zheng F., Fisher D.A., Koerner R.A. 2001. Determination of trace amounts of heavy metals in Arctic ice core samples using inductively coupled plasma mass spectrometry. Talanta, 55(4):765-772.
Thompson L.G. 1975. Variations in microparticle concentration, size distribution and elemental composition found in Camp Century,
Greenland, and Byrd station, Antarctica, deep ice cores. In: Isotopes
and Impurities in Snow and Ice. IAHS Publ., n. 118, p. 351-364. Turner J. 2004. Review: The El Ñino-Southern oscillation and Antarctica. International Journal of Climatology, 24:1-31.
Turner J., Lachlan-Cope T.A., Colwell S., Marshall G.J., Connolley W.M. 2006. Signiicant warming of the Antarctic winter troposphere.
Science, 311(5769):1914-1917.
Wedepohl K.H. 1995. The composition of the continental crust.
Geochimicaet Cosmochimica Acta,59(7):1217-1232.
Weller R., Woltjen J., Piel C., Resenberg R., Wagenbach D., Konig-Langlo G., Kriews M. 2008. Seasonal variability of crustal and marine trace elements in the aerosol at Neumayer station, Antarctica.
Tellus, 60B(5):742-752.