www.ocean-sci.net/12/19/2016/ doi:10.5194/os-12-19-2016
© Author(s) 2016. CC Attribution 3.0 License.
Factors favouring phytoplankton blooms in the northern Adriatic:
towards the northern Adriatic empirical ecological model
R. Kraus, N. Supi´c, and R. Precali
Center for Marine Research, Rudjer Boškovi´c Institute, Rovinj, Croatia
Correspondence to:N. Supi´c (supic@cim.irb.hr)
Received: 18 May 2015 – Published in Ocean Sci. Discuss.: 25 June 2015
Revised: 30 November 2015 – Accepted: 4 December 2015 – Published: 15 January 2016
Abstract. Influenced by one of the largest Mediterranean rivers, Po, the northern Adriatic (NA) production is highly variable seasonally and interannually. The changes are espe-cially pronounced between winters and seemingly reflect on total Adriatic bioproduction of certain species (anchovy). We analysed the long-term changes in the phytoplankton produc-tion in the region, as derived from monthly oceanographic cruises, in relation to concomitant geostrophic currents dis-tribution in the area and to Po River discharge rates in days preceding the cruises. In winter and early spring the phyto-plankton abundances depended on existing circulation fields, in summer and autumn they were related to Po River dis-charge rates 1–15 days earlier and on concomitant circula-tion fields, while in late spring phytoplankton abundances increased 1–3 days after high Po River discharge rates re-gardless of the circulation fields. During the entire year the phytoplankton abundances were dependent on forcing of the previous 1–12 months of surface fluxes and/or Po River rates. The role of wind was uncertain but that was partly due to un-matched sampling time frames between meteorological and sea data. Low evaporation rates in November reflected sig-nificantly on the next February circulation pattern and, al-though with somewhat lower significance, on large phyto-plankton blooms in the same month. We showed that the role of wind in evaporative flux enhancements is not straightfor-ward as evaporative fluxes are highly dependent on other fac-tors, e.g. air–sea temperature difference. Wind-induced ver-tical mixing was only sporadically related to phytoplankton abundances. From 1990 to 2004 a shift towards large winter bioproduction induced by circulation changes appeared. The investigations performed represent the preliminary actions in the construction of an empirical ecological model of the NA which can be used in the sustainable economy of the region,
as well as for validation of the numerical ecological model of the region, which is currently being developed.
1 Introduction
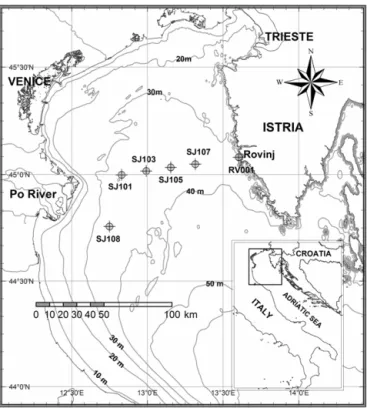
The relatively shallow and restricted area of the northern Adriatic (NA) is held to be one of the most productive regions of the Mediterranean Sea (e.g. Sournia, 1973). However, its productivity is high only when influenced by the Po River, one of the largest Mediterranean rivers, with delta located in the western part of the NA (Fig. 1). Otherwise, the re-gion is under impact of oligotrophic central Adriatic waters. Therefore, the seasonal and interannual variability in the NA organic production is very high (e.g. Sournia, 1973). Kraus and Supi´c (2011) hypothesised that interannual changes in the NA winter (February) primary production reflect on the secondary production of the entire Adriatic. The hypothesis was based on significant correlations between the intensity of phytoplankton blooms in the NA and the total Adriatic catch of one of its most important commercial fishes, anchovy,
En-graulis encrasicolus(L.). Interestingly, and in spite of
gener-ally oligotrophic trends documented for the region (Mozetiˇc et al., 2010; Djakovac et al., 2012; Mari´c et al., 2012), the an-chovy population between 1990 and 2004 increased, follow-ing the positive trends in winter nutrients and phytoplankton abundances in the NA (Djakovac et al., 2010).
Figure 1.Map of the NA with sampling stations.
2006; Supplement 1). Although wind-induced currents of the region are pronounced (e.g. Kuzmi´c et al., 2007; Cosoli et al., 2012), the geostrophic component presumably plays a major role in redistributing freshened waters and organic/inorganic substances across the NA.
Based on the calculation of average monthly geostrophic fields, it was shown that in the stratified period the Po River waters spread around the NA, while in the unstratified pe-riod these waters are confined to the western coast (Franco and Michelato, 1992; Cushman-Roisin et al., 2001; Kraj-car, 2003). They filled an anticyclonic gyre east of the Po River delta which gradually became larger and reached the Istrian coast in summer. However, the more detailed anal-yses of geostrophic fields showed that interannual variabil-ity in current fields is large and there are summers with the low Po River impact and winters with high Po River impact (e.g. Grilli et al., 2005; Kraus and Supi´c, 2011). Namely, the geostrophic circulation of the NA consists of several gyres, which can persist in the region for a longer time period (e.g. Supi´c et al., 2012). Their position and extent is changeable and differs from year to year. They can be filled with fresh-ened waters of the Po River so that within them the accumu-lation of nutrients and organic matter takes place (e.g. Or-li´c et al., 2013). It is within them where the hypoxia and anoxia events develop (e.g. Djakovac et al., 2015). Espe-cially, a large amount of the Po River waters can be drawn into the NA when an anticyclonic gyre appears at a large dis-tance from the delta at the opposite side of the basin, off the eastern (Istrian) coast. Presence of the gyre is indicated by a
current of southern direction in the coastal zone, the Istrian Coastal Countercurrent (ICCC; Supi´c et al., 2003). Long-term changes in the intensity of the ICCC were found to be related to long-term changes in nutrients (Djakovac et al., 2012), phytoplankton (Kraus and Supi´c, 2011; Mari´c et al., 2012) or even large quantities of the mucilaginous material appearing sporadically in the NA (e.g. Supi´c et al., 2000). Fi-nally, it was shown that the geostrophic fields formed in au-tumn can remain unchanged for several months and persist even during severe wind forcing (Supi´c et al., 2012). Win-ter circulation patWin-tern afWin-ter prevailingjugoepisodes in the
autumn favoured the Po River spreading, while the one af-ter prevailing autumnalboraepisodes did not. This finding
implied that the prognosis of the NA circulation fields is pos-sible, to a certain extent.
The Po River discharge rate has a pronounced seasonal cycle with a maximum in spring or autumn (e.g. Supi´c and Orli´c, 1999). The flow rate is modulated by the precipitation regime and additionally, in spring and summer, is enhanced by snow melting (Cushman-Roisin et al., 2001). A signifi-cant additional contribution in summer is from precipitation in the Alps, which is at its yearly maximum in this period of the year. Daily variations in rates are significant and within short pulses a large amount of fresh water can be injected into the NA. Recently, around 2000, a drastic reduction in the Po River rates was observed with consequences on the marine environment (e.g. Djakovac et al., 2012; Giani et al., 2012). However, the changes in the Adriatic environment can be induced by changes in other factors, as the inversion of the Ionian Sea circulation (Civitarese at al., 2010).
The presence of a large quantity of nutrient-rich waters from the Po River is crucial for the large bioproduction in the region. We hypothesised, thus, that the degree of the bio-production directly depends on the geostrophic circulation fields and intensity of the Po River discharge. Due to pro-nounced seasonal component in circulation fields and Po dis-charge rates we suppose that the importance of the two fac-tors, which modulate the interannual variations in concentra-tions of organic matter produced in the NA, changes from month to month.
The effect of vertical motions in the water column (intense in conditions of low stratification and weak when the wa-ter column is highly stratified) on phytoplankton abundances was investigated via analysis of stratification degree for each month separately.
Wind, inducing changes in air–sea fluxes (of heat, moist and impulse), indirectly affects horizontal and vertical mo-tions in water column. In that way, winds reflect on phyto-plankton abundances, dependent on sea dynamics. In order to find out whether it is possible to relate winds of certain strength and direction to the increase in phytoplankton abun-dances we performed a descriptive analysis of winds preced-ing measurements of large or low phytoplankton abundances. In addition, we tried to relate the appearance of the large blooms to the surface fluxes and Po River rates of the pre-vious periods, up to a year before sampling, to investigate whether phytoplankton production of the NA is, at least to a certain point, predictable.
In our analysis we used log-transformed phytoplankton data in addition to original values, which enabled us to dis-cern the major processes characterising the region from the occasional events, respectively.
2 Materials and methods 2.1 Data sets
We analyse three sets of data: (1) oceanographic data includ-ing temperature, salinity and phytoplankton (in the size range 20–200 µm) collected monthly or seasonally at six stations in the transect between the Po River delta and Rovinj (Fig. 1); (2) monthly averages of meteorological and SST (sea surface temperature) data collected at three locations in the NA (Tri-este, Rovinj and Mali Lošinj; Fig. 1); and (3) daily values of the Po River rates. The oceanographic data set covers the 1990–2004 period and the other two sets also cover the year 1989. At each station of the profile, temperature and salinity data were obtained at five standard depths (0, 5, 10, 20 and 30 m). The phytoplankton samples were taken at five stan-dard depths at the Po River delta–Rovinj transect, at stations SJ108, SJ101 and SJ107, and at three standard depths (0, 10 and 30 m) at SJ103, SJ105 and RV001. The oceanographic data set used is described in more detail in our previous pa-per (Kraus and Supi´c, 2011).
Temperature was measured by protected reversing thermometers (Richter and Wiese, Berlin, precision
±0.01◦C), while salinity was determined by using a
high-precision laboratory salinometer (RBR Precision Instruments Microsalinometer-310, precision ±0.01).
Phy-toplankton abundance and composition were determined at 200× magnification in 100 random fields of vision (if
necessary, 50, 200 or 400 depending on the sample density) after 40 h sedimentation of a 50 ml subsample by an inverted
microscope, Zeiss Axiovert 200, using the Utermöhl settling technique (1958).
2.2 Surface fluxes
Monthly values of the NA surface heat flux discussed here include total downward heat (Q; Wm−2)and water fluxes
(W; mm d−1) from the atmosphere into the sea and three
of their components, namely the fluxes due to insolation (Qs; Wm−2), evaporation (E; mm d−1)and precipitation (P;
mm d−1). The fluxes for the 1989–2004 period were
com-puted from monthly means of the atmospheric data and SST, supplied by the Hydrometeorological Institute in Zagreb, as discussed in more details by Kraus and Supi´c (2011) and Supi´c et al. (2012).
2.3 Geostrophic currents
Temperature and salinity data were used to compute sur-face geostrophic currents relative to 30 m depth between each pair of neighbouring stations at the Po River delta–Rovinj transect (i.e. at SJ108/SJ101, SJ101/SJ103, SJ103/SJ105, SJ105/SJ107 and SJ107/RV001) by means of a standard dy-namical method (e.g. Supi´c et al., 2000). The currents are positive when they mark an inflow in the NA and the ICCC is the current at SJ107/RV001, with a negative sign.
2.4 Phytoplankton abundance
The phytoplankton analyses were performed with original and transformed (log10) phytoplankton abundances. The seasonal cycle of the phytoplankton was additionally pre-sented by geometrical means. The average phytoplankton abundance of the water column of each station at the tran-sect aSTAT (STAT=SJ108, SJ101, SJ105, SJ103, SJ107 or
RV001) was computed for each cruise in the 1990–2004 pe-riod, using data collected at 0, 5, 10, 20 and 30m (SJ108, SJ101 and SJ107) or at 0, 5 and 3 m (SJ103, SJ105 and RV001). It was assumed (1) that the bottom depth is equal to 30 m; that (2) the abundances within layers 0–2.5, 2.5– 7.5, 7.5–15, 15–25 and 25–30 m at SJ108, SJ101 and SJ107 can be approximated by the abundances sampled at 0, 5, 10, 20 and around 30 m, respectively; and that (3) the abun-dances within layers 0–5, 5–20, and 20–30 m at SJ103, SJ105 and RV001 can be approximated by the abundances sampled at 0, 10 and 30 m, respectively. Values for aS-TAT were then computed according to the formula aSaS-TAT=
1/30Pl=l=30 m0 m a(STAT, l);l=0, 1, ..., 30 m; a(STAT,l) –
phy-toplankton abundances at station STAT at levell.
2.5 Principal component analysis (PCA)
sta-tions between the Po River delta and Rovinj in the 1990– 2004 period. Furthermore, the first main component of the long-term changes in surface geostrophic currents relative to 30 m between six stations (at SJ108/SJ101, SJ101/SJ103, SJ103/SJ105, SJ105/SJ107 and SJ107/RV001) for each month was extracted (cPC1). Interannual variability in it is given by the PC1 “scores”. PCA was performed using the PRIMER (Plymouth Routines In Multivariate Ecological Re-search) v.5 software package.
2.6 Po River discharge
Daily values of the Po River discharge rate were derived from data collected at station Pontelagoscuro. The data were sup-plied by the Assessorato Programmazione, Piafinicazione e Ambiente of the Emilia Romagna region (Italy). Monthly means were computed and used in further computations. For purposes of preconditioning analyses, we used Po River dis-charge rates with various time lags (1, 3 and 15 days).
2.7 Wind data
Daily values of wind data for November in 1993, 1998, 1999, 2001, 2003 and 2004; for February in 2003 and 2004; and for July in 1997, 2000 and 2001 were supplied by the Hydrome-teorological Institute in Zagreb. Assessments of wind values (in Beaufort scale numbers) were obtained three times a day at the Pula (44◦51′56′′N, 13◦50′46′′E, 43 m above the sea
level) station.
2.8 Stratification degree
The stratification degree for the stations (SJ107 and SJ108) and each cruise (1σt)was defined as the difference between
bottom and surface density.
3 Results
3.1 Circulation at the transect 3.1.1 General circulation patterns
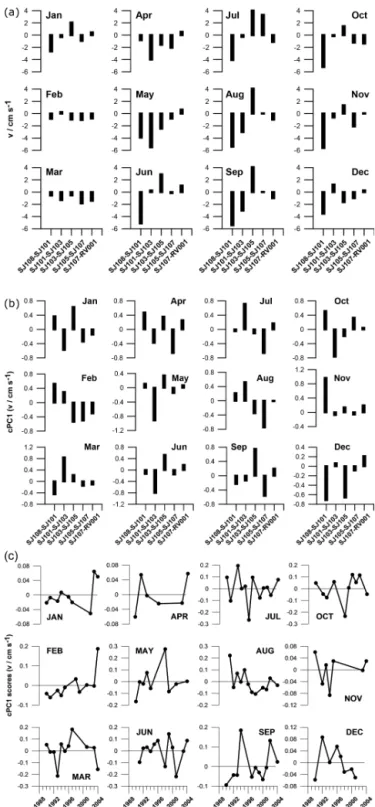
Average monthly values show several typical circulation pat-terns across the Po River delta–Rovinj transect (Fig. 2a). Currents are generally stronger in warmer (April–October) parts of the year. In January, as in the previous November and December, there are several circulation cells across the profile: there is an outflow near the western coast and in the open waters of the eastern part of the transect along with the inflow in the middle part of the profile and near the east-ern coast. From February to May the outflow prevails over the inflow across the profile. Weak inflow appears near the eastern coast in April and is present throughout spring, until June. But in June, circulation in the middle part of the tran-sect drastically changes as very strong currents appear there. The pronounced inflow in the middle part of the profile is
Figure 2.Monthly averages(a), cPC1 loadings(b)and cPC1 scores
(c)of geostrophic currents relative to 30 dbar between stations of the Po River delta–Rovinj profile for the 1990–2004 period.
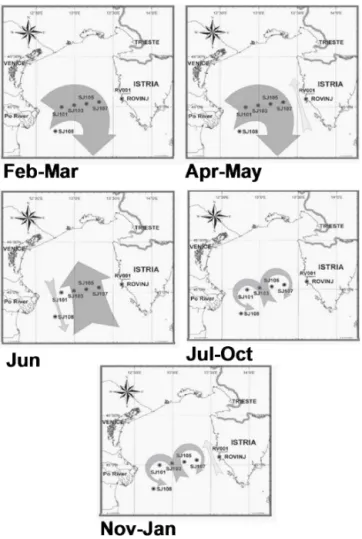
Figure 3.NA circulation patterns as hypothesised from average sur-face geostrophic currents relative to 30 dbar in 1990–2004 between neighbouring stations at the Po River delta–Rovinj profile. Istrian Coastal Countercurrent (ICCC) at SJ107/RV001 directed towards SE.
According to the average circulation patterns, mainly three typical current distributions exist (Fig. 3): the first one indi-cates the presence of two large gyres, a cyclonic and an anti-cyclonic one, with an inflow in the middle part of the transect (Fig. 3). This one is typical during most of the year, namely from July to January. From November to January this pat-tern is modified by an inflow along the Istrian coast. From February to May, which is from winter to early spring, the circulation is a large anticyclonic gyre with waters from the Po River spreading across the NA. In April–May a weak in-flow appears near the Istrian coast. And only in one month (June) do the typical circulation patterns reveal the presence of a cyclonic gyre across the transect.
The cPC1 explains between 40 and 70 % of the total vari-ance in the fields of surface geostrophic currents across the Po River delta–Rovinj transect (Fig. 2b). The lowest val-ues, around 40 %, are obtained in summer (July and Au-gust) and the highest ones, around 70 %, in winter
(Febru--2 -1 0 1 2 3 -8 -6 -4 -2 0 2 v ( IC C C ) / cm s -1
19881992199620002004 -8 -4 0 4 -4 -2 0 2 4 -6 -4 -2 0 2 4 6
19881992199620002004 -8 -4 0 4 8 -12 -8 -4 0 4 8 -12 -8 -4 0 4 8
19881992199620002004 -12 -8 -4 0 4 8 -8 -6 -4 -2 0 2 4 -4 -2 0 2 4 6
19881992199620002004 -4 -2 0 2 4 Jan Feb Mar Apr May Jun Jul Aug Sep Oct Nov Dec
Figure 4.Geostrophic currents relative to 30 dbar between stations SJ107 and RV001 in the 1990–2004 period for each month in a year. The ICCC is current of negative sign.
ary and March) and spring (May). Changes in the circulation patterns, as given by the first PCA mode, for most months are driven by the changes in the middle part of the profile. Only in November and December do changes near the west-ern coast play the main role in year-to-year changes of the circulation patterns. During the 1990–2004 period, trends in circulation patterns were, apparently, more pronounced only in February (positive) and August (negative; Fig. 2c).
3.1.2 The Istrian Coastal Countercurrent – ICCC In the 1990–2004 period, geostrophic currents at RV001/SJ107 were up to around 10 cm s−1 (Fig. 4). In
the winter period negative trends, indicating increased recurrence of the ICCC, prevailed. In contrast, in spring and summer trends were positive, indicating lower recurrence of the ICCC.
3.2 Po River rates
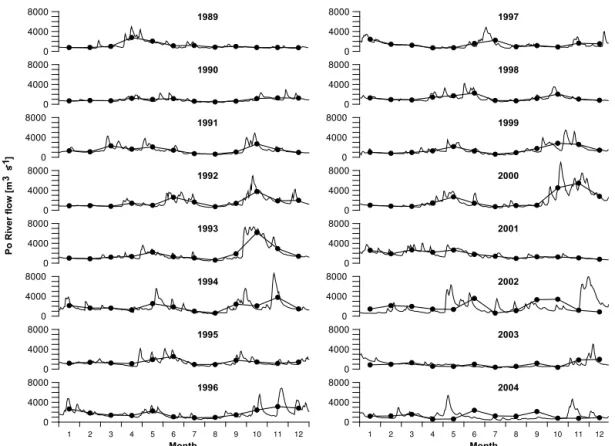
The seasonal cycle from 1989 to 2004 shows (Fig. 5) that Po River rates are predominantly high in spring and autumn, with marked daily oscillations. In some years (1990, 1995, 2001 and 2003) the rates were considerably lower during the entire year.
3.3 Evaporation and precipitation
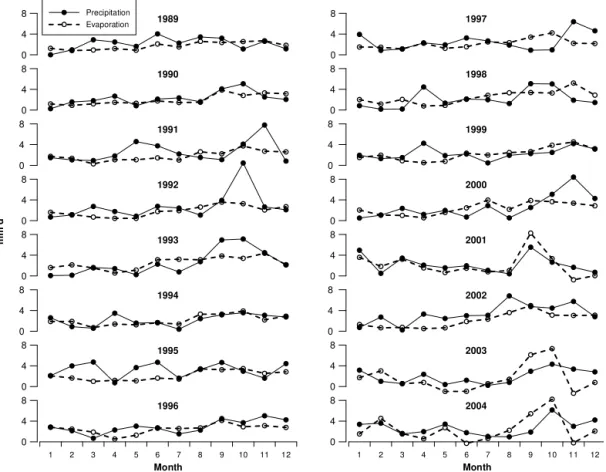
Precipitation generally prevails over evaporation (Fig. 6). While precipitation oscillates throughout the entire year, the evaporation is generally higher and more variable from September to December.
3.4 Seasonal phytoplankton cycle
1 2 3 4 5 6 7 8 9 10 11 12 Month 0 4000 8000 0 4000 8000 0 4000 8000 0 4000 8000 0 4000 8000 0 4000 8000 0 4000 8000 0 4000 8000
1 2 3 4 5 6 7 8 9 10 11 12
Month 0 4000 8000 0 4000 8000 0 4000 8000 0 4000 8000 0 4000 8000 0 4000 8000 0 4000 8000 0 4000 8000 1989 1990 1991 1992 1993 1994 1995 1996 1997 1998 1999 2000 2001 2002 2003 2004 Po R iv er fl ow [m s ] 3 -1
Figure 5.Daily Po River flow (thin line) with monthly averages (thick line with dots) in the analysed years (1989–2004).
and transformed data collected over the 1990–2004 period (Fig. 7). Original data (not shown) indicate west-to-east and surface-to-bottom decreasing gradients during the February– October period, with the vertical gradient more pronounced from the horizontal one. At the eastern part, the vertical gra-dient is pronounced only during several months (February– March and October), whereas in the west it is common (dur-ing entire period February–October). Abundances in the wa-ter column are mostly uniform during the rest of the year (November–January). Both horizontal and vertical gradients are more emphasized when the seasonal cycle is based on the transformed data (Fig. 7). High abundances from February to September are restricted to the western part of the transect, spreading in some months in a rather thin surface layer to the middle of the transect and only occasionally more closely to the eastern parts. Only in October and November does a uni-form vertical gradient over the entire transect present. In the remaining winter months (December–January) phytoplank-ton is completely uniform over the entire transect.
The PC1 explains between 40 and 90 % of total variance of original phytoplankton data (Fig. 8a) and between 40 and 70 % of the total variance of transformed phytoplankton data (Fig. 8b). The lowest values, around 40 %, are obtained in spring (June) and autumn (September) for original data and in spring–summer (from June to August) for transformed data, while the highest values, around 90 %, are obtained in
May, July and October for original data, and around 70 %, in March and December for transformed data.
Changes in the seasonal phytoplankton cycle, as given by the first pPC1 mode which was based on the original data, are from January to August driven by changes in the western or west–middle part of the profile, in September in the western and east–middle part, in October only in east– middle part, while from November to December changes were rather spread over the entire profile (Fig. 8a). All mentioned changes, except November and December, were driven in the surface to upper layer. First, the lpPC1 mode, which was based on the transformed data, indicated that the changes in the seasonal phytoplankton cycle were driven throughout the entire year in widespread west–middle, mid-dle and east–midmid-dle parts of the profile (Fig. 8b). Addition-ally, over the year changes occur in February in the western part, in March in the eastern part, in May–June in the western part, in July in both western and eastern parts, in November in the eastern part and in December again in both western and eastern parts of the profile. The impact was mostly through-out the entire water column.
1 2 3 4 5 6 7 8 9 10 11 12
Month
0 4 8 0 4 8 0 4 8 0 4 8 0 4 8 0 4 8 0 4 8 0 4 8
1 2 3 4 5 6 7 8 9 10 11 12
Month
0 4 8 0 4 8 0 4 8 0 4 8 0 4 8 0 4 8 0 4 8 0 4
8 Precipitation
Evaporation 1989
1990
1991
1992
1993
1994
1995
1996
1997
1998
1999
2000
2001
2002
2003
2004
m
m
d
-1
Figure 6.Monthly averages of precipitation (full line with black dots) and evaporation (dashed line with white dots) at the Po River delta– Rovinj profile in the analysed years (1989–2004).
on both original and transformed data showed an increase in the trend and a distinct decrease in December. Other months showed slight or no trends at all.
3.5 Pressures forcing phytoplankton
The influence of geostrophic currents, ICCC and Po River flow in the original and transformed phytoplankton data at the complete Po River delta–Rovinj transect, as well as at each of the stations along the transect, was analysed. The highest impact of circulation on the phytoplankton occurs during winter (January–February), early spring (March) and in autumn (September; Table 1). In January, the impact is restricted to the western (SJ101) and eastern parts (SJ107 and RV001); however, in February it spread to the middle of the transect (SJ103). Correlations based on non-transformed pPC1 data show that the circulation during January and February affect the phytoplankton through the entire tran-sect, and the one based on lcPC1 is limited to specific sta-tions (SJ101 and SJ107). Correlation observed for March in-dicates the impact of currents on the phytoplankton at SJ101 and also in the entire transect (lpPC1). During April, May and June, the impact of currents is noticed sporadically over the transect, while in August the circulation impact is
prac-tically non-existent. Interestingly, September phytoplankton is strongly impacted by the currents, from the middle to the eastern part of the transect (SJ105, SJ107 and RV001), and also in the entire transect (lpPC1). More specifically, the im-pact of the ICCC (Table 1) on the phytoplankton was ac-knowledged in January and February, as a part of the com-plete circulation pattern, and in July and October, where the ICCC impact does not reflect the complete circulation of the transect, while in September no impact of the ICCC over the complete circulation pattern was established.
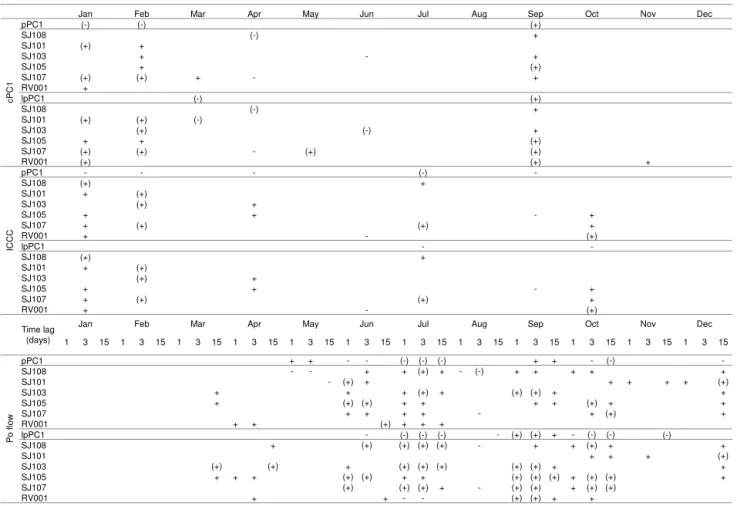
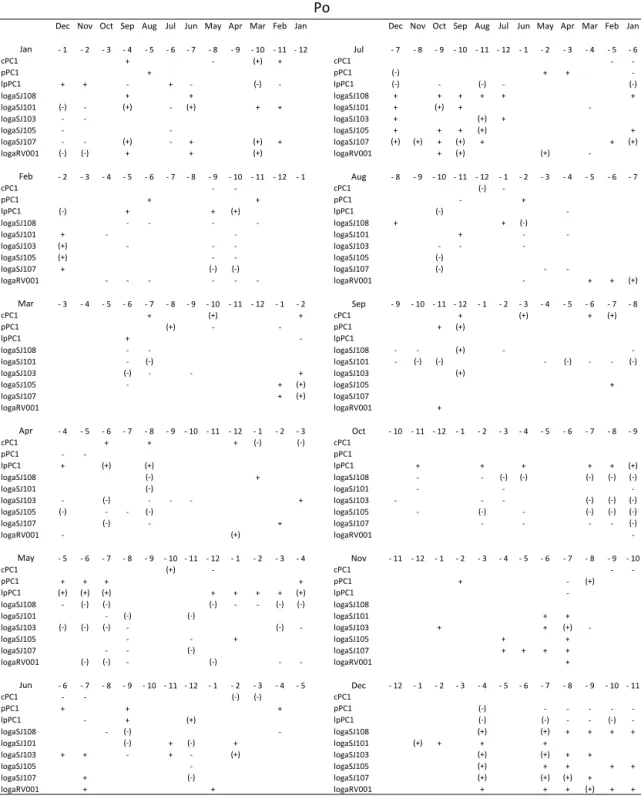
phyto-Table 1.Positive (+) or negative (−) correlation between changes in phytoplankton abundance (pPC1 scores or average water column values at SJ108, SJ101, SJ103, SJ105, SJ107 and RV001) during 1990–2004 and changes in (i) cPC1 scores, (ii) the ICCC and (iii) Po flow discharge rates 1, 3 and 15 days before the PA sampling, for original and log data. The signs and signs in parentheses indicate significances of 80 and 95 %, respectively.
pPC1 SJ108 SJ101 SJ103 SJ105 SJ107 RV001 lpPC1 SJ108 SJ101 SJ103 SJ105 SJ107 RV001 pPC1 SJ108 SJ101 SJ103 SJ105 SJ107 RV001 lpPC1 SJ108 SJ101 SJ103 SJ105 SJ107 RV001
1 3 15 1 3 15 1 3 15 1 3 15 1 3 15 1 3 15 1 3 15 1 3 15 1 3 15 1 3 15 1 3 15 1 3 15
pPC1 + + - - (-) (-) (-) + + - (-)
-SJ108 - - + + (+) + - (-) + + + + +
SJ101 - (+) + + + + + (+)
SJ103 + + + (+) + (+) (+) + +
SJ105 + (+) (+) + + + + (+) + +
SJ107 + + + + - + (+) +
RV001 + + (+) + + +
lpPC1 - (-) (-) (-) - (+) (+) + - (-) (-) (-)
SJ108 + (+) (+) (+) (+) - + + (+) + +
SJ101 + + + (+)
SJ103 (+) (+) + (+) (+) (+) (+) (+) + +
SJ105 + + + (+) (+) + + (+) (+) (+) + (+) (+) +
SJ107 (+) (+) (+) + - (+) (+) + (+) (+)
RV001 + + - - (+) (+) + +
Dec
Jan Feb Mar Apr May Jun Jul Aug Sep
+ (+) + + -Nov Oct (+) (-) (+) (-) (-) (+) (-) + + (-) + (+) (-) (+) + - + + (+) (-) -+ (+) (+) + + (+) (+) (+) + - - -+ (+) (+) + + + + -+ (+) (+) + + - (+) + (+) (+) + -+ (+) (+) + + + - + (+) + Dec
Jun Jul Aug Sep
- (+) Oct Nov Time lag (days) Apr cPC 1 ICCC P o f low Jan (-) (+) (+) May + (+) (+) - (+) Feb Mar +
plankton abundance in the entire NA as the freshwater influ-ence reaches the eastern part as well.
The Po River impact on the phytoplankton is quite com-plementary to already described circulation forcing (Table 1). Typically, postponed (14-day delay) Po River impact which is restricted in March and April to the middle of the transect is followed by a more immediate (1- and 3-day delay) impact in June. The only month when extreme Po flow influenced phytoplankton was in June when riverine impact widens over the transect (westwards to SJ101 and eastwards to RV001). July is characterized by immediate and postponed high im-pact of the Po River over the transect. This imim-pact disappears during August and is again strongly established in September and October, by immediate and postponed flow. Impact dur-ing November and December is only of postponed character; however, in November it spreads along the transect while in December it is restrained to the eastern station, SJ101.
The correlations between the phytoplankton (non-transformed pPC1 and (non-transformed data – lpPC1) or currents (cPC1) and monthly averages of the Po River discharge
(Ta-ble 2a), precipitation (Ta(Ta-ble 2b) or evaporation (Ta(Ta-ble 2c) of the previous period are presented with different time lags (with 1–12 months ahead).
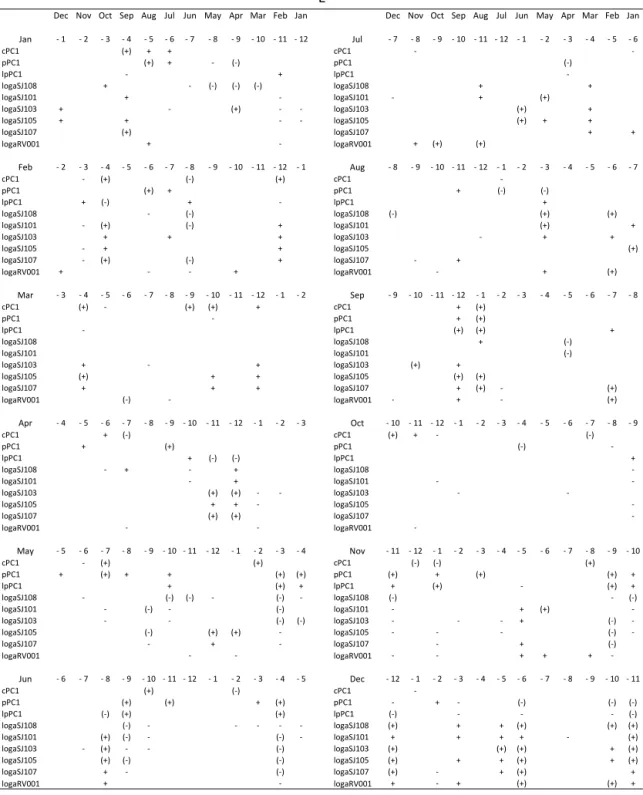
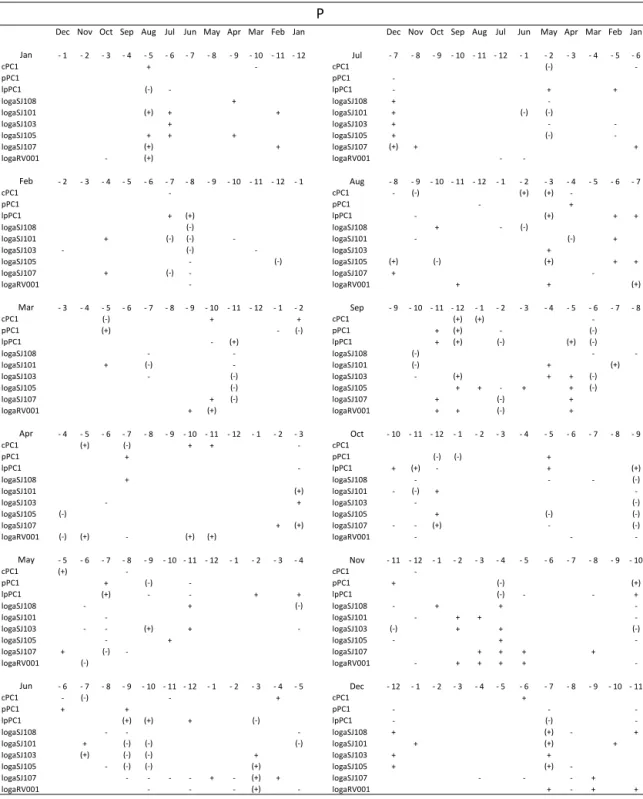
Table 2.Positive (+) or negative (−) correlation between changes in geostrophic currents (cPC1 scores)/phytoplankton original values (pPC1 scores)/transformed values (lpPC1 scores)/transformed average water column phytoplankton values at SJ108, SJ101, SJ103, SJ105, SJ107 and RV001 during 1990–2004 and changes in surface fluxes, evaporation (E) and precipitation (P) and Po River rates (Po) in preceding month. The time lags are between 1 and 12. The signs and signs in parentheses indicate significances of 80 and 95 %, respectively.
Dec Nov Oct Sep Aug Jul Jun May Apr Mar Feb Jan Dec Nov Oct Sep Aug Jul Jun May Apr Mar Feb Jan
Jan - 1 - 2 - 3 - 4 - 5 - 6 - 7 - 8 - 9 - 10 - 11 - 12 Jul - 7 - 8 - 9 - 10 - 11 - 12 - 1 - 2 - 3 - 4 - 5 - 6
cPC1 (+) + + cPC1 -
-pPC1 (+) + - (-) pPC1 (-)
lpPC1 - + lpPC1
-logaSJ108 + - (-) (-) (-) logaSJ108 + +
logaSJ101 + - logaSJ101 - + (+)
logaSJ103 + - (+) - - logaSJ103 (+) +
logaSJ105 + + - - logaSJ105 (+) + +
logaSJ107 (+) logaSJ107 + +
logaRV001 + - logaRV001 + (+) (+)
Feb - 2 - 3 - 4 - 5 - 6 - 7 - 8 - 9 - 10 - 11 - 12 - 1 Aug - 8 - 9 - 10 - 11 - 12 - 1 - 2 - 3 - 4 - 5 - 6 - 7
cPC1 - (+) (-) (+) cPC1
-pPC1 (+) + pPC1 + (-) (-)
lpPC1 + (-) + - lpPC1 +
logaSJ108 - (-) logaSJ108 (-) (+) (+)
logaSJ101 - (+) (-) + logaSJ101 (+) +
logaSJ103 + + + logaSJ103 - + +
logaSJ105 - + + logaSJ105 (+)
logaSJ107 - (+) (-) + logaSJ107 - +
logaRV001 + - - + logaRV001 - + (+)
Mar - 3 - 4 - 5 - 6 - 7 - 8 - 9 - 10 - 11 - 12 - 1 - 2 Sep - 9 - 10 - 11 - 12 - 1 - 2 - 3 - 4 - 5 - 6 - 7 - 8
cPC1 (+) - (+) (+) + cPC1 + (+)
pPC1 - pPC1 + (+)
lpPC1 - lpPC1 (+) (+) +
logaSJ108 logaSJ108 + (-)
logaSJ101 logaSJ101 (-)
logaSJ103 + - + logaSJ103 (+) +
logaSJ105 (+) + + logaSJ105 (+) (+)
logaSJ107 + + + logaSJ107 + (+) - (+)
logaRV001 (-) - logaRV001 - + - (+)
Apr - 4 - 5 - 6 - 7 - 8 - 9 - 10 - 11 - 12 - 1 - 2 - 3 Oct - 10 - 11 - 12 - 1 - 2 - 3 - 4 - 5 - 6 - 7 - 8 - 9
cPC1 + (-) cPC1 (+) + - (-)
pPC1 + (+) pPC1 (-)
-lpPC1 + (-) (-) lpPC1 +
logaSJ108 - + - + logaSJ108
-logaSJ101 - + logaSJ101 -
-logaSJ103 (+) (+) - - logaSJ103 -
-logaSJ105 + + - logaSJ105
-logaSJ107 (+) (+) logaSJ107
-logaRV001 - - logaRV001
-May - 5 - 6 - 7 - 8 - 9 - 10 - 11 - 12 - 1 - 2 - 3 - 4 Nov - 11 - 12 - 1 - 2 - 3 - 4 - 5 - 6 - 7 - 8 - 9 - 10
cPC1 - (+) (+) cPC1 (-) (-) (+)
pPC1 + (+) + + (+) (+) pPC1 (+) + (+) (+) +
lpPC1 + (+) + lpPC1 + (+) - (+) +
logaSJ108 - (-) (-) - (-) - logaSJ108 (-) - (-)
logaSJ101 - (-) - (-) logaSJ101 - + (+)
-logaSJ103 - - (-) (-) logaSJ103 - - - + (-)
-logaSJ105 (-) (+) (+) - logaSJ105 - - - (-)
-logaSJ107 - + - logaSJ107 - + (-)
logaRV001 - - logaRV001 - - + + +
-Jun - 6 - 7 - 8 - 9 - 10 - 11 - 12 - 1 - 2 - 3 - 4 - 5 Dec - 12 - 1 - 2 - 3 - 4 - 5 - 6 - 7 - 8 - 9 - 10 - 11
cPC1 (+) (-) cPC1
-pPC1 (+) (+) + (+) pPC1 - + - (-) (-) (-)
lpPC1 (-) (+) (+) lpPC1 (-) - - - (-)
logaSJ108 (-) - - - logaSJ108 (+) + + (+) (+) (+)
logaSJ101 (+) (-) - (-) - logaSJ101 + + + + - (+)
logaSJ103 - (+) - - (-) logaSJ103 (+) (+) (+) + (+)
logaSJ105 (+) (-) (-) logaSJ105 (+) + + (+) + (+)
logaSJ107 + - (-) logaSJ107 (+) - + (+) +
logaRV001 + - logaRV001 + - + (+) (+) +
Table 2.Continued.
Dec Nov Oct Sep Aug Jul Jun May Apr Mar Feb Jan Dec Nov Oct Sep Aug Jul Jun May Apr Mar Feb Jan
Jan - 1 - 2 - 3 - 4 - 5 - 6 - 7 - 8 - 9 - 10 - 11 - 12 Jul - 7 - 8 - 9 - 10 - 11 - 12 - 1 - 2 - 3 - 4 - 5 - 6
cPC1 + - cPC1 (-)
-pPC1 pPC1
-lpPC1 (-) - lpPC1 - + +
logaSJ108 + logaSJ108 +
-logaSJ101 (+) + + logaSJ101 + (-) (-)
logaSJ103 + logaSJ103 + -
-logaSJ105 + + + logaSJ105 + (-)
-logaSJ107 (+) + logaSJ107 (+) + +
logaRV001 - (+) logaRV001 -
-Feb - 2 - 3 - 4 - 5 - 6 - 7 - 8 - 9 - 10 - 11 - 12 - 1 Aug - 8 - 9 - 10 - 11 - 12 - 1 - 2 - 3 - 4 - 5 - 6 - 7
cPC1 - cPC1 - (-) (+) (+)
-pPC1 pPC1 - +
lpPC1 + (+) lpPC1 - (+) + +
logaSJ108 (-) logaSJ108 + - (-)
logaSJ101 + (-) (-) - logaSJ101 - (-) + logaSJ103 - (-) - logaSJ103 +
logaSJ105 - (-) logaSJ105 (+) (-) (+) + +
logaSJ107 + (-) - logaSJ107 +
-logaRV001 - logaRV001 + + (+)
Mar - 3 - 4 - 5 - 6 - 7 - 8 - 9 - 10 - 11 - 12 - 1 - 2 Sep - 9 - 10 - 11 - 12 - 1 - 2 - 3 - 4 - 5 - 6 - 7 - 8
cPC1 (-) + + cPC1 (+) (+)
-pPC1 (+) - (-) pPC1 + (+) - (-)
lpPC1 - (+) lpPC1 + (+) (-) (+) (-)
logaSJ108 - - logaSJ108 (-) -
-logaSJ101 + (-) - logaSJ101 (-) + (+) logaSJ103 - (-) logaSJ103 - (+) + + (-) logaSJ105 (-) logaSJ105 + + - + + (-) logaSJ107 + (-) logaSJ107 + (-) + logaRV001 + (+) logaRV001 + + (-) +
Apr - 4 - 5 - 6 - 7 - 8 - 9 - 10 - 11 - 12 - 1 - 2 - 3 Oct - 10 - 11 - 12 - 1 - 2 - 3 - 4 - 5 - 6 - 7 - 8 - 9 cPC1 (+) (-) + + - cPC1
pPC1 + pPC1 (-) (-) +
lpPC1 - lpPC1 + (+) - + (+)
logaSJ108 + logaSJ108 - - - (-)
logaSJ101 (+) logaSJ101 - (-) +
-logaSJ103 - + logaSJ103 - (-)
logaSJ105 (-) logaSJ105 + (-) (-)
logaSJ107 + (+) logaSJ107 - - (+) - (-) logaRV001 (-) (+) - (+) (+) logaRV001 - -
-May - 5 - 6 - 7 - 8 - 9 - 10 - 11 - 12 - 1 - 2 - 3 - 4 Nov - 11 - 12 - 1 - 2 - 3 - 4 - 5 - 6 - 7 - 8 - 9 - 10
cPC1 (+) - cPC1
-pPC1 + (-) - pPC1 + (-) (+)
lpPC1 (+) - - + + lpPC1 (-) - - +
logaSJ108 - + (-) logaSJ108 - + +
-logaSJ101 - logaSJ101 - + +
-logaSJ103 - - (+) + - logaSJ103 (-) + + (-)
logaSJ105 - + logaSJ105 - +
-logaSJ107 + (-) - logaSJ107 + + + + logaRV001 (-) logaRV001 - + + + +
-Jun - 6 - 7 - 8 - 9 - 10 - 11 - 12 - 1 - 2 - 3 - 4 - 5 Dec - 12 - 1 - 2 - 3 - 4 - 5 - 6 - 7 - 8 - 9 - 10 - 11
cPC1 - (-) - + cPC1 +
pPC1 + + pPC1 - -
-lpPC1 (+) (+) + (-) lpPC1 - (-)
-logaSJ108 - - - logaSJ108 + (+) - + logaSJ101 + (-) (-) (-) logaSJ101 + (+) + logaSJ103 (+) (-) (-) + logaSJ103 + +
logaSJ105 - (-) (-) (+) logaSJ105 + (+) -logaSJ107 - - - - + - (+) + logaSJ107 - - - + logaRV001 - - - (+) - logaRV001 + - + +
Table 2.Continued.
Dec Nov Oct Sep Aug Jul Jun May Apr Mar Feb Jan Dec Nov Oct Sep Aug Jul Jun May Apr Mar Feb Jan
Jan - 1 - 2 - 3 - 4 - 5 - 6 - 7 - 8 - 9 - 10 - 11 - 12 Jul - 7 - 8 - 9 - 10 - 11 - 12 - 1 - 2 - 3 - 4 - 5 - 6
cPC1 + - (+) + cPC1 -
-pPC1 + pPC1 (-) + +
-lpPC1 + + - + - (-) - lpPC1 (-) - (-) - (-)
logaSJ108 + + logaSJ108 + + + + + +
logaSJ101 (-) - (+) - (+) + + logaSJ101 + (+) +
-logaSJ103 - - logaSJ103 + (+) +
logaSJ105 - - logaSJ105 + + + (+) +
logaSJ107 - - (+) - + (+) + logaSJ107 (+) (+) + (+) + + (+)
logaRV001 (-) (-) + + (+) logaRV001 + (+) (+)
-Feb - 2 - 3 - 4 - 5 - 6 - 7 - 8 - 9 - 10 - 11 - 12 - 1 Aug - 8 - 9 - 10 - 11 - 12 - 1 - 2 - 3 - 4 - 5 - 6 - 7
cPC1 - - cPC1 (-)
-pPC1 + + pPC1 - +
lpPC1 (-) + + (+) lpPC1 (-)
-logaSJ108 - - - - logaSJ108 + + (-)
logaSJ101 + - - logaSJ101 + -
-logaSJ103 (+) - - - logaSJ103 - -
-logaSJ105 (+) - - logaSJ105 (-)
logaSJ107 + (-) (-) logaSJ107 (-) -
-logaRV001 - - - logaRV001 - + + (+)
Mar - 3 - 4 - 5 - 6 - 7 - 8 - 9 - 10 - 11 - 12 - 1 - 2 Sep - 9 - 10 - 11 - 12 - 1 - 2 - 3 - 4 - 5 - 6 - 7 - 8
cPC1 + (+) + cPC1 + (+) + (+)
pPC1 (+) - - pPC1 + (+)
lpPC1 + - lpPC1
logaSJ108 - - logaSJ108 - - (+) -
-logaSJ101 - (-) logaSJ101 - (-) (-) - (-) - - (-)
logaSJ103 (-) - - + logaSJ103 (+)
logaSJ105 - + (+) logaSJ105 +
logaSJ107 + (+) logaSJ107
logaRV001 logaRV001 +
Apr - 4 - 5 - 6 - 7 - 8 - 9 - 10 - 11 - 12 - 1 - 2 - 3 Oct - 10 - 11 - 12 - 1 - 2 - 3 - 4 - 5 - 6 - 7 - 8 - 9
cPC1 + + + (-) (-) cPC1
pPC1 - - pPC1
lpPC1 + (+) (+) lpPC1 + + + + + (+)
logaSJ108 (-) + logaSJ108 - - (-) (-) (-) (-) (-)
logaSJ101 (-) logaSJ101 - -
-logaSJ103 - (-) - - - + logaSJ103 - - - (-) (-) (-)
logaSJ105 (-) - - (-) logaSJ105 - (-) - (-) (-) (-)
logaSJ107 (-) - + logaSJ107 - - - - (-)
logaRV001 - (+) logaRV001
-May - 5 - 6 - 7 - 8 - 9 - 10 - 11 - 12 - 1 - 2 - 3 - 4 Nov - 11 - 12 - 1 - 2 - 3 - 4 - 5 - 6 - 7 - 8 - 9 - 10
cPC1 (+) - cPC1 -
-pPC1 + + + + pPC1 + - (+)
lpPC1 (+) (+) (+) + + + + (+) lpPC1
-logaSJ108 - (-) (-) (-) - - (-) (-) logaSJ108
logaSJ101 - (-) (-) logaSJ101 + +
logaSJ103 (-) (-) (-) - (-) - logaSJ103 + + (+)
-logaSJ105 - - + logaSJ105 + +
logaSJ107 - - (-) logaSJ107 + + + +
logaRV001 (-) (-) - (-) - - logaRV001 +
Jun - 6 - 7 - 8 - 9 - 10 - 11 - 12 - 1 - 2 - 3 - 4 - 5 Dec - 12 - 1 - 2 - 3 - 4 - 5 - 6 - 7 - 8 - 9 - 10 - 11
cPC1 - - (-) (-) cPC1
pPC1 + + + pPC1 (-) - - - -
-lpPC1 - + (+) lpPC1 (-) (-) - - (-)
-logaSJ108 - (-) - logaSJ108 (+) (+) + + + +
logaSJ101 (-) + (-) + logaSJ101 (+) + + +
logaSJ103 + + - + - (+) logaSJ103 (+) (+) + +
logaSJ105 - logaSJ105 (+) + + + +
logaSJ107 + (-) logaSJ107 (+) (+) (+) +
logaRV001 + + logaRV001 + + + (+) + +
6,000 25,000 30,000 76,250 125,000 410,000 875,000 1,562,500 2,500,000
Winter Spring
Summer Autumn
Jan
Feb
Jul
Aug
Sep
Apr
May
Jun
Oct
Nov
Dec Mar
SJ108 SJ101 SJ103 SJ105 SJ107 RV001 SJ108 SJ101 SJ103 SJ105 SJ107 RV001
SJ108 SJ101 SJ103 SJ105 SJ107 RV001 SJ108 SJ101 SJ103 SJ105 SJ107 RV001
0 28 41 55 68 92 Distance / km
0 28 41 55 68 92 Distance / km
0 28 41 55 68 92 Distance / km
0 28 41 55 68 92 Distance / km
Figure 7.Geometrical means for each month of the phytoplankton
abundance in the 1990–2004 period.
thus enabling more efficient autumnal water mixing and ul-timately higher phytoplankton in the following spring. High phytoplankton abundance in June is favoured by stable Au-gust and September conditions characterised by low evapo-ration and precipitation and intense water column mixing in October, induced by high evaporation. High phytoplankton abundance in July is preconditioned by high Po River flow during long period of several preceding months, from Au-gust to December, thus enabling inflow of nutrient-enriched low saline waters over that period and also facilitating spring spreading of riverine waters due to a stratified water column. High phytoplankton abundance in August at the western part of the transect is favoured by extremely intense evaporation and thus water mixing in the previous May. High phytoplank-ton abundance in September is induced by low precipitation in the previous March; in October, by low evaporation dur-ing previous January in addition to low Po flow durdur-ing the January–March period; and in November by low evapora-tion in February, favouring stable condievapora-tions. Thus, restricted water mixing in the previous January–March period favours high phytoplankton abundance in the following autumn. In-terestingly, high phytoplankton abundance in December is preceded by the intense water column mixing during previ-ous winter and spring, induced by intense evaporation.
3.6 Wind influence 3.6.1 Wind intensity
In 2001, 2003, and 2004, years of low evaporation, the aver-age wind speed was 4.1–4.8 m s−1, while in the years of high
evaporation it was both higher, 5.0–6.1 m s−1 in 1998 and
1999, and lower, 3.4 m s−1in 1993 (Table 3). High
evapora-tion in 1993 occurred in condievapora-tions of very low air tempera-ture and very high sea temperatempera-ture (9.1 and 16.4◦C,
respec-tively; values are monthly averages for three stations in the region, Trieste, Rovinj and Mali Lošinj and low when com-pared to 1966–1990 averages of 10.7 and 15.8◦C), implying
that temperature conditions are, besides winds, an additional important factor regulating evaporation rates.
3.6.2 Wind direction
Winds from the NE are generally stronger than winds from other directions and, as they blow over land, are dry and consequently induce enhanced evaporation. Thus, it is to be expected that in months of enhanced evaporation rates NE winds are more pronounced and more frequent than in months of reduced evaporation rates. On the other hand, winds from the SE blow over the sea and are moist and thus are not expected to induce the evaporation rates of same in-tensity as do NE winds of the same strength.
In line with this expectation, in the months of November with low evaporation (in 2003 and 2004), NE winds were less frequent than in years of high evaporation (in 1993, 1998 and 1999). In addition, when evaporation was low, in 2003 and 2004, winds from the SE were pronounced and appeared with higher intensities than in other investigated years. How-ever, in November 2001, characterised by low evaporation, winds from the NE were very strong and highly frequent, while the SE winds were weak. Presumably, low evaporation rates were in this month due to a very small difference be-tween air and sea temperatures (monthly averages of air and sea temperature for Trieste, Rovinj and Mali Lošinj were 8.3 and 11.9◦C, respectively, implying that the air–sea
temper-ature difference was 3.6◦C which is low when compared to
the 1966–1990 average of 5.1◦C).
3.6.3 Wind several days prior to phytoplankton sampling
Boraevents (mostly of (E)NE direction) were observed in
days preceding winter sampling of both high and low phyto-plankton abundances. On 17 February 2004, the largest win-ter bloom of the 1990–2004 period, extending over the en-tire Po River delta–Rovinj transect, in conditions of “anti-cyclonic” circulation, was documented. The Po River rates were, until the last days of the month, very low. Five days before the phytoplankton measurement, a moderate bora
Figure 8.pPC1 loadings of original data(a)along with lpPC1 loadings(b)and lpPC1 scores(c)of log data for the phytoplankton abundance in the 1990–2004 period.
followed by winds with pronounced NW or NE component, up to 4 m s−1in days before measurement.
Eleven days preceding the measurement of very low win-ter phytoplankton abundances on 20 February 2003, the wind was almost exclusively of NE direction, with speed generally over 4 m s−1and occasionally reaching high values (daily
av-erage of up to 14 m s−1on 16 February). Po River rates were
in the first half of the month above average and in the second
month below the average, while the circulation on the date of measurement was “cyclonic”.
Figure 9.The two circulation patterns appearing in February: the anticyclonic (left) and the cyclonic (right).
Table 3.Frequency (FREQ) and intensity (INT) of winds from various directions (N, NE, E, SE, SW, W, NW) in November in years with
high (1993, 1998 and 1999) and low (2001, 2003 and 2004) evaporation rates. The frequency is a number of occurrences of specific wind direction within a month based on three-times-per-day sampling. Total indicates the monthly wind average.
1993 1998 1999 2001 2003 2004
Wind FR INT FR INT FR INT FR INT FR INT FR INT
direction EQ (beaufort) EQ (beaufort) EQ (beaufort) EQ (beaufort) EQ (beaufort) EQ (beaufort)
N 8 2.7 2 4.6 3 2.3 2 0.8 1 2.6 2 2.5
NE 43 4.2 38 8.2 38 6.5 45 6.5 29 5.1 24 8.0
E 23 3.6 16 3.6 21 4.8 15 2.9 19 5.0 23 4.6
SE 1 3.4 10 3.0 13 2.6 5 1.7 13 5.6 10 4.1
S 3 1.3 3 4.4 – – – – – – – –
SW 2 1.6 8 9.4 4 5.5 12 4.8 3 2.5 9 5.0
W 3 2.2 2 4.3 4 3.4 2 1.7 5 1.9 7 1.9
NW 1 3.4 8 4.8 6 3.7 8 3.1 13 2.7 8 1.8
Total – 3.4 – 6.1 – 5.0 – 4.8 – 4.1 – 4.7
of another large phytoplankton bloom on 23 July, which pre-sumably favoured spreading of Po River waters whose rates were slightly above the average. Geostrophic circulation and salinity distribution on cruise dates in these 2 years show presence of two large gyres, in the eastern and western parts of the investigated area, in which low salinity water accumu-lated (Supi´c et al., 2003, for 1997 and unpublished data for 2001).
However, in July 2000, in days preceding the 19 July cruise winds were of variable directions with only one more pronounced wind episode over 3 B (on 15 July, 4 B from ESE, midday). Po River rates were below the average, salin-ity between the Po River delta and Rovinj was much higher than in 1997 and 2001 and geostrophic currents were weaker than in 1997 and 2001. The large bloom which occurred might be due to more intense vertical mixing in conditions of low stratification (sigma-t was around 25–25.5 at the surface and around 28.5 at the bottom, with the difference between
the two values lower than in 1997 or 2001), which enabled the rise of bottom nutrients from sea bottom (which in that part of the year accumulate near the bottom; e.g. Degobbis et al., 2000) and their use in primary production.
3.7 Stratification
4 Discussion
4.1 Characteristics of phytoplankton distribution Rather stable horizontal and vertical phytoplankton abun-dance gradients are characteristic for almost the entire year. Only in the coldest of months (December–January) is the water column habitually uniform (Fig. 7). However, isolated shallow phytoplankton patches occasionally form in the sur-face layer of SJ108 and SJ103, as indicated by the monthly averages of original phytoplankton values.
Generally, a comparison between the original and trans-formed phytoplankton data allowed us a more comprehen-sive insight into the yearly phytoplankton distribution over the analysed area of the NA. The transformed data corre-sponds to the characteristic phytoplankton pattern in the area. In the case of the NA, this mainly means that three phyto-plankton blooms develop regularly in the western part of the region during the year. On the other hand, original data are found to give us more specific information, enabling us in-sight into the occasional occurrences in the region. For the NA this mainly means that phytoplankton blooms of smaller intensity develop occasionally at the eastern part of the re-gion during autumn and winter. Their occurrences are highly dependable on the regional circulation pattern, i.e. develop-ment of the ICCC (Table 1).
4.2 Simultaneous factors inducing blooms
In January and February the appearance of phytoplankton blooms depend on the circulation pattern. The blooms re-spond to the presence of the nutrient-enriched Po River wa-ters which are redistributed in the NA according to the circu-lation pattern. The intensity of the Po River discharge plays no role in it.
Our results are in line with our previous work (Kraus and Supi´c, 2011) in which we came to the conclusion that Febru-ary circulation patterns highly influence the appearance of the large blooms by following another approach, i.e. by relat-ing the phytoplankton abundance of a specific station to the intensity of the ICCC. In this work we performed the PCA, which enabled a more comprehensive insight into the circu-lation patterns and phytoplankton of the NA, as we included a complete phytoplankton data set and circulation pattern of the entire profile (calculated by PCA). However, both analy-ses resulted with similar conclusions.
From March to December, the Po River outflow intensity reflects, to lower or larger degree, on phytoplankton abun-dances in the region. During this entire period the column is generally stratified, with highest stratification degree of 0–5 m surface layer at the stations of the profile between the Po River delta and Rovinj in June–July (Degobbis et al., 2000). Due to low turbulent mixing at the pycnocline depth, the low salinity riverine water is in highly stratified conditions retained in the surface layer and therefore spreads
around the basin, regardless of the existing circulation pat-tern. The amount of freshened water at a certain NA loca-tion is then proporloca-tional to the discharge rate: the larger dis-charge, the larger amount of freshened water at the location, inducing more intensive phytoplankton blooms. Thus, in pe-riods of high stratification degree, as are June and July, the Po River discharge rates immediately reflect on the phyto-plankton blooms. However, by the end of summer the situ-ation becomes more complex and direct Po River influence on phytoplankton turns periodical. In September and October correlations between blooms and Po River rates with 15 days time lag are high, as the one between the blooms and PC1 or ICCC, meaning that waters from the Po River recirculate within the region.
Interestingly, we obtained sporadic or no correlation be-tween phytoplankton blooms and circulation/Po River rates in November and December. It might be that this is a period when temperature or some other factors model the interan-nual phytoplankton variability.
No clear relation between phytoplankton abundances and wind intensity in days preceding the measurements was ob-served. This is partly due to the fact that monthly sampling is too scarce to be related to highly changeable wind di-rection and strength. Our descriptive analysis showed that winterboraevents preceded sampling of both high and low
phytoplankton abundances. Winds with a pronounced west component along with enhanced Po River discharge favoured presumably the largest summer phytoplankton blooms. How-ever, we also documented high phytoplankton abundance in July with low Po River discharge rates after moderate winds of highly changeable direction.
Only sporadic correlation was observed between phyto-plankton abundances and stratification degree, meaning that wind-induced vertical mixing in the water column does not induce large phytoplankton abundance.
4.3 Preconditioning
Although general NA processes are not yet fully understood, the main idea for this work was to identify possible prerequi-sites for the phytoplankton blooms, which might occur dur-ing the preceddur-ing year’s cycle. Our finddur-ings indicate the fol-lowing.
– The January–March period, in conditions of low evap-oration, precipitation and/or Po flow, results in a more stable vertical column which lasts for a longer period in-cluding the following spring. In spring, the regenerated nutrients remain in the lower layer resulting in low phy-toplankton production; later, in the following autumn these retained nutrients are available to spread in the wa-ter column, favouring high phytoplankton abundances. – Continuous low Po flow in the period from August to
effi-cient use of regenerated nutrients from the bottom later in spring (April and May); in contrast, high Po flow in the same period stabilises the water column, which makes easier for the Po River waters to spread over the surface layer and accumulate in closed circulation cells until summer, inducing high blooms in July.
– Vertical distribution range of the phytoplankton blooms seems to be predetermined by vertical mixing inten-sity over the previous months. Namely, starting from July until November, phytoplankton blooms at the east-ern part spread into lower depths, after being limited to the upper layer from April to June. We suppose that a high stratification favours accumulation of phytoplank-ton in the upper layer in April–June, while intense ver-tical mixing and deepening of the pycnocline favours accumulation of phytoplankton also in the deeper lay-ers as in July–November. Presumably, extremely high stratification conditions are more likely to appear after a longer period of steady conditions (lower evaporation and vertical mixing). However, mixing is more intense when winds are more frequent and stronger.
The high correlation between the circulation pattern and phy-toplankton blooms in February (above 95 %; Table 1), as well as correlations between circulation pattern and evaporation (above 90 %; note that correlation between phytoplankton blooms and evaporation also exists, although with signifi-cance below 90 %; Fig. 10), is an important result of our work. Namely, it is in February when exceptionally large blooms can occur with possible consequences on the an-chovy catch, one of the main marine species used as food (Kraus and Supi´c, 2011). Large blooms at the stations SJ101 and SJ107 were highly correlated with the total anchovy catch in the subsequent year (98 and 92 %); however, the correlation at SJ101 is more reliable than the one at SJ107, the latter being based on a single year when both parameters had extremely high values (2004). Thus, long-term changes in this month can be especially important for the secondary production in the NA and deserve to be investigated more closely. Detailed comparison of evaporation in these months against PCA scores of transformed February phytoplank-ton abundances and geostrophic currents at the profile dur-ing the 1990–2004 period is presented at Fig. 10. It shows that the abundant February phytoplankton production, rep-resented by negative lpPCA scores is preceded by intense evaporation in the preceding February and October, each fol-lowed by low evaporation in June and November. In con-trast, intense February anticyclonic circulation (as shown in Fig. 9), which corresponds to positive cPCA scores, favour-ing spreadfavour-ing of phytoplankton eastwards from the eutrophic western parts, are also preceded by intense evaporation in preceding February and October and low evaporation in June and November. November is a month in which drastic changes in geostrophic circulation fields can occur, as was documented for 1999 (Supi´c et al., 2012). On the basis of
the case study in 1999–2002 it was hypothesised that sur-face geostrophic fields are reflections of the bottom density fields which are formed in the period of pycnocline destabili-sation. Different meteorological conditions in the autumns of 1999 and 2000 were invoked in explanation of different cir-culation in subsequent winters. Our results show that large evaporation events favour cyclonic circulation (as shown in Fig. 9), which is in line with this previous assumption, based on analysis of the 1999–2001 period, indicating that bora
(NE) winds in autumn favour the appearance of “cyclonic” winter circulation andscirocco(SE) of “anticyclonic”
win-ter circulation (Supi´c et al., 2012). Namely, the dryborais
expected to induce larger evaporation and surface heat losses than the moistscirocco. However, our analysis showed that evaporative fluxes in November do not depend only on wind and that the air–sea difference in temperature plays an impor-tant role in intensification/weakening of evaporative fluxes. The indication of our findings that winter and autumnal con-ditions were related were previously presented in Supi´c and Vilibi´c (2006) and Supi´c et al. (2012), where the relation be-tween autumn and the next winter circulation were discussed. Furthermore, in an independent research by Santojanni et al. (2006), high correlations were observed between autumn conditions and the next year’s anchovy stock estimate. Cor-relations with other months (October, June and February) are interesting but cannot be commented on without further re-search, based on theoretical modelling or specific case stud-ies.
4.4 Trends
Contrary to Tedesco et al. (2007), who analysed concentra-tions of chlorophylla in the western part of the NA and for
almost the same period (1986–2005) as we did, our analysis was based on monthly interannual changes and indicated that in some periods of the year trends in bioproduction and cir-culation patterns are distinctive. We believe that January and February trends, which are especially pronounced in both pa-rameters, are especially important. They show that from 1990 to 2004 a shift towards large winter bioproduction induced by more frequent winter anticyclonic circulation (Fig. 9), ex-isted and was possibly also induced by complex air–sea in-teractions in the previous autumn.
4.5 Prediction of phytoplankton abundance and circulation conditions
Figure 10. Correlation coefficients and lpPC1 scores of February
(log values of phytoplankton; a, b) and cPC1 (geostrophic
cur-rents;c,d) against monthly averages of evaporation of the previous year during the analysed period (1989–2004) at the Po River delta–
Rovinj profile(a, c). Correlations in November, October, June and
February are given graphically(b, d).
discharge and presence of the ICCC. Thus, by monitoring conditions which induce large discharges in summer (a bet-ter understanding of the Po River regime, related to e.g. ice and snow melting in the Alps, etc.), we could possibly be a step closer to predicting summer bloom conditions as well.
All the same, what would be the purpose of being able to predict phytoplankton blooms at all? We identified the following two reasons. Firstly, we showed the example of anchovies (Kraus and Supi´c, 2011; Kraus et al., 2015) and that understanding the driving forces of phytoplankton pro-duction in the ecosystem is important in other fields of ma-rine research, such as fisheries. Other studies following the same approach of combining knowledge about the marine species life cycles on the one hand and the driving pressures of their abundances and distribution patterns on the other could expand our capabilities of a planned exploration of
marine resources. Secondly, in extreme cases, when excep-tionally high amounts of phytoplankton are produced, ulti-mately huge oxygen quantities get utilised in the degradation processes. This can easily lead to hypoxia or, in more se-vere cases, event to anoxia. Our thoughts are that if these events increased fishing pressure (monetary stimulated), it could have a considerable role in prevention of severe oxy-gen depletion. Naturally, far more work should be done in order to achieve this particular goal.
5 Conclusions
We investigated numerous correlations between various envi-ronmental parameters and time lags in order to find the ones which best explains the ecosystem functioning. Although sta-tistical significance of 95 % is commonly used, we believe that even correlations of lower significance can be impor-tant milestones in detecting relations between meteorologi-cal, dynamical and biological factors. For the purpose of fu-ture theoretical ecological models of NA, which we plan, it is useful that all possible important relations are mentioned in our work. However, in discussion of our results, we gen-erally limit our discussions to correlations of higher signifi-cance and make a clear distinction between the ones obtained from correlations of lower (80–90 %) and higher (over 90 %) significance.
Our results show basic relations between NA phytoplank-ton production, Po River discharge rates, circulation and sur-face fluxes. They are based on a long-term data set which was analysed in detail with PCA, for detecting typical pat-terns and long-term changes in phytoplankton distribution and current fields of the region.
ap-pears after low evaporation rates in November. Vice versa, the cyclonic circulation pattern is preceded by a high evap-oration rate. From 1990 to 2004 a shift towards large winter bioproduction induced by circulation changes appeared. We showed that the role of wind in evaporative flux enhance-ments is not straightforward as evaporative fluxes are highly dependent on other factors, e.g. air–sea difference in temper-ature. In addition, it seems that wind-induced vertical mix-ing in the water column does not necessary reflect on large phytoplankton abundance as the stratification degree, when analysing data separately for each month, was only sporadi-cally related to phytoplankton abundances.
The obtained results create the basis of an “empirical eco-logical model” which can be used in assessments of the NA productivity, useful for the environmental management of the region or in climatic studies aiming to estimate the response of NA to climatic changes. The results obtained should be investigated in more detail by means of a theoretical eco-logical model, which can be developed using the simplifi-cation of oceanographic fields along with surface fluxes and Po River flow rates. Our results are also a valuable contribu-tion in checking the numerical ecological model of the region which is currently being developed (e.g. Lonˇcar et al., 2013).
The Supplement related to this article is available online at doi:10.5194/os-12-19-2016-supplement.
Acknowledgements. The data used here were provided by the
Center of Marine Research of the Rudjer Boškovi´c Institute in Rovinj, Trieste University, Hydrometeorological Institute in Za-greb, Maritime Meteorological Center in Split, and the Assessorato Programmazione, Piafinicazione e Ambiente of the Emilia Ro-magna region. This work was supported by the Ministry of Science, Education and Sport of the Republic of Croatia under projects 098-0982705-2731, 098-0982705-2707 and Project Adriatic.
Edited by: V. Brando
References
Civitarese, G., Gaˇci´c, M., Lipizer, M., and Eusebi Borzelli, G. L.: On the impact of the Bimodal Oscillating System (BiOS) on the biogeochemistry and biology of the Adriatic and Ionian Seas (Eastern Mediterranean), Biogeosciences, 7, 3987–3997, doi:10.5194/bg-7-3987-2010, 2010.
Cosoli, S., Gaˇci´c, M., and Mazzoldi, A.: Surface current variability and wind influence in the northeastern Adriatic Sea as observed from high-frequency (HF) radar measurements, Cont. Shelf Res., 33, 1–13, 2012.
Cushman-Roisin, B., Gaˇci´c, M., Poulain, P.-M., and Artegiani, A. (Eds.): Physical Oceanography of the Adriatic Sea, Kluwer Aca-demic Publishers, Dordrecht, The Netherlands, 304 pp., 2001.
Degobbis, D., Precali, R., Ivancic, I., Smodlaka, N., Fuks, D., and Kveder, S.: Long-term changes in the northern Adriatic ecosys-tem related to anthropogenic eutrophication, Int. J. Environ. Pol-lut., 13, 495–533, 2000.
Djakovac, T., Kraus, R., Precali, R., and Supi´c, N.: Winter trends in the northern Adriatic, Rapp. Comm. int. Mer Médit., 39, 739, 2010.
Djakovac, T., Degobbis, D., Supi´c, N., and Precali, R.: Marked re-duction of eutrophication pressure in the northeastern Adriatic in the period 2000–2009, Estuar. Coast. Shelf Sci., 115, 25–32, 2012.
Djakovac, T., Supi´c, N., Bernardi Aubry, F., Degobbis, D., and Gi-ani, M.: Mechanisms of hypoxia frequency changes in the north-ern Adriatic Sea during the period 1972–2012, J. Marine Syst., 141, 179–189, 2015.
Franco, P. and Michelato, A.: Northern Adriatic Sea: oceanography of the basin proper and of the western coastal zone, Sci. Total Environ., 1992, 35–62, 1992.
Giani, M., Djakovac, T., Degobbis, D., Cozzi, S., Solidoro, C., and Fonda Umani, S.: Recent changes in the marine ecosystems of the northern Adriatic Sea, Estuar. Coast. Shelf Sci., 115, 1–13, 2012.
Grilli, F., Paschini, E., Precali, R., Russo, A., and Supi´c, N.: Circu-lation and horizontal fluxes in the northern Adriatic in the period June 1999–July 2002, Part 1: Geostrophic circulation and current measurement, Sci. Total Environ., 353, 57–67, 2005.
Krajcar, V.: The climatology of geostrophic currents in the northern Adriatic, Geofizika, 20, 105–114, 2003.
Kraus, R. and Supi´c, N.: Impact of circulation on high phytoplank-ton blooms in northern Adriatic (1990–2004) and possibilities of bloom and fish stock long-term prediction, Estuar. Coast. Shelf Sci., 91, 198–210, 2011.
Kraus, R., Supi´c, N., Luˇci´c, D., and Njire, J.: Impact of winter oceanographic conditions on zooplankton abundance in northern Adriatic with implications on Adriatic Anchovy Stock prognosis, Estuar. Coast. Shelf Sci., 167, 56–66, 2015.
Kuzmi´c, M., Janekovi´c, I., Book, J. W., Martin, P. J., and Doyle, J. D.: Modeling the northern Adriatic double-gyre response to intense bora wind: A revisit, J. Geophys. Res., 111, C03S12, doi:10.1029/2005JC003377, 2007.
Lonˇcar, G., Paladin, M., and Matoševi´c, J.: Numerical Analysis of wind impact on the intensity of algal bloom in the North Adriatic, Hrvatske vode, 84, 109–118, 2013 (in Croatian).
Mari´c, D., Kraus, R., Godrijan, J., Supi´c, N., and Dakovac, T., Pre-cali, R.: Phytoplankton response to climatic and anthropogenic influences in the north-eastern Adriatic during the last four decades, Estuar. Coast. Shelf Sci., 115, 98–112, 2012.
Mozetiˇc, P., Solidoro, C., Cossarini, G., Socal, G., Precali, R., Francé, J., Bianchi, F., De Vittor, C., Smodlaka, N., and Fonda Umani, S.: 2010. Recent trends towards oligotrophication of the Northern Adriatic: Evidence from chlorophyll a time se-ries, Estuar. Coast., 33, 362–375, doi:10.1007/s12237-009-9191-7, 2010.
Orli´c, M., Gaˇci´c, M., and La Violette, P.E.: The currents and circu-lation of the Adriatic Sea, Oceanol. Acta, 15, 109–124, 1992. Orli´c, S., Najdek, M., Supi´c, N., Ivanˇci´c, I., Fuks, D., Blažina, M.,
gyre structure (north-eastern Adriatic Sea), Aquat. Microb. Ecol., 69, 193–203, 2013.
Santojanni, A., Arneri, E., Bernardini, V., Cingolani, N., Di Marco, M., and Russo, A.: Effects of environmental variables on recruit-ment of anchovy in the Adriatic Sea, Clim. Res., 31, 181–193, 2006.
Sournia, A.: La production primaire planctonique en Mediterranée, Essai de mise a jour, Bull. Etude Comm. Méditerr. Num. Spéc., 5, 1–128, 1973.
Supi´c, N. and Orli´c, M.: Seasonal and interannual variability of the northern Adriatic surface fluxes, J. Marine Syst., 20, 205–229, 1999.
Supi´c, N. and Vilibi´c, I.: Dense water characteristics in the northern Adriatic in the 1967–2000 interval with respect to surface fluxes and Po river discharge rates, Estuar. Coast. Shelf Sci., 66, 580– 593, 2006.
Supi´c N., Orli´c, M., and Degobbis, D.: Istrian Coastal Countercur-rent and its Year-to-Year Variability, Estuar. Coast. Shelf Sci., 50, 385–397, 2000.
Supi´c N., Orli´c, M., and Degobbis, D.: Istrian Coastal Countercur-rent in the year 1997, Nuovo Cimento, 26, 117–131, 2003. Supi´c, N., Kraus, R., Kuzmi´c, M., Paschini, E., Precali, R., Russo,
A., and Vilibi´c, I.: Predictability of northern Adriatic winter con-ditions, J. Marine Syst., 90, 42–57, 2012.
Tedesco, L., Socal, G., Bianchi, F., Acri, F., Veneri, D., and Vichi, M.: NW Adriatic Sea biogeochemical variability in the last 20 years (1986–2005), Biogeosciences, 4, 673–687, doi:10.5194/bg-4-673-2007, 2007.
Utermöhl, H.: Zur Verfollkommnung der quantitativen
Phytoplankton-Methodik, Mitteilung Internationale