ACPD
14, 6501–6536, 2014MAX-DOAS measurements of tropospheric SO2 in
Xianghe, China
T. Wang et al.
Title Page
Abstract Introduction
Conclusions References
Tables Figures
◭ ◮
◭ ◮
Back Close
Full Screen / Esc
Printer-friendly Version
Interactive Discussion
Discussion
P
a
per
|
D
iscussion
P
a
per
|
Discussion
P
a
per
|
Discuss
ion
P
a
per
|
Atmos. Chem. Phys. Discuss., 14, 6501–6536, 2014 www.atmos-chem-phys-discuss.net/14/6501/2014/ doi:10.5194/acpd-14-6501-2014
© Author(s) 2014. CC Attribution 3.0 License.
Atmospheric Chemistry and Physics
Open Access
Discussions
This discussion paper is/has been under review for the journal Atmospheric Chemistry and Physics (ACP). Please refer to the corresponding final paper in ACP if available.
Evaluation of tropospheric SO
2
retrieved
from MAX-DOAS measurements in
Xianghe, China
T. Wang1,2, F. Hendrick2, P. Wang1, G. Tang1, K. Clémer2,*, H. Yu2, C. Fayt2, C. Hermans2, C. Gielen2, G. Pinardi2, N. Theys2, H. Brenot2, and
M. Van Roozendael2
1
Institute of Atmospheric Physics, Chinese Academy of Sciences, Beijing, China
2
Belgian Institute for Space Aeronomy, Brussels, Belgium
*
now at: Instituut voor Sterrenkunde, Katholieke Universiteit Leuven, Leuven, Belgium
Received: 7 January 2014 – Accepted: 26 February 2014 – Published: 11 March 2014
Correspondence to: F. Hendrick ([email protected])
ACPD
14, 6501–6536, 2014MAX-DOAS measurements of tropospheric SO2 in
Xianghe, China
T. Wang et al.
Title Page
Abstract Introduction
Conclusions References
Tables Figures
◭ ◮
◭ ◮
Back Close
Full Screen / Esc
Printer-friendly Version
Interactive Discussion
Discussion
P
a
per
|
D
iscussion
P
a
per
|
Discussion
P
a
per
|
Discuss
ion
P
a
per
|
Abstract
Ground-based Multi-Axis Differential Optical Absorption Spectroscopy (MAX-DOAS) measurements of sulfur dioxide (SO2) have been performed at the Xianghe station (39.75◦N, 116.96◦E) located at
∼50 km southeast of Beijing from March 2010 to
Febru-ary 2013. Tropospheric SO2vertical profiles and corresponding vertical column
densi-5
ties (VCDs), retrieved by applying the Optimal Estimation Method to the MAX-DOAS observations, have been used to study the seasonal and diurnal cycles of SO2, in combination to correlative measurements from in situ instruments, as well as mete-orological data. A marked seasonality was observed in both SO2 VCD and surface concentration, with a maximum in winter (February) and a minimum in summer (July).
10
This can be explained by the larger emissions in winter due to the domestic heating and more favorable meteorological conditions for the accumulation of SO2close to the ground during this period. Wind speed and direction are also found to be two key fac-tors in controlling the level of the SO2-related pollution at Xianghe. In the case of east or southwest wind, the SO2 concentration rises with the increase of the wind speed,
15
since heavy polluting industries are located to the east and southwest of the station. In contrast, when wind comes from other directions, the stronger the wind, the less SO2 is observed. Regarding the diurnal cycle, the SO2amount is larger in the early morn-ing and late evenmorn-ing and lower at noon, in line with the diurnal variation of pollutant emissions and atmospheric stability. The observed diurnal cycles of MAX-DOAS SO2
20
surface concentration are also in very good agreement (correlation coefficient close to 0.9) with those from collocated in-situ data, demonstrating the reliability and robustness of our retrieval.
1 Introduction
Sulfur dioxide (SO2), one of the most common air pollutants, is of major concern in
25
ACPD
14, 6501–6536, 2014MAX-DOAS measurements of tropospheric SO2 in
Xianghe, China
T. Wang et al.
Title Page
Abstract Introduction
Conclusions References
Tables Figures
◭ ◮
◭ ◮
Back Close
Full Screen / Esc
Printer-friendly Version
Interactive Discussion
Discussion
P
a
per
|
D
iscussion
P
a
per
|
Discussion
P
a
per
|
Discuss
ion
P
a
per
|
Protection (MEP) lists SO2 as one of the three conventional pollutants, together with NO2 and PM10, and daily averaged SO2concentrations were used as an indicator to quantify the level of pollution (Yan et al., 2010). This trace gas is predominantly pro-duced by the burning of fossil fuels including oil and coal, and the smelting of mineral ores that contain sulfur (Yan et al., 2005; Zhao et al., 2012). Furthermore, SO2
con-5
tributes in a large extent to the process of acidification resulting in acid rain and to the formation of sulfate aerosols, both of which cause human health damages, building surface corrosion, and visibility reduction. In particular, the secondary pollutant sulfate aerosols generated by SO2are the primary source of fine solid particles in cities, which are also responsible for severe air pollution issues (Meng et al., 2009). In addition,
10
the on-going industrial development, population growth, and heavy traffic contribute to higher energy consumption and therefore, to an increase in SO2 emissions into the atmosphere (Wu et al., 2013). Consequently, in order to meet urgent demand in China to improve and control air quality, as well as to promote sustainable development, it is of the greatest importance to study the evolution of a pollutant like SO2and to identify
15
its possible origins.
So far, the SO2 surface concentration has been monitored using in-situ and long-path DOAS (Differential Optical Absorption Spectroscopy) instruments (Meng et al., 2009), while satellite sensors like GOME, SCIAMACHY, GOME-2, OMI, OMPS, and IASI have shown their ability to measure the SO2vertical column density (VCD) over
20
polluted areas (see e.g. Eisinger and Burrows, 1998; Krotkov et al., 2006; Lee et al., 2009; Nowlan et al., 2011; Fioletov et al., 2013; Yang et al., 2013; Boynard et al., 2014). During the last decade, a new remote sensing technique called MAX-DOAS (Multi-Axis Differential Optical Absorption Spectroscopy) has been developed, providing informa-tion on both VCD and vertical distribuinforma-tion of trace gases in the troposphere (Hönninger
25
ACPD
14, 6501–6536, 2014MAX-DOAS measurements of tropospheric SO2 in
Xianghe, China
T. Wang et al.
Title Page
Abstract Introduction
Conclusions References
Tables Figures
◭ ◮
◭ ◮
Back Close
Full Screen / Esc
Printer-friendly Version
Interactive Discussion
Discussion
P
a
per
|
D
iscussion
P
a
per
|
Discussion
P
a
per
|
Discuss
ion
P
a
per
|
on the retrieval of NO2 (e.g. Wittrock et al., 2004; Vlemmix et al., 2010; Frins et al., 2012; Hendrick et al., 2014; Ma et al., 2013; Wang et al., 2014), halogen oxides like BrO and IO (e.g. Frieß et al., 2011; Großmann et al., 2013), formaldehyde (e.g. Heckel et al., 2005; Wagner et al., 2011), and aerosols (e.g. Wagner et al., 2004; Frieß et al., 2006; Clémer et al., 2010). Regarding SO2, only little efforts have been dedicated to
5
the retrieval and monitoring of this species from MAX-DOAS measurements (Irie et al., 2011; Wu et al., 2013), despite the fact that as for other trace gases like NO2, HCHO, and BrO, the combination of both surface concentration and VCD retrievals makes MAX-DOAS a useful technique for validating SO2satellite data.
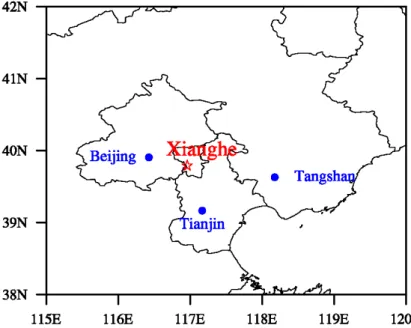
Here we present three years (March 2010–February 2013) of continuous
MAX-10
DOAS SO2 observations at the Xianghe Observatory, China (39.75◦N, 116.96◦E),
lo-cated at about 50 km South-East of Beijing, at the borders among Beijing, Tangshan and Tianjin (see Fig. 1). The station is operated by the Institute of Atmospheric Physics (IAP)/Chinese Academy of Sciences (CAS) while the MAX-DOAS instrument was de-veloped by the Belgian Institute for Space Aeronomy (BIRA-IASB) and validated in
15
several intercomparison exercises, in particular as part of the international Cabauw In-tercomparison of Nitrogen Dioxide measuring Instruments (CINDI, Roscoe et al., 2010) and more recently a national Chinese MAX-DOAS instruments intercomparison cam-paign held in Xianghe (Wang et al., 2013). SO2 MAX-DOAS observations are used here in combination with in-situ measurements as well as conventional
meteorologi-20
cal data (temperature, humidity, wind direction and speed) to investigate the seasonal and diurnal cycles of SO2 vertical profiles and VCDs. The paper is divided into three main Sections. In Sect. 2, the SO2 measurements are described, including the DOAS analysis, vertical profile retrieval, and retrieval verification through comparison with in situ data. The seasonal and diurnal cycles of SO2 are investigated in Sect. 3. Finally,
25
ACPD
14, 6501–6536, 2014MAX-DOAS measurements of tropospheric SO2 in
Xianghe, China
T. Wang et al.
Title Page
Abstract Introduction
Conclusions References
Tables Figures
◭ ◮
◭ ◮
Back Close
Full Screen / Esc
Printer-friendly Version
Interactive Discussion
Discussion
P
a
per
|
D
iscussion
P
a
per
|
Discussion
P
a
per
|
Discuss
ion
P
a
per
|
2 Data
2.1 Instrument
The MAX-DOAS instrument operated at the Xianghe Observatory consists of three components: a thermo-regulated box containing two spectrometers, an optical head mounted on a sun tracker, and two computers for instrument control and data storage
5
(Clémer et al., 2010). The optical head and the two spectrometers are linked by two-way splitter optical fibers (Clémer et al., 2010; Wang et al., 2013). This setup is capable of measuring scattered as well as direct sunlight. One spectrometer works in the UV region (300 to 390 nm) and its instrumental function is close to a Gaussian with a full width at half maximum (FWHM) of 0.4 nm. The other spectrometer covers the visible
10
wavelength range from 400 to 720 nm with a FWHM equal to 0.9 nm. During the obser-vation, the azimuth direction of the telescope is fixed to the North. A full MAX-DOAS scan consists of 9 elevation viewing angles (2◦, 4◦, 6◦, 8◦, 10◦, 12◦, 15◦, 30◦, and 90◦)
and lasts about 15 min (Clémer et al., 2010). The 3 year data set investigated in this study covers the March 2010 to February 2013 period.
15
2.2 DOAS analysis
Scattered-sunlight spectra measured at different elevation angles (EVAs) are analyzed using the DOAS technique (Platt and Stutz, 2008) where high-frequency molecular absorption structures in the UV and visible regions of the spectrum are exploited to detect and quantify a number of key atmospheric gases such as SO2.
20
In this work, the spectra obtained from MAX-DOAS observations are analyzed us-ing the QDOAS spectral-fittus-ing software suite developed at BIRA-IASB (http://uv-vis. aeronomie.be/software/QDOAS/). QDOAS calculates the SO2differential slant column densities (DSCDs), which are defined as the difference between the trace-gas con-centration integrated along the effective light path and the amount of the absorber in
25
ACPD
14, 6501–6536, 2014MAX-DOAS measurements of tropospheric SO2 in
Xianghe, China
T. Wang et al.
Title Page
Abstract Introduction
Conclusions References
Tables Figures
◭ ◮
◭ ◮
Back Close
Full Screen / Esc
Printer-friendly Version
Interactive Discussion
Discussion
P
a
per
|
D
iscussion
P
a
per
|
Discussion
P
a
per
|
Discuss
ion
P
a
per
|
measurements, in contrast to in situ instruments which require calibration on a regular basis. In practice, for tropospheric studies, the zenith spectrum of each scan is fre-quently chosen as reference, in this way removing the contribution of the stratosphere in off-axis DSCDs.
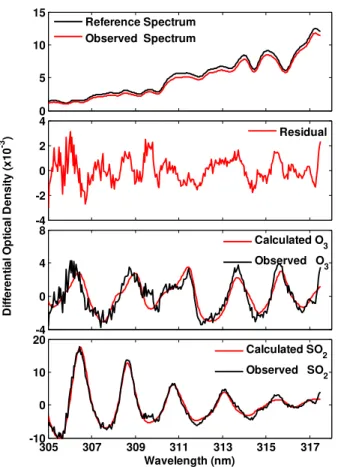
According to the sensitivity tests we performed, the most suitable fitting window for
5
SO2 is found to be 305–317.5 nm. This choice is based on the fact that SO2 displays strong absorption differential structures in this interval while ozone interferences can still be managed until moderately high solar zenith angles (approximately 75◦). The
DOAS analysis settings, including the trace-gas cross-sections, are described in Ta-ble 1. The other trace gases taken into account in the fitting process are NO2, O3, as
10
well as the Ring effect (Grainger and Ring, 1962; Chance and Spurr, 1997). A fifth-order polynomial is used to fit the low-frequency spectral structure due to Rayleigh and Mie scattering and instrumental effects. Figure 2 shows a typical example of a DOAS fit for SO2at 43◦ SZA (solar zenith angle). We see that the residual is small, ranging
from−2×10⁻³ to 2×10⁻³, which indicates a limited retrieval error. In this illustrative
15
case, the retrieved SO2DSCD is 7.27×10¹⁶molec cm−2.
2.3 Profile retrieval
SO2 vertical profiles are retrieved for each MAX-DOAS scan by applying the bePRO profiling tool developed at BIRA-IASB (Clémer et al., 2010; see also Hendrick et al., 2014) to the corresponding DSCDs measured at the different EVAs. bePRO is based
20
on the Optimal Estimation Method (Rodgers, 2000) and includes the LIDORT radiative transfer model (RTM) as a forward model. A two-step approach is implemented in bePRO: first, aerosol extinction profiles are retrieved from measured O4 DSCDs. This step is needed because the aerosols strongly influence the effective light path in the atmosphere and therefore the absorption by trace gases like SO2. Secondly, bePRO
25
ACPD
14, 6501–6536, 2014MAX-DOAS measurements of tropospheric SO2 in
Xianghe, China
T. Wang et al.
Title Page
Abstract Introduction
Conclusions References
Tables Figures
◭ ◮
◭ ◮
Back Close
Full Screen / Esc
Printer-friendly Version
Interactive Discussion
Discussion
P
a
per
|
D
iscussion
P
a
per
|
Discussion
P
a
per
|
Discuss
ion
P
a
per
|
Aerosol extinction and SO2 vertical profilesxare obtained by means of an iterative
approach using the following equation:
xi+1=xi+
S−1
a +KTi S
−1
ε Ki
−1 ·
h KTi S−1
ε (y−F(xi))−S−a1(xi−xa) i
(1)
wherey is the observation vector with the DSCDs at the different EVAs,F is the
for-ward model describing the physics of the measurements,Kis the weighting function,
5
expressing the sensitivity of the measurements to changes in the aerosol extinction or SO2vertical profile and calculated on-line by the LIDORT RTM,Sεis the measurement uncertainty covariance matrix,xa andSa are the a priori vertical profile and its
corre-sponding error covariance matrix. A priori information is needed in the OEM method in order to reject unrealistic solutions compatible with the measurements. Another
im-10
portant quantity in the OEM is the averaging kernel matrix A, which represents the sensitivity of the retrieval to the true state. More specifically, each elementAi j in the matrixA describes the sensitivity of the retrieval at ith level to the true states at the different altitude levels j. Furthermore, the trace of the matrix A gives the degrees of freedom of signal (DFS), which corresponds to the number of independent pieces
15
of information contained in the measurements. Due to the nonlinearity of the inverse problem in case of aerosols, the solution to Eq. (1) must be iterated until satisfactory convergence is achieved between measured DSCDs and those calculated using the retrieved aerosol extinction vertical profile.
Regarding the choice of the a priori profilexa, a fixed aerosol extinction profile taken
20
from the LOWTRAN climatology is selected for the aerosol profile retrieval step (Clémer et al., 2010). In case of SO2, exponentially decreasing a priori profiles with a fixed scaling height of 0.5 km have been constructed according to the following expression:
xa(z)=VCDa
SH e
−SHZ (2)
where xa(z) is the a priori profile, SH the scaling height (0.5 km), and VCDa is the
25
ACPD
14, 6501–6536, 2014MAX-DOAS measurements of tropospheric SO2 in
Xianghe, China
T. Wang et al.
Title Page
Abstract Introduction
Conclusions References
Tables Figures
◭ ◮
◭ ◮
Back Close
Full Screen / Esc
Printer-friendly Version
Interactive Discussion
Discussion
P
a
per
|
D
iscussion
P
a
per
|
Discussion
P
a
per
|
Discuss
ion
P
a
per
|
i.e. the SO2layer is assumed to be located below the scattering altitude at 30◦EVA, so
that tropospheric SO2VCDs can be derived by applying a geometrical air mass factor (AMF) to measured 30◦ EVA DSCDs (Hönninger et al., 2004; Brinksma et al., 2008;
see also Hendrick et al., 2014). Since the DOAS fitting intervals are different for SO2 and aerosols, the aerosol extinction profiles utilized as input for the calculation of SO2
5
weighting functions have been derived by converting the AODs retrieved in the 338– 370 nm wavelength range to the 305–317.5 nm interval using the Ångström formula (Cachorro et al., 2000), and assuming an exponentially decreasing profile shape with a SH of 0.5 km (see Eq. 2). The single scattering albedo and phase function of aerosols at 360 nm required by bePRO for retrieving aerosol extinction profiles are calculated off
-10
line based on the aerosol size distribution and refractive index retrieved from collocated CIMEL sunphotometer measurements (Holben et al., 1998). The temperature-pressure profiles are obtained from the US standard atmosphere. Finally,SεandSamatrices as well as the retrieval altitude grid are similar as in Clémer et al. (2010) and Hendrick et al. (2014), i.e. in the case of the altitude grid: ten layers of 200 m thickness between
15
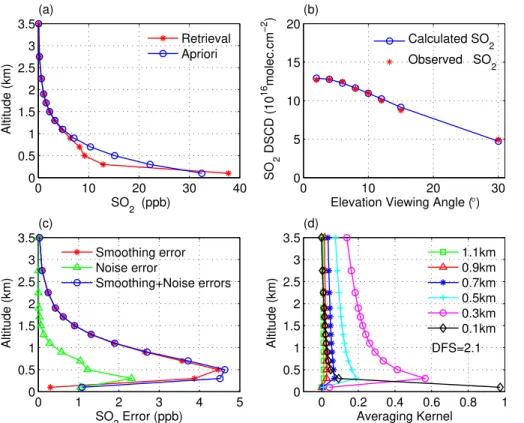
0 and 2 km, two layers of 500 m between 2 and 3 km and 1 layer between 3 and 4 km. Figure 3 shows an example of a SO2profile retrieval (Xianghe, 29 September 2010, 10:15 LT). Figure 3a compares the a priori and retrieved profiles; Fig. 3b shows an example of fit results, i.e. the comparison between measured DSCDs and those calcu-lated from the retrieved profile. The quality of the profile retrieval is checked for each
20
scan by calculating the Root Mean Square Error (RMS) between observed and calcu-lated DSCDs. All retrievals based on the following selection criteria have been selected: RMS<15 %, DFS>0.7, and negative values not allowed. For each year, the number of selected retrievals using these criteria reaches∼75 % of the total number of scans.
Also shown in Fig. 3 are the smoothing and noise errors (c) and the averaging kernels
25
ACPD
14, 6501–6536, 2014MAX-DOAS measurements of tropospheric SO2 in
Xianghe, China
T. Wang et al.
Title Page
Abstract Introduction
Conclusions References
Tables Figures
◭ ◮
◭ ◮
Back Close
Full Screen / Esc
Printer-friendly Version
Interactive Discussion
Discussion
P
a
per
|
D
iscussion
P
a
per
|
Discussion
P
a
per
|
Discuss
ion
P
a
per
|
layer. The averaging kernels show that the retrieval is mainly sensitive to the layer close to the surface in addition to the total vertical column. In this example, the DFS is about 2.1, suggesting that two independent pieces of information can be determined from the measurements.
The error budget is presented in Table 2. Uncertainty related to aerosols is estimated
5
by retrieving SO2 profiles using retrieved AOD plus their corresponding error (i.e. the sum of smoothing and noise errors plus a 20 % error due to the uncertainty on the O4 cross sections; see Clémer et al., 2010) as input and comparing the results to the stan-dard retrievals. The uncertainty on the SO2 cross sections is set to 5 %, as suggested by Vandaele et al. (1994). The uncertainty on the a priori profiles is estimated by taking
10
SH=1 km in Eq. (2) instead of 0.5 km in the standard retrieval. The total uncertainty is calculated by adding the different terms in Gaussian quadrature.
Monthly-mean SO2profiles are shown in Fig. 4. There is a maximum SO2 concentra-tion at the surface for each profile, except in November–December where the maximum is located in the 200–400 m layer. The largest vertical gradient is observed in
Febru-15
ary and November, the smallest in July and August, which is due to the difference in SO2concentration near ground for the different months. This will be discussed in detail below.
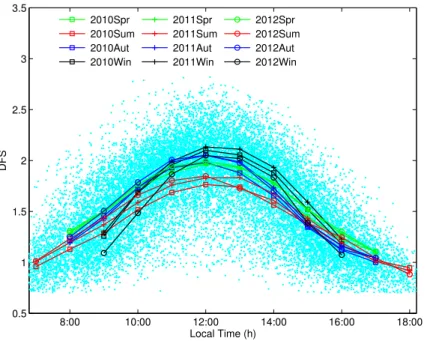
Figure 5 shows the seasonal mean of diurnal cycle of DFS. The diurnal distribution in any season shows a single peak at mid-day due to the fact that the retrieval error at
20
late evening or early morning overweights that at noon. If we compare the DFS around noon among the different seasons, values in summer are lower compared to the other seasons due to the lower SO2amounts observed during this period.
2.4 SO2surface concentration retrieval verification
For verification purpose, our retrieved SO2 surface concentrations have been
com-25
ACPD
14, 6501–6536, 2014MAX-DOAS measurements of tropospheric SO2 in
Xianghe, China
T. Wang et al.
Title Page
Abstract Introduction
Conclusions References
Tables Figures
◭ ◮
◭ ◮
Back Close
Full Screen / Esc
Printer-friendly Version
Interactive Discussion
Discussion
P
a
per
|
D
iscussion
P
a
per
|
Discussion
P
a
per
|
Discuss
ion
P
a
per
|
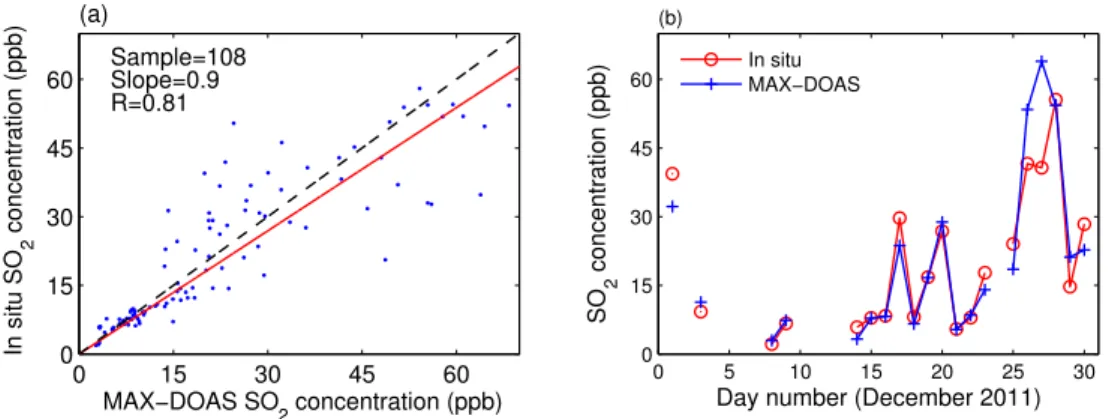
was freshly calibrated are shown in Fig. 6. Hourly and daily averages of SO2 concen-tration are plotted in Fig. 6a and b, respectively. A good agreement is obtained with a correlation coefficient of 0.8 and a slope of 0.9.
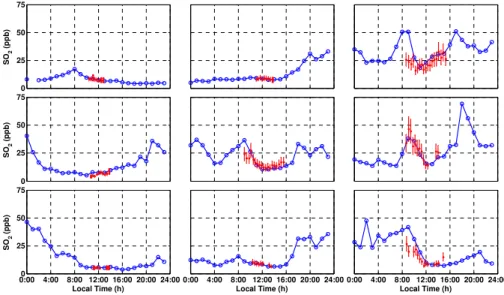
In Fig. 7, the daytime variations of the MAX-DOAS and in-situ SO2surface concen-tration are compared for 9 continuous days. A very good agreement is found between
5
both data sets, indicating the good overall reliability and the robustness of our MAX-DOAS retrievals.
3 Results and discussion
Based on the SO2profiles retrieved for the period from March 2010 to February 2013, we have investigated the daily and seasonal variations of the SO2 VCD and surface
10
concentration and the possible influence of meteorological conditions, including atmo-spheric stability, wind direction and speed. We have adopted the following convention for the season: spring is from March to May, summer from June to August, autumn from September to November, and winter from December to February.
3.1 Seasonal variation of SO2 15
Figure 8a shows that the SO2 VCD is highly correlated with concentration close to the ground (correlation coefficient of 0.88). From Fig. 8b, we see that the temporal evolutions of SO2VCD and concentration are very similar, consistent with the fact that the SO2emission sources are located near the ground.
The monthly averaged SO2 VCD and surface concentrations are shown in Fig. 9.
20
Both show a marked seasonal signature with a maximum in winter and a minimum in summer, implying that SO2originates mainly from human sources rather than natural ones (Lin et al., 2011). Generally, the fluctuations of any atmospheric pollutant in a re-gion of interest can be mainly attributed to three factors: emission level, residence time, and atmospheric transport (Wang et al., 2010; Lin et al., 2011). From the perspective
ACPD
14, 6501–6536, 2014MAX-DOAS measurements of tropospheric SO2 in
Xianghe, China
T. Wang et al.
Title Page
Abstract Introduction
Conclusions References
Tables Figures
◭ ◮
◭ ◮
Back Close
Full Screen / Esc
Printer-friendly Version
Interactive Discussion
Discussion
P
a
per
|
D
iscussion
P
a
per
|
Discussion
P
a
per
|
Discuss
ion
P
a
per
|
of emission level, firstly, owing to enhanced domestic heating and associated coal and oil consumption in winter, the heating-related emissions of SO2 are much larger dur-ing this period than in summer. Secondly, the residence time, defined as the rate of removal mechanisms, also plays an important role in determining the seasonal varia-tion of SO2concentrations (Lee et al., 2011). Processes responsible for the removal of
5
SO2 involve dry and wet deposition and homogeneous or inhomogeneous gas-phase reactions leading to the production of H2SO4or sulfate (Tu et al., 2004). As shown in Fig. 10, the relative humidity is lower in winter, so that the removal of SO2through wet deposition is not as substantial as in summer. Thirdly, the transport can also influence the evolution of SO2at a given location. Although in winter the wind is stronger at
Xi-10
anghe, the emissions also increase during the same period. In addition, the reduced atmospheric boundary layer height and frequent temperature inversion events result in an accumulation of SO2 in the lower troposphere (Meng et al., 2009). In summary, the aforementioned three factors jointly lead to the observed seasonal pattern of SO2 concentration in Xianghe.
15
From Fig. 9, we see that the amount of SO2 strongly increases in November with respect to October, as a consequence of increasing domestic heating (November is the beginning of the domestic heating season). Moreover, the higher wind speed ob-served in December (see Fig. 10) leads to a decrease of SO2during this month due to more efficient diffusion and dilution effects. Finally, it is also noticeable that SO2in
Jan-20
uary 2011 is remarkably lower than that in other years. This will be further discussed below.
3.2 Impact of meteorological conditions
Because of the high correlation coefficient and similar seasonal variations of the SO2 VCD and concentration, we decided to investigate the impact of meteorological
con-25
ACPD
14, 6501–6536, 2014MAX-DOAS measurements of tropospheric SO2 in
Xianghe, China
T. Wang et al.
Title Page
Abstract Introduction
Conclusions References
Tables Figures
◭ ◮
◭ ◮
Back Close
Full Screen / Esc
Printer-friendly Version
Interactive Discussion
Discussion
P
a
per
|
D
iscussion
P
a
per
|
Discussion
P
a
per
|
Discuss
ion
P
a
per
|
variations of temperature and humidity appear to exhibit similar behavior from year to year. This suggests that the contribution of the wind speed and direction as driver for the SO2 VCD variation is probably different over the different years investigated here. For this purpose, we further explore the relationship between SO2and wind (speed and direction), as displayed in Fig. 11. It can be seen that the amount of SO2 is strongly
5
dependent on the wind direction: high VCDs are prominent when the winds blow from the east, because Tangshan, a heavy industrial city releasing large amounts of SO2, is situated to the east of Xianghe; in contrast, the north-west direction corresponds to a minimum in SO2VCD, since it is a mountain area, characterized by much less emis-sions than in Xianghe. The wind therefore contributes significantly to the dispersion of
10
the pollutants, as expected.
We further assess the dependence of SO2on wind speed for a given wind direction. As can be seen in Fig. 11b, the VCD can vary considerably, even for the same wind direction. One can conclude that the SO2 column is inversely proportional to the wind speed in the case of east and south-west winds, since high-emission industrial areas
15
and Tangshan are located to the south-west and east of Xianghe, respectively. In addi-tion, the SO2content in Xianghe is more sensitive to the emission sources in Tangshan (E) than in Beijing (WNW), which is consistent with the fact that Beijing has taken reg-ulatory actions to reduce air pollution through traffic-control measures and the closure of heavy polluting industries initiated before the 2008 Olympic Games (Yu et al., 2010).
20
The annual cycles of SO2are generally in good agreement among the different years. However, the SO2 VCD in January 2011 drastically deviates by up to 30 % from the values during the same month in 2012 and 2013, which is also the case in May 2012. Wind roses in Fig. 12 reveal that the inter-annual variability of wind speed and direc-tion is responsible for the significantly different SO2VCD in January 2011. During that
25
month, the frequency of north-west winds reaches 70 % and wind speed predominantly exceed 5 m s−1. As mentioned above, the strong northwesterly wind favors the
ACPD
14, 6501–6536, 2014MAX-DOAS measurements of tropospheric SO2 in
Xianghe, China
T. Wang et al.
Title Page
Abstract Introduction
Conclusions References
Tables Figures
◭ ◮
◭ ◮
Back Close
Full Screen / Esc
Printer-friendly Version
Interactive Discussion
Discussion
P
a
per
|
D
iscussion
P
a
per
|
Discussion
P
a
per
|
Discuss
ion
P
a
per
|
side and low velocity (<5 m s−1, frequency>50 %) jointly result in relatively high SO 2
VCDs compared to January 2011. Similar features can explain the May 2012 case.
3.3 Diurnal cycle
In Fig. 13, we further compare the diurnal cycles of SO2 VCDs for the different sea-sons. Since the sunshine duration is different in the four seasons, the available time
5
period for MAX-DOAS observations also differs: 07:30–17:30 LT in spring and autumn, 06:30–18:30 LT in summer, and 08:30–16:30 LT in winter. As can be seen, the diurnal cycles for all years are very consistent, especially in summer. In spring and autumn, the retrieved SO2VCDs in autumn 2011 and spring 2012 are significantly higher than those during the same period of the other years due to the anomalous VCD values
10
in November 2011 and May 2012. Furthermore, the amplitude of the SO2 VCD diur-nal cycle, which shows a minimum at noon and a maximum in the morning and late afternoon, is larger in winter. This can be explained by more frequent temperature-inversion events and a strengthened diurnal variation of emission sources during this period (Meng et al., 2009).
15
It should be noted that similar investigations have been done for NO2 (Wang et al., 2014). One can conclude that both NO2 and SO2 display a similar seasonal varia-tion and are impacted in the same way by meteorological condivaria-tions. However, SO2 abundances are always higher than NO2 ones and their diurnal cycles are different, especially in winter and summer: SO2has a more pronounced diurnal cycle than NO2
20
ACPD
14, 6501–6536, 2014MAX-DOAS measurements of tropospheric SO2 in
Xianghe, China
T. Wang et al.
Title Page
Abstract Introduction
Conclusions References
Tables Figures
◭ ◮
◭ ◮
Back Close
Full Screen / Esc
Printer-friendly Version
Interactive Discussion
Discussion
P
a
per
|
D
iscussion
P
a
per
|
Discussion
P
a
per
|
Discuss
ion
P
a
per
|
4 Summary and conclusions
Tropospheric SO2vertical profiles and corresponding column densities at the Xianghe station have been retrieved by applying an OEM-based profiling tool to continuous ground-based MAX-DOAS observations from March 2010 to February 2013. The 305– 317.5 nm wavelength range was found to be the most suitable fitting window for
near-5
noon DOAS analysis of SO2. For verification purpose, retrieved SO2 surface concen-trations have been compared to collocated in-situ data. An excellent agreement was found, with correlation coefficient and slope close to 0.9, demonstrating the reliability and robustness of our retrievals.
These MAX-DOAS measurements have been used to investigate the seasonal and
10
diurnal cycles of SO2vertical columns and surface concentrations, in combination with conventional meteorological data (temperature, humidity, and wind speed and direc-tion). Regarding the seasonal variation, both VCD and surface concentrations exhibit the same patterns, with a maximum in winter (February) and a minimum in summer (July), in accordance with the large emissions due to domestic heating in winter. The
15
high levels of SO2during the cold season are further enhanced by the weakness of the wet deposition mechanism and the frequent temperature-inversion events occurring during this period, favoring the accumulation of SO2 in the atmospheric layers close to the ground. The variation of the SO2 amount in Xianghe is also found to be largely driven by wind speed and direction. In the case of east or southwest wind, the VCD at
20
the station rises with the increase of wind speed, since heavy polluting industries are located to the east and southwest and thus the stronger the wind, the more pollution is transported to Xianghe. With respect to the diurnal cycle, larger SO2 amounts are obtained in the early morning and late evening with a minimum around noon, in line with the diurnal variation of pollutant emission and atmospheric state. Moreover, the
25
ACPD
14, 6501–6536, 2014MAX-DOAS measurements of tropospheric SO2 in
Xianghe, China
T. Wang et al.
Title Page
Abstract Introduction
Conclusions References
Tables Figures
◭ ◮
◭ ◮
Back Close
Full Screen / Esc
Printer-friendly Version
Interactive Discussion
Discussion
P
a
per
|
D
iscussion
P
a
per
|
Discussion
P
a
per
|
Discuss
ion
P
a
per
|
These three-year MAX-DOAS SO2 measurements in Xianghe constitute a unique data set for validating and improving space-borne observations over China, which is the region in the world where anthropogenic SO2emissions are the largest (Yang et al., 2013; Boynard et al., 2014). In particular, retrieved SO2 vertical profiles can be used to verify the a priori profile information used in satellite retrievals. Moreover, the
com-5
bination of both integrated columns and surface concentrations could provide useful information to make explicitly the link between measured satellite columns and surface concentrations.
Acknowledgements. This work was supported by China Scholarship Council, the
Spe-cial Scientific Research Fund of Meteorological Public Welfare Profession of China (Grant
10
no. GYHY201106045-52), and the National Natural Science Foundation of China (Grant no. 41175030). We also acknowledge the Belgian Federal Science Policy Office, Brussels (AGACC-II project), the EU 7th Framework Programme project NORS (contract 284421), and the ESA CEOS Intercalibration project (ESA/ESRIN Contract 22202/09/I-EC).
References
15
Bogumil, K., Orphal, J., Homann, T., Voigt, S., Spietz, P., Fleischmann, O. C., Vogel, A., Hart-mann, M., BovensHart-mann, H., Frerik, J., and Burrows, J. P.: Measurements of molecular ab-sorption spectra with the SCIAMACHY Pre- Flight Model: Instrument characterization and reference spectra for atmospheric remote sensing in the 230–2380 nm region, J. Photoch. Photobio. A, 157, 167–184, 2003.
20
Boynard, A., Clerbaux, C., Clarisse, L., Safieddine, S., Pommier, M., Van Damme, M., Bauduin, S., Oudot, C., Hadji-Lazaro, J., Hurtmans, D., and Coheur, P.-F.: First simultaneous space measurements of atmospheric pollutants in the boundary layer from IASI: a case study in the North China Plain, Geophys. Res. Lett., 41, 645–651, doi:10.1002/2013GL058333, 2014.
25
ACPD
14, 6501–6536, 2014MAX-DOAS measurements of tropospheric SO2 in
Xianghe, China
T. Wang et al.
Title Page
Abstract Introduction
Conclusions References
Tables Figures
◭ ◮
◭ ◮
Back Close
Full Screen / Esc
Printer-friendly Version
Interactive Discussion
Discussion
P
a
per
|
D
iscussion
P
a
per
|
Discussion
P
a
per
|
Discuss
ion
P
a
per
|
Piters, A. J. M., and Levelt, P. F.: The 2005 and 2006 DANDELIONS NO2and aerosol
inter-comparison campaigns, J. Geophys. Res., 113, D16S46, doi:10.1029/2007jd008808, 2008. Cachorro, V. E., Durán, P., Vergaz, R., and de Frutos, A. M.: Measurements of the atmospheric
turbidity of the north-centre continental area in Spain: spectral aerosol optical depth and Ångström turbidity parameters, J. Aerosol Sci., 31, 687–702, 2000.
5
Chance, K. V. and Spurr, R. J.: Ring effect studies: Rayleigh scattering, including molecular parameters for rotational Raman scattering, and the Fraunhofer spectrum, Appl. Optics, 36, 5224–5230, 1997.
Clémer, K., Van Roozendael, M., Fayt, C., Hendrick, F., Hermans, C., Pinardi, G., Spurr, R., Wang, P., and De Mazière, M.: Multiple wavelength retrieval of tropospheric aerosol
opti-10
cal properties from MAXDOAS measurements in Beijing, Atmos. Meas. Tech., 3, 863–878, doi:10.5194/amt-3-863-2010, 2010.
Eisinger, M. and Burrows, J. P.: Tropospheric sulfur dioxide observed by the ERS-2/GOME instrument, Geophys. Res. Lett., 25, 4177–4180, doi:10.1029/1998GL900128, 1998. Fioletov, V. E., McLinden, C. A., Krotkov, N., Yang, K., Loyola, D. G., Valks, P., Theys, N., Van
15
Roozendael, M., Nowlan, C. R., Chance, K., Liu, X., Lee, C., and Martin, R. V.: Application of OMI, SCIAMACHY, and GOME-2 satellite SO2 retrievals for detection of large emission
sources, J. Geophys. Res.-Atmos., 118, 11399–11418, doi:10.1002/jgrd.50826, 2013. Fleischmann, O. C., Hartmann, M., Burrows, J. P., and Orphal, J.: New ultraviolet absorption
cross-sections of BrO at atmospheric temperatures measured by time-windowing Fourier
20
transform spectroscopy, J. Photoch. Photobio. A, 168, 117–132, 2004.
Frieß, U., Monks, P. S., Remedios, J. J., Rozanov, A., Sinreich, R., Wagner, T., and Platt, U.: MAX-DOAS O4 measurements: a new technique to derive information on atmospheric aerosols: 2. Modeling studies, J. Geophys. Res., 111, D14203, doi:10.1029/2005jd006618, 2006.
25
Frieß, U., Sihler, H., Sander, R., Pöhler, D., Yilmaz, S., and Platt, U.: The vertical distribution of BrO and aerosols in the Arctic: measurements by active and passive differential optical ab-sorption spectroscopy, J. Geophys. Res., 116, D00R04, doi:10.1029/2011JD015938, 2011. Frins, E., Osorio, M., Casaballe, N., Belsterli, G., Wagner, T., and Platt, U.: DOAS-measurement
of the NO2 formation rate from NOx emissions into the atmosphere, Atmos. Meas. Tech., 5, 30
1165–1172, doi:10.5194/amt-5-1165-2012, 2012.
ACPD
14, 6501–6536, 2014MAX-DOAS measurements of tropospheric SO2 in
Xianghe, China
T. Wang et al.
Title Page
Abstract Introduction
Conclusions References
Tables Figures
◭ ◮
◭ ◮
Back Close
Full Screen / Esc
Printer-friendly Version
Interactive Discussion
Discussion
P
a
per
|
D
iscussion
P
a
per
|
Discussion
P
a
per
|
Discuss
ion
P
a
per
|
function growth in southern California children, Am. J. Resp. Crit. Care., 162, 1383–1390, 2000.
Grainger, J. and Ring, J.: Anomalous Fraunhofer line profiles, Nature, 193, p. 762, 1962. Großmann, K., Frieß, U., Peters, E., Wittrock, F., Lampel, J., Yilmaz, S., Tschritter, J.,
Som-mariva, R., von Glasow, R., Quack, B., Krüger, K., Pfeilsticker, K., and Platt, U.: Iodine
5
monoxide in the Western Pacific marine boundary layer, Atmos. Chem. Phys., 13, 3363– 3378, doi:10.5194/acp-13-3363-2013, 2013.
Heckel, A., Richter, A., Tarsu, T., Wittrock, F., Hak, C., Pundt, I., Junkermann, W., and Bur-rows, J. P.: MAX-DOAS measurements of formaldehyde in the Po-Valley, Atmos. Chem. Phys., 5, 909–918, doi:10.5194/acp-5-909-2005, 2005.
10
Hendrick, F., Müller, J.-F., Clémer, K., Wang, P., De Mazière, M., Fayt, C., Gielen, C., Her-mans, C., Ma, J. Z., Pinardi, G., Stavrakou, T., Vlemmix, T., and Van Roozendael, M.: Four years of ground-based MAX-DOAS observations of HONO and NO2 in the Beijing area,
Atmos. Chem. Phys., 14, 765–781, doi:10.5194/acp-14-765-2014, 2014.
Hermans, C., Vandaele, A., Fally, S., Carleer, M., Colin, R., Coquart, B., Jenouvrier, A., and
15
Merienne, M.-F.: Absorption cross-section of the collision-induced bands of oxygen from the UV to the NIR, in: Weakly interacting molecular pairs: unconventional absorbers of radiation in the atmosphere, Springer, 193–202, 2003.
Holben, B., Eck, T., Slutsker, I., Tanre, D., Buis, J., Setzer, A., Vermote, E., Reagan, J., Kauf-man, Y., and Nakajima, T.: AERONET – a federated instrument network and data archive for
20
aerosol characterization, Remote Sens. Environ., 66, 1–16, 1998.
Hönninger, G., von Friedeburg, C., and Platt, U.: Multi axis differential optical absorption spectroscopy (MAX-DOAS), Atmos. Chem. Phys., 4, 231–254, doi:10.5194/acp-4-231-2004, 2004.
Irie, H., Takashima, H., Kanaya, Y., Boersma, K. F., Gast, L., Wittrock, F., Brunner, D., Zhou, Y.,
25
and Van Roozendael, M.: Eight-component retrievals from ground-based MAX-DOAS obser-vations, Atmos. Meas. Tech., 4, 1027–1044, doi:10.5194/amt-4-1027-2011, 2011.
Krotkov, N. A., Carn, S. A., Krueger, A. J., Bhartia, P. K., and Yang, K.: Band residual difference algorithm for retrieval of SO2 from the aura Ozone Monitoring Instrument (OMI), IEEE T.
Geosci. Remote, 44, 1259–1266, 2006.
30
ACPD
14, 6501–6536, 2014MAX-DOAS measurements of tropospheric SO2 in
Xianghe, China
T. Wang et al.
Title Page
Abstract Introduction
Conclusions References
Tables Figures
◭ ◮
◭ ◮
Back Close
Full Screen / Esc
Printer-friendly Version
Interactive Discussion
Discussion
P
a
per
|
D
iscussion
P
a
per
|
Discussion
P
a
per
|
Discuss
ion
P
a
per
|
air mass factor algorithm development, validation, and error analysis, J. Geophys. Res., 114, D22303, doi:10.1029/2009JD012123, 2009.
Lee, C., Martin, R. V., van Donkelaar, A., Lee, H., Dickerson, R. R., Hains, J. C., Krotkov, N., Richter, A., Vinnikov, K., and Schwab, J. J.: SO2 emissions and lifetimes: estimates from
inverse modeling using in situ and global, spacebased (SCIAMACHY and OMI)
observa-5
tions, J. Geophys. Res., 116, D06304, doi:10.1029/2010JD014758, 2011.
Li, C., Marufu, L. T., Dickerson, R. R., Li, Z., Wen, T., Wang, Y., Wang, P., Chen, H., and Stehr, J. W.: In situ measurements of trace gases and aerosol optical properties at a rural site in northern China during East Asian Study of Tropospheric Aerosols: an international regional experiment 2005, J. Geophys. Res., 112, D22S04, doi:10.1029/2006JD007592, 2007.
10
Lin, W., Xu, X., Ge, B., and Liu, X.: Gaseous pollutants in Beijing urban area during the heating period 2007–2008: variability, sources, meteorological, and chemical impacts, Atmos. Chem. Phys., 11, 8157–8170, doi:10.5194/acp-11-8157-2011, 2011.
Ma, J. Z., Beirle, S., Jin, J. L., Shaiganfar, R., Yan, P., and Wagner, T.: Tropospheric NO2vertical
column densities over Beijing: results of the first three years of ground-based MAX-DOAS
15
measurements (2008–2011) and satellite validation, Atmos. Chem. Phys., 13, 1547–1567, doi:10.5194/acp-13-1547-2013, 2013.
Meller, R. and Moortgat, G. K.: Temperature dependence of the absorption cross sections of formaldehyde between 223 and 323 K in the wavelength range 225–375 nm, J. Geophys. Res., 105, 7089–7101, 2000.
20
Meng, X., Wang, P., Wang, G., Yu, H., and Zong, X.: Variation and transportation character-istics of SO2 in winter over Beijing and its surrounding areas, Climatic and Environmental
Research, 14, 309–317, 2009 (in Chinese).
Nowlan, C. R., Liu, X., Chance, K. V., Cai, Z., Kurosu, T. P., Lee, C., and Martin, R. V.: Re-trievals of sulfur dioxide from the Global Ozone Monitoring Experiment 2 (GOME-2) using an
25
optimal estimation approach: algorithm and initial validation, J. Geophys. Res., 116, D18301, doi:10.1029/2011JD015808, 2011.
Platt, U. and Stuz, J.: Differential Optical Absorption Spectroscopy (DOAS), Principles and Applications, ISBN 978-3-540-21193-8, Springer, Berlin-Heidelberg, 2008.
Rodgers, C. D.: Inverse methods for atmospheric sounding: theory and practice, World
Scien-30
tific Publishing, Singapore, New Jersey, London, Hong Kong, 2000.
ACPD
14, 6501–6536, 2014MAX-DOAS measurements of tropospheric SO2 in
Xianghe, China
T. Wang et al.
Title Page
Abstract Introduction
Conclusions References
Tables Figures
◭ ◮
◭ ◮
Back Close
Full Screen / Esc
Printer-friendly Version
Interactive Discussion
Discussion
P
a
per
|
D
iscussion
P
a
per
|
Discussion
P
a
per
|
Discuss
ion
P
a
per
|
Griesfeller, A., Grossmann, K., Hemerijckx, G., Hendrick, F., Herman, J., Hermans, C., Irie, H., Johnston, P. V., Kanaya, Y., Kreher, K., Leigh, R., Merlaud, A., Mount, G. H., Navarro, M., Oetjen, H., Pazmino, A., Perez-Camacho, M., Peters, E., Pinardi, G., Puent-edura, O., Richter, A., Schönhardt, A., Shaiganfar, R., Spinei, E., Strong, K., Takashima, H., Vlemmix, T., Vrekoussis, M., Wagner, T., Wittrock, F., Yela, M., Yilmaz, S., Boersma, F.,
5
Hains, J., Kroon, M., Piters, A., and Kim, Y. J.: Intercomparison of slant column measure-ments of NO2and O4by MAX-DOAS and zenith-sky UV and visible spectrometers, Atmos.
Meas. Tech., 3, 1629–1646, doi:10.5194/amt-3-1629-2010, 2010.
Tu, F. H., Thornton, D. C., Bandy, A. R., Carmichael, G. R., Tang, Y., Thornhill, K. L., Sachse, G. W., and Blake, D. R.: Long-range transport of sulfur dioxide in the central
Pa-10
cific, J. Geophys. Res., 109, D15S08, doi:10.1029/2003JD004309, 2004.
Vandaele, A., Simon, P. C., Guilmot, J. M., Carleer, M., and Colin, R.: SO2 absorption cross
section measurement in the UV using a Fourier transform spectrometer, J. Geophys. Res., 99, 25599–25605, 1994.
Vandaele, A. C., Hermans, C., Simon, P. C., Carleer, M., Colin, R., Fally, S., Merienne, M.-F.,
15
Jenouvrier, A., and Coquart, B.: Measurements of the NO2 absorption cross-section from
42 000 cm−1 to 10 000 cm−1(238–1000 nm) at 220 K and 294 K, J. Quant. Spectrosc. Ra., 59, 171–184, 1998.
Vlemmix, T., Piters, A. J. M., Stammes, P., Wang, P., and Levelt, P. F.: Retrieval of tropo-spheric NO2 using the MAX-DOAS method combined with relative intensity measurements 20
for aerosol correction, Atmos. Meas. Tech., 3, 1287–1305, doi:10.5194/amt-3-1287-2010, 2010.
Wagner, T., Dix, B., von Friedeburg, C., Friess, U., Sanghavi, S., Sinreich, R., and Platt, U.: MAX-DOAS O4 measurements: a new technique to derive information on
atmo-spheric aerosols – Principles and information content, J. Geophys. Res., 109, D22205,
25
doi:10.1029/2004jd004904, 2004.
Wagner, T., Beirle, S., Brauers, T., Deutschmann, T., Frieß, U., Hak, C., Halla, J. D., Heue, K. P., Junkermann, W., Li, X., Platt, U., and Pundt-Gruber, I.: Inversion of tropospheric profiles of aerosol extinction and HCHO and NO2mixing ratios from MAX-DOAS observations in Milano
during the summer of 2003 and comparison with independent data sets, Atmos. Meas. Tech.,
30
4, 2685–2715, doi:10.5194/amt-4-2685-2011, 2011.
ACPD
14, 6501–6536, 2014MAX-DOAS measurements of tropospheric SO2 in
Xianghe, China
T. Wang et al.
Title Page
Abstract Introduction
Conclusions References
Tables Figures
◭ ◮
◭ ◮
Back Close
Full Screen / Esc
Printer-friendly Version
Interactive Discussion
Discussion
P
a
per
|
D
iscussion
P
a
per
|
Discussion
P
a
per
|
Discuss
ion
P
a
per
|
during the 2008 Beijing Olympics: secondary pollutants and regional impact, Atmos. Chem. Phys., 10, 7603–7615, doi:10.5194/acp-10-7603-2010, 2010.
Wang, T., Wang, P., Yu, H., Zhang, X., Zhou, B., Si, F., Wang, S., Bai, W., Zhou, H., and Zhao, H.: Intercomparison of slant column measurements of NO2by ground-based MAX-DOAS, Acta
Phys. Sin., 62, 054206, doi:10.7498/aps.62.054206, 2013.
5
Wang, T., Wang, P., Yu, H., and Sun, L.: Analysis of the characteristics of tropospheric NO2
in Xianghe based on MAX-DOAS measurement, Climatic and Environmental Research, 19, 51–60, 2014 (in Chinese).
Wang, W., Chai, F., Zhang, K., Wang, S., Chen, Y., Wang, X., and Yang, Y.: Study on ambient air quality in Beijing for the summer 2008 Olympic Games, Air Qual. Atmos. Healt, 1, 31–36,
10
2008.
Wittrock, F., Oetjen, H., Richter, A., Fietkau, S., Medeke, T., Rozanov, A., and Burrows, J. P.: MAX-DOAS measurements of atmospheric trace gases in Ny-Ålesund - Radiative transfer studies and their application, Atmos. Chem. Phys., 4, 955–966, doi:10.5194/acp-4-955-2004, 2004.
15
Wu, F. C., Xie, P. H., Li, A., Chan, K. L., Hartl, A., Wang, Y., Si, F. Q., Zeng, Y., Qin, M., Xu, J., Liu, J. G., Liu, W. Q., and Wenig, M.: Observations of SO2and NO2by mobile DOAS in the
Guangzhou eastern area during the Asian Games 2010, Atmos. Meas. Tech., 6, 2277–2292, doi:10.5194/amt-6-2277-2013, 2013.
Yan, P., Huang, J., and Draxler, R.: The long-term simulation of surface SO2 and evaluation 20
of contributions from the different emission sources to Beijing city, Sci. China Ser. D, 48, 196–208, 2005.
Yan, P., Wang, X., Wang, Z., and Wu, Q.: Analysis of decreases in NO2concentrations during Beijing Olympic Games in 2008, Climatic and Environmental Research, 15, 609–615, 2010 (in Chinese).
25
Yang, K., Dickerson, R. R., Carn, S. A., Ge, C., and Wang, J.: First observations of SO2from
satellite Suomi NPP OMPS: widespread air pollution events over China, Geophys. Res. Lett., 40, 4957–4962, doi:10.1002/grl.50952, 2013.
Yu, H., Wang, P., Zong, X., Li, X., and Lü, D.: Change of NO2 column density over Beijing
from satellite measurement during the Beijing 2008 Olympic Games, Chinese Sci. Bull., 55,
30
ACPD
14, 6501–6536, 2014MAX-DOAS measurements of tropospheric SO2 in
Xianghe, China
T. Wang et al.
Title Page
Abstract Introduction
Conclusions References
Tables Figures
◭ ◮
◭ ◮
Back Close
Full Screen / Esc
Printer-friendly Version
Interactive Discussion
Discussion
P
a
per
|
D
iscussion
P
a
per
|
Discussion
P
a
per
|
Discuss
ion
P
a
per
|
Table 1.Settings used for the SO2and O4DOAS analysis.
Parameter Data source Fitting intervals (nm)
338–370 (O4) 305–317.5 (SO2)
NO2 Vandaele et al. (1998) 220 K, 294 K x x (only 294 K)
SO2 Vandaele et al. (1994) 294 K x
O3 Bogumil et al. (2003) 223 K, 243 K x (only 223 K) x
O4 Hermans et al. (2003) 296 K x
BrO Fleischmann et al. (2004) 223 K x
H2CO Meller and Moortgat (2000) 293 K x
Ring Chance and Spurr (1997) x x
ACPD
14, 6501–6536, 2014MAX-DOAS measurements of tropospheric SO2 in
Xianghe, China
T. Wang et al.
Title Page
Abstract Introduction
Conclusions References
Tables Figures
◭ ◮
◭ ◮
Back Close
Full Screen / Esc
Printer-friendly Version
Interactive Discussion
Discussion
P
a
per
|
D
iscussion
P
a
per
|
Discussion
P
a
per
|
Discuss
ion
P
a
per
|
Table 2.Error budget of retrieved SO2concentration (0–200 m) and VCD.
Uncertainty (%) Concentration (0–200 m) VCD
Smoothing+noise errors 13 11
Uncertainty related to aerosols 18 7
Uncertainty related to the a priori 9 17
Uncertainty on SO2cross section 5 5
ACPD
14, 6501–6536, 2014MAX-DOAS measurements of tropospheric SO2 in
Xianghe, China
T. Wang et al.
Title Page
Abstract Introduction
Conclusions References
Tables Figures
◭ ◮
◭ ◮
Back Close
Full Screen / Esc
Printer-friendly Version
Interactive Discussion
Discussion
P
a
per
|
D
iscussion
P
a
per
|
Discussion
P
a
per
|
Discuss
ion
P
a
per
|
D
if
fer
ent
ial
O
p
ti
cal
D
e
nsi
ty (
x10
-3 ) 0 5 10 15
Reference Spectrum Observed Spectrum
-4 -2 0 2 4
Residual
-4 0 4 8
Calculated O3
Observed O3
305 307 309 311 313 315 317 -10
0 10 20
Wavelength (nm)
Calculated SO2
Observed SO2
Fig. 2.Example of DOAS fit result for SO2. It corresponds to 29 September 2010 at 11:20 LT.
ACPD
14, 6501–6536, 2014MAX-DOAS measurements of tropospheric SO2 in
Xianghe, China
T. Wang et al.
Title Page
Abstract Introduction
Conclusions References
Tables Figures
◭ ◮
◭ ◮
Back Close
Full Screen / Esc
Printer-friendly Version
Interactive Discussion
Discussion
P
a
per
|
D
iscussion
P
a
per
|
Discussion
P
a
per
|
Discuss
ion
P
a
per
|
0 10 20 30
0 5 10 15 20
Elevation Viewing Angle (°)
SO
2
DSCD (10
16
molec.cm
−2
) (b)
Calculated SO 2 Observed SO2
0 1 2 3 4 5
0 0.5 1 1.5 2 2.5 3 3.5
SO2 Error (ppb)
Altitude (km)
(c)
Smoothing error Noise error
Smoothing+Noise errors
0 10 20 30 40
0 0.5 1 1.5 2 2.5 3 3.5
SO2 (ppb)
Altitude (km)
(a)
Retrieval Apriori
0 0.2 0.4 0.6 0.8 1
0 0.5 1 1.5 2 2.5 3 3.5
Averaging Kernel
Altitude (km)
(d)
DFS=2.1 1.1km 0.9km 0.7km 0.5km 0.3km 0.1km
Fig. 3.Example of SO2vertical profile retrieval from MAX-DOAS measurements 3 at Xianghe
ACPD
14, 6501–6536, 2014MAX-DOAS measurements of tropospheric SO2 in
Xianghe, China
T. Wang et al.
Title Page
Abstract Introduction
Conclusions References
Tables Figures
◭ ◮
◭ ◮
Back Close
Full Screen / Esc
Printer-friendly Version
Interactive Discussion
Discussion
P
a
per
|
D
iscussion
P
a
per
|
Discussion
P
a
per
|
Discuss
ion
P
a
per
|
0 15 30 45
0 0.5 1 1.5 2 2.5 3 3.5
SO
2 (ppb)
A
ltitu
d
e
(
k
m
)
Jan Feb Mar Apr May Jun Jul Aug Sep Oct Nov Dec
Fig. 4.Monthly-averaged SO2 concentration vertical profiles for the March 2010–3 February
ACPD
14, 6501–6536, 2014MAX-DOAS measurements of tropospheric SO2 in
Xianghe, China
T. Wang et al.
Title Page
Abstract Introduction
Conclusions References
Tables Figures
◭ ◮
◭ ◮
Back Close
Full Screen / Esc
Printer-friendly Version
Interactive Discussion
Discussion
P
a
per
|
D
iscussion
P
a
per
|
Discussion
P
a
per
|
Discuss
ion
P
a
per
|
8:00 10:00 12:00 14:00 16:00 18:00
0.5 1 1.5 2 2.5 3 3.5
DFS
Local Time (h) 2010Spr
2010Sum 2010Aut 2010Win
2011Spr 2011Sum 2011Aut 2011Win
2012Spr 2012Sum 2012Aut 2012Win
ACPD
14, 6501–6536, 2014MAX-DOAS measurements of tropospheric SO2 in
Xianghe, China
T. Wang et al.
Title Page
Abstract Introduction
Conclusions References
Tables Figures
◭ ◮
◭ ◮
Back Close
Full Screen / Esc
Printer-friendly Version
Interactive Discussion
Discussion
P
a
per
|
D
iscussion
P
a
per
|
Discussion
P
a
per
|
Discuss
ion
P
a
per
|
0 15 30 45 60
0 15 30 45 60
MAX−DOAS SO2 concentration (ppb)
In situ SO
2
concentration (ppb)
Sample=108 Slope=0.9 R=0.81 (a)
0 5 10 15 20 25 30
0 15 30 45 60
Day number (December 2011)
SO
2
concentration (ppb)
(b)
In situ MAX−DOAS
Fig. 6. (a) Scatter plot of in situ SO2 surface concentrations (0–200 m layer) against
MAX-DOAS data for December 2011 (hourly-averaged concentrations). The red line denotes the linear least-squares fit to the data.(b) Temporal evolution of daily averaged MAX-DOAS and in situ SO2concentrations during December 2011. Gaps in the data series are due to missing
ACPD
14, 6501–6536, 2014MAX-DOAS measurements of tropospheric SO2 in
Xianghe, China
T. Wang et al.
Title Page
Abstract Introduction
Conclusions References
Tables Figures
◭ ◮
◭ ◮
Back Close
Full Screen / Esc
Printer-friendly Version
Interactive Discussion
Discussion
P
a
per
|
D
iscussion
P
a
per
|
Discussion
P
a
per
|
Discuss
ion
P
a
per
|
0 25 50 75
SO
2
(ppb
)
0 25 50 75
SO
2
(p
pb)
0:000 4:00 8:00 12:00 16:00 20:00 24:00
25 50 75
SO
2
(p
pb)
Local Time (h)
0:00 4:00 8:00 12:00 16:00 20:00 24:00
Local Time (h)
0:00 4:00 8:00 12:00 16:00 20:00 24:00
Local Time (h)
Fig. 7.Comparison between in situ (blue, hourly means) and MAX-DOAS SO2surface
ACPD
14, 6501–6536, 2014MAX-DOAS measurements of tropospheric SO2 in
Xianghe, China
T. Wang et al.
Title Page
Abstract Introduction
Conclusions References
Tables Figures
◭ ◮
◭ ◮
Back Close
Full Screen / Esc
Printer-friendly Version
Interactive Discussion
Discussion
P
a
per
|
D
iscussion
P
a
per
|
Discussion
P
a
per
|
Discuss
ion
P
a
per
|
0 20 40 60 80 100
0 5 10 15 20 25
SO
2 (ppb)
SO
2
V
CD (1
0
16m
o
lec.
c
m
-2)
Y=0.15X+0.7 R=0.88 (a)
0 2 4 6 8
SO
2
V
CD (1
0
16m
o
lec.
c
m
-2)
Jan2010 Jul2010 Jan2011 Jul2011 Jan2012 Jul2012 Jan20130
10 20 30 40
SO
2
(
ppb)
(b)
Fig. 8. (a) Scatter plot of SO2 VCD against surface concentration. The red line represents
ACPD
14, 6501–6536, 2014MAX-DOAS measurements of tropospheric SO2 in
Xianghe, China
T. Wang et al.
Title Page
Abstract Introduction
Conclusions References
Tables Figures
◭ ◮
◭ ◮
Back Close
Full Screen / Esc
Printer-friendly Version
Interactive Discussion
Discussion
P
a
per
|
D
iscussion
P
a
per
|
Discussion
P
a
per
|
Discuss
ion
P
a
per
|
Jan FebMar Apr MayJun Jul AugSep Oct NovDec 0
2 4 6 8
SO
2
VCD (10
16
molec.cm
−2
)
(a)
2010 2011 2012 2013
Jan FebMar Apr MayJun Jul AugSep Oct NovDec 0
10 20 30 40 50
SO
2
(ppb)
(b)
2010 2011 2012 2013
Fig. 9.Monthly mean SO2VCD(a)and surface concentration(b)for the March 2010–February
ACPD
14, 6501–6536, 2014MAX-DOAS measurements of tropospheric SO2 in
Xianghe, China
T. Wang et al.
Title Page
Abstract Introduction
Conclusions References
Tables Figures
◭ ◮
◭ ◮
Back Close
Full Screen / Esc
Printer-friendly Version
Interactive Discussion
Discussion
P
a
per
|
D
iscussion
P
a
per
|
Discussion
P
a
per
|
Discuss
ion
P
a
per
|
-5 0 5 10 15 20 25 30
T
e
m
p
er
at
ur
e (
°C
)
Jan Feb Mar Apr May Jun Jul Aug Sep Oct Nov Dec 1
2 3 4 5 6
W
in
d
(m
.s
-1 )
0 0.2 0.4 0.6 0.8 1
R
e
la
ti
v
e
H
u
mi
d
ity
Fig. 10.Seasonal cycles (monthly means) of temperature, humidity, and wind speed in 2010