Abstract
In this study the use of short glass, carbon and hybrid glass-carbon fibers reinforced polymeric composites in power transmission cou-pling is investigated. The presented work is generalized to thermo-plastic and thermoset polymeric matrix composites. The effects of the constituents weight percentages, and average fibers length on the composite tensile strength and modulus are studied using the Taguchi design of experiments method. A new approach of Finite Element analysis is introduced to model the effect of the hybrid fibers random distribution and average fibers length among the volume of the matrix. Each fiber is simulated independently in the model as a three dimensional truss element embedded in the ma-trix. The FEA model is applied on the tensile specimen and then on the power transmission coupling simulation. Finally, the new approach of finite element analysis results on the coupling are vali-dated.
Keywords
Short fibers, power transmission coupling, finite element analysis
Application of Short Fibers Reinforced Composites
in Power Transmission Coupling
1 INTRODUCTION
Power transmission coupling and other mechanical transmission elements are usually manufactured from steel that results in relatively heavy products. In automotive, airplanes, space and other auto-mobile applications light power transmission elements are required to reduce the energy consumption. Composite couplings provide good features including corrosion resistance, high-misalignment capacity, excellent fatigue resistance, low weight, and ease of installation (Rexnord, 2016). Fibers reinforced composites are good solutions where high properties are combined with light weight benefits. Short
K. Hamza a, * A. Y. Shash b M. Abdrabou c
a Engineering & Materials Sciences
De-partment , German University in Cairo, Egypt
[email protected] b Mechanical Design and Production
Department, Cairo University, Giza [email protected]
c Mechanical Design and Production
Department, Cairo University, Giza [email protected]
* Corresponding author
http://dx.doi.org/10.1590/1679-78253414
Fiber reinforced thermoplastics can be used in many applications with the same manufacturing tech-niques used with unfilled plastics. Fibers reinforced plastics are increasingly used in plastic injected products due to their high their enhanced specific stiffness, and strength (Don Robbins, 2015). The prediction of short natural fibers composites mechanical properties is very critical and should depend on experimental work. P.J. Herrera-Franco (2005) studied the interficial properties between natural fibes and High density polyetheylene. The results showed great deviation and nonlinearity in the properties due to the many parameters affecting the interfacial bond strength. This complexity requires better simulation technique in order to reduce the required number of experiments needed to know the properties of the composite. Many studies are being conducted on studying the effect of fibers addition to polymers through pallets injection, powder injection, and compression molding. The influence of orientation of short carbon fibers in composites in powder injected composites on the shear properties is studied experimentally by Shirazi (2014) to enhance the composite properties by controlling the flow parameters in the powder injection technologies. The properties of the short fibers composites are dramatically dependent on the orientation of the fiber to the direction of the measured properties. Seyyedvahid M., and Fatemi, A., (2014) studied the anisotropy effect of the measured properties in the tensile test between the in flow direction of injection and perpendicular direction. Their results showed a significant drop in the tensile strength and modulus of the perpendicular direction compared to the in flow direction. The effect of reprocessing on fiber length distribution, tensile strength and impact strength of injection molded cellulose fiber-reinforced polylactide (PLA) composites was conducted by (Graupner, N.; Albrecht, K.; Ziegmann, G.; Enzler, H.; Müssig, J., 2016). All the conducted studies showed a dramatic effect for the fibers type, alignment, length, and processing parameters on the composite performance (Lu, 2002). This research shows a new approach of modeling the short fibers reinforced composites, where each fiber is simulated independently. The results can be visualized on the each type and segment of used fiber even with hybrid fibers compo-sites. The problem of the available micromechanical models is the inability to accurately predict these composites’ properties, performance, and durability (P. Satheesh Kumar, 2010). The available micro-mechanical models are not practical with 3D bulky fibers composites. The reason is that these models deal with the composite as a homogenous material with average properties (Lu, 2002). The suggested simulation technique provide practical estimates of the composite performance, and a powerful de-sign optimization tool. The hybrid fibers percentages, inhomogeneous distribution and average length can be used as design optimization parameters. The objective of the optimizing process is to get closer to the required tensile and young’s modulus values.
were conducted to check the processing parameters and effect on the product average fibers length and orientation since this will dramatically affect the properties being simulated. (Akira I., 2015) studied the effect of the screw design on the resulting average fibers length of the glass fibers injected polypropylene. The study of the processing effects on the products can be a guidance to our simula-tion parameters for a more validated simulasimula-tion compared to the properties of experimental samples with much longer fibers. Both thermoplastic and thermoset matrices are also applicable on the model. The interaction between the fibers and the matrix is also defined. The local stresses on the fibers are recorded and the average on the composite as well. Hybrid carbon-glass fibers reinforced epoxy with the design of experiments factorial design is experimentally performed on 9 runs with 3 replications each. The same runs are also performed using the FEA model. The results of both the experimental and model runs are compared to validate the FEA model. Using the design of experiments technique, an analytical mathematical model is presented to predict the composite tensile strength and modulus as a function of the studied three parameters nonlinearly.
Finally the suggested Finite element approach is used in the simulation of a rigid coupling. The simulation loading and boundary conditions are performed based on (Rivin, 2008) guidelines for power transmission coupling design. The results are compared with the conventional isotropic simu-lation results. The isotropic simusimu-lation assumes isotropic homogenous properties of the coupling material. The values of these isotropic homogenous properties are got from experimental testing results using the ASTM (D3039, 2014). The two results of the power transmission coupling simula-tion and compared to validate the suggested new technique of fibers composites simulasimula-tion. Then the presented FEA model can be used for better optimization of products made from fibers rein-forced composites with lower dependence on experimental investigations.
2 EXPERIMENTAL WORK
In this section the experimental work used in studying the average fibers length and percentage on the tensile strength and modulus is reported. The procedure that will be used to study these pa-rameters is the Taguchi design of experiments to optimize the number of experiments. The main target of the experimental work is to provide a validation for the Finite element modeling that will be discussed in section three.
2.1 Design of Experiments
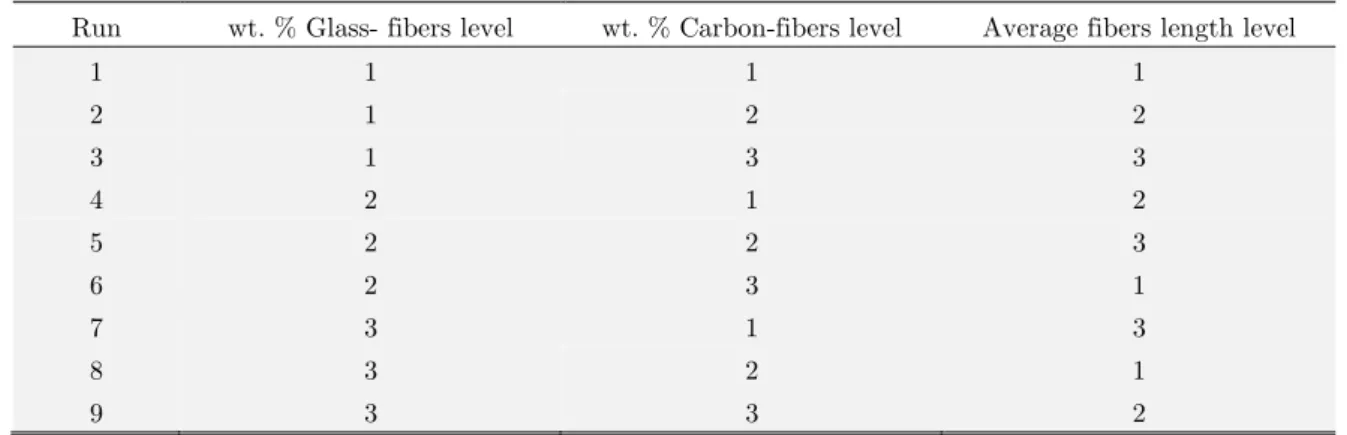
In this part the methodology of studying the carbon fibers volume percentages, glass fibers volume percentage, and the average fibers length on the tensile strength and modulus is discussed. Three parameters are studied with three different levels as shown table 1. The design of experiments pre-sented here will be followed during the modeling and the experimental testing. An L27OA “27 runs
orthogonal array” is required to study the three parameters with three levels. We will use a frac-tional factorial design with L9OA (9 runs orthogonal array) as shown in Table 1 instead of using
Level Carbon Fibers Volume % Glass Fibers Volume % Average Fibers Length
1 5% 5% 5 mm
2 10% 10% 20 mm
3 20% 20% 50 mm
Table 1: Design of Experiments parameters Levels
Table 2 shows the different runs of the L9OA results using the experimental method and the
proposed model.
Run wt. % Glass- fibers level wt. % Carbon-fibers level Average fibers length level
1 1 1 1
2 1 2 2
3 1 3 3
4 2 1 2
5 2 2 3
6 2 3 1
7 3 1 3
8 3 2 1
9 3 3 2
Table 2: L9OA (9 runs orthogonal array) fractional factorial design for 3 parameters and 3 levels
2.2 Tensile Testing
The tensile test was performed to each of the nine runs with three replications per each. All the runs and replications were performed in the same time under the same conditions of vacuum and processing temperature. The tensile specimen was manufactured according to the ASTM (D3039, 2014) design and guidelines. The selected specimen geometry and end taps are showed in figure 1.
Fibers were cut according to the required length using a custom fiber scissor, and then the av-erage fibers length were measured and adjusted to the studied levels. The fibers were weighed using a 0.01 mg accuracy digital balance in order to achieve the required fibers weight percentage.
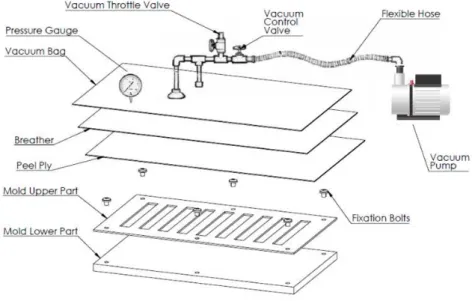
Figure 2 shows that a two piece wooden mold was manufactured to mold the composites mate-rials using the vacuum bagging technique in order to keep the air bubbles and voids volume less than 2% from the composite total volume.
Figure 2: Vacuum bagging technique performed on the molding of the composite tensile specimen.
First, the mold was waxed with three layers of wax and a layer of polyvinyl alcohol "PVA" , then the epoxy resin components were mixed and added to the mold to fill the cavity with the fi-bers. The fibers and epoxy were added with random and homogenous distribution. Then, vacuum were applied according to the conventional vacuum bagging technique. A Peel Ply sheet of Nylon was added on the mold to isolate the vacuum breather and bag sheets from the composite. The vacuum pump, throttle valve, and control valve were connected to the bag. The mold was kept in a closed autoclave with 66 o C for 2 hours and then it was left for more 6 hours in the room tempera-ture for complete curing before removing the samples. End taps of bidirectional glass reinforced epoxy were attached to the both sides of the tensile specimen. The tabs were fixed using a very thin layer of high structural epoxy adhesive and kept under the pressure of a mechanical fixture for 4 hours. Finally the samples were finished using a 120 sand paper, and cleaned using a cloth and al-cohol.
3. MODELING
randomly created to fill the space of the part being modeled randomly and homogenously. The ma-trix is modeled as a 3D elements having the volume of the part. An embedded region interaction constraint is defined between the fibers and the matrix geometries. The fibers are the embedded region and the matrix is the hosting element.
Figure 3: (a) Matrix model (b) Carbon Fibers (c) Glass Fibers, and a close view to the fibers in the FEA model.
3.1 Random Discontinuous 3D Fibers Distribution Algorithm
An algorithm is designed to create a set of short fibers in random orientations, and homogenous distribution. This algorithm can create 3D vectors having starting and ending points. It can control the average fibers length, specific or random orientation, spatial volumetric shape, and fibers vol-ume percentage to the desired values. It can also be used with two or more fibers types. The output of the algorithm is a txt file having each vector in a single line as 6 values (X1 Y1 Z1 X2 Y2 Z2). Each vector represents a fiber in a three dimension orientation within the part X, Y, and Z limits.
3.2 Tensile Specimen Finite Element Analysis Model
The carbon and glass fibers were modeled as 3D truss elements with the quantity, length, and di-ameter that achieves the iteration pardi-ameters shown in tables 1 and 2. The matrix was simulated with 3D stress elements, and 1 mm hexagonal mesh type. The summation of the fibers and matrix volume equals the total volume of the part being simulated. The inserted materials properties of the used carbon fibers and epoxy are summarized in the table 3. The Hashin damage property of the fibers properties were also included with 70% from the ultimate tensile strength of each. Figure 4 shows that the model is divided into three regions. The 2 edges where the tabbing elements are connected to the gripper of the tensile tester. The middle part is the gauge length with 160 mm. The model is totally fixed from the left part and subjected to external displacement in the elonga-tion direcelonga-tion of the specimen from 0 to 2 mm with a step of 0.05 mm/static step. The model calcu-lates the internal reactions and stresses within the specimen and plots them with respect to the displacement, then the young’s modulus can be calculates. The tensile strength can be found when the local stresses in the fibers exceeds their ultimate strength, or when the matrix stresses exceeds the interfacial bonding strength between the fibers and matrix
Carbon Fibers
Torayca T300
Glass Fibers Roblon E glass
Epoxy
Epolam 2017
Tensile Strength 3530 2000 78 MPa
Tensile Modulus 230 75 3.6 GPa
Maximum Strain 0.015 0.02 ---
Density 1.76 2.5 1.13 g/cm3
Table 3: Mechanical Properties of the used Carbon fibers, and Glass Fibers (Axson, 2005)(Roblon, 2012) (Toryaca, 2016).
Figure 4: FEA Tensile Test Loading and boundary conditions.
3.3 Rigid Power Transmission Coupling Finite Element Analysis Model
Figure 5: Studied Rigid Power Transmission Coupling Design.
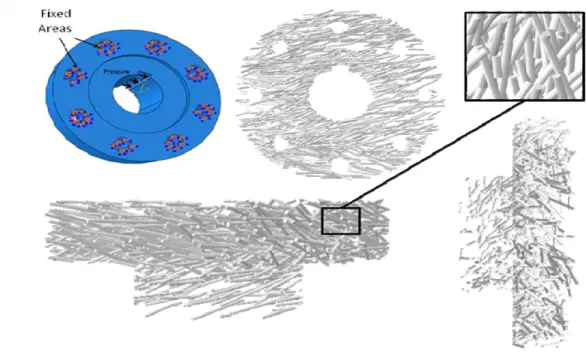
The new technique of simulation will be performed using an algorithm that will create 3D ran-dom distributed fibers that fills the volume of the designed coupling as shown in figure 6. The algo-rithm sticks the average fibers length to 20 mm, and the number of fibers to meet the volume frac-tion to 20% from the total volume of the coupling. The algorithm goals are to achieve random ori-entations with homogenous distribution that is similar to what can be got from molding such a shape. The fibers were uniformly distributed in all the parts of the coupling since the algorithm creates random uniform distribution values for the starting points of the fibers vectors. The algo-rithm also uses a uniform random orientation angles with the x, y, and z directions.
One part of the coupling is simulated using two assembled parts: The first is the matrix that has the complete volume of the coupling part, and the second is the fibers that are embedded with-in the matrix. The embedded region with-interaction is defwith-ined with-in Abaqus to remove the with-intersection volume of the fibers with the matrix from the matrix volume, and create the interaction between them with the bonding strength values. These values are calculated based on the fibers and matrix properties according to the failure criteria discussed in the mechanics of composites book (Tamuzs, 2015) and by Carozzi (2015). The coupling are fixed at the effective area around the bolts holes on the friction sides of the coupling and the load is defined as a pressure on the keyway face as shown in figure 6.
Figure 6 also shows the uniform random distribution of the fibers within the coupling volume. The algorithm enables us to control the fibers distribution in different areas. In the slender areas, the fibers average length is lower than other areas. This reflects the difficulty of reaching all the fibers to the slender and far areas in the manufacturing process.
4 RESULTS
In this section the results of the experimental testing and the finite element model of the tensile specimen are reported and discussed. A micromechanical model correction to the rule of mixture is introduced to predict the tensile strength and young’s modulus of the composite. Finally, the results of the coupling simulation are reported.
4.1. Tensile Testing Results and Analysis
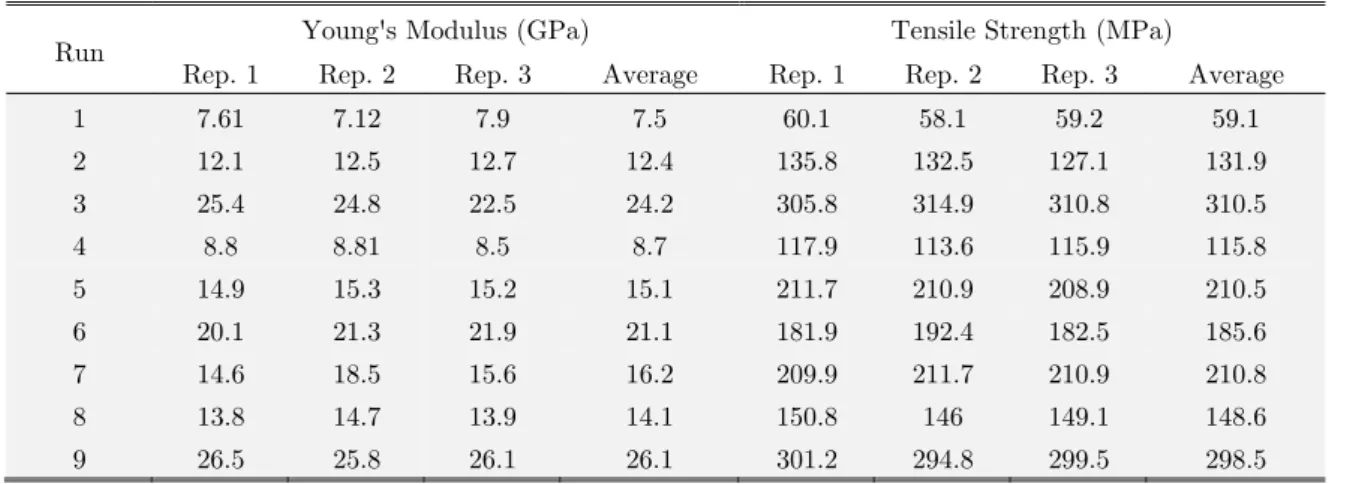
The results of the tensile testing of the 9 different runs with their three replications are listed in table 4.
Run Young's Modulus (GPa) Tensile Strength (MPa)
Rep. 1 Rep. 2 Rep. 3 Average Rep. 1 Rep. 2 Rep. 3 Average
1 7.61 7.12 7.9 7.5 60.1 58.1 59.2 59.1
2 12.1 12.5 12.7 12.4 135.8 132.5 127.1 131.9
3 25.4 24.8 22.5 24.2 305.8 314.9 310.8 310.5
4 8.8 8.81 8.5 8.7 117.9 113.6 115.9 115.8
5 14.9 15.3 15.2 15.1 211.7 210.9 208.9 210.5
6 20.1 21.3 21.9 21.1 181.9 192.4 182.5 185.6
7 14.6 18.5 15.6 16.2 209.9 211.7 210.9 210.8
8 13.8 14.7 13.9 14.1 150.8 146 149.1 148.6
9 26.5 25.8 26.1 26.1 301.2 294.8 299.5 298.5
Table 4: Tensile Testing results of the 9 runs/ 3 replications.
confidence levels by comparing them with the corresponding standards F-test values. Table 5 shows the process of the design of experiments where the statistical sums, variance, and F-test values.
Variable
Statistical Sum
Degree of Freedom
Variance F-Test Elastic
Modulus
Tensile Strength
Elastic Modulus
Tensile Strength
Elastic Modulus
Tensile Strength
Glass Fibers wt% 31.6 5098.3 2 15.79 2549.17 25.42 12.07
Carbon Fibers wt% 277.1 30051.1 2 138.54 15025.6 223.05 71.14
Average Fibers
Length 28.1 19156.4 2 14.05 9578.22 22.63 45.35
Error 1.2 422.4 2 0.62 211.21 -- --
Total 338 54728.4 8 -- -- -- --
Table 5: Testing Results Design of Experiments Parameters Study and significance Test (F-Test).
Variable 90% Confidence Level 95% Confidence Level
Elastic Modulus Tensile Strength Elastic Modulus Tensile Strength
Glass Fibers Wt% Yes Yes Yes No
Carbon Fibers Wt% Yes Yes Yes Yes
Average Fibers Length Yes Yes No Yes
Table 6: Significance (F-Test) Results on the studied parameters with 90% & 95% Confidence levels.
4.2 Finite Element Analysis of the Tensile Specimen Results
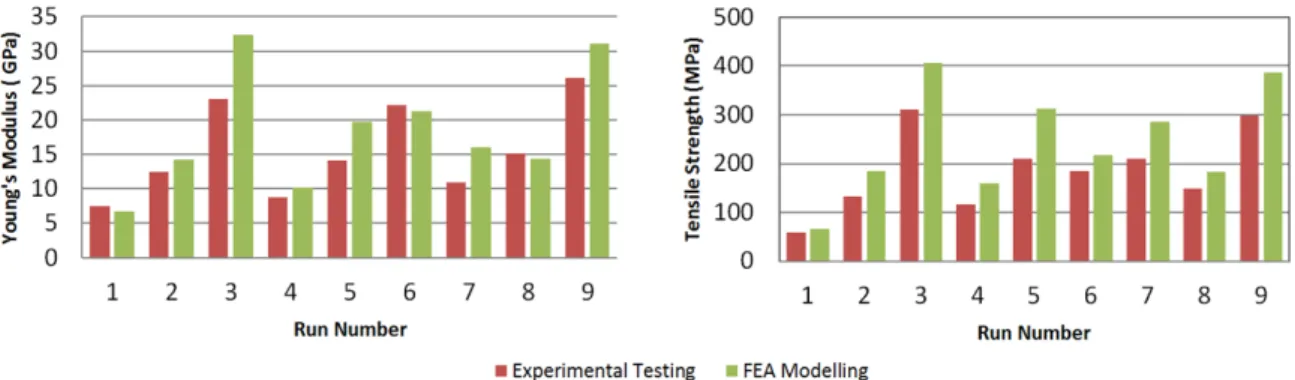
In this section the new finite element analysis method presented in the previous section will be used on the 9 runs of the design of experiments suggested in the second section. The young’s modulus and tensile strength will be calculated. Table 7 shows a comparison between the experimental and the FEA model tensile strength and modulus results. The young’s modulus got from the model is 19% higher than the experimental results. The model tensile strength is 2% higher than the experi-mental results.
Run Young's Modulus ( GPa) Tensile Strength ( MPa)
Experimental FEA Model Experimental FEA Model
1 7.5 6.7 59.1 66.5
2 12.4 14.3 131.9 185
3 24.2 32.4 310.5 405.6
4 8.7 10.2 115.8 158.9
5 15.1 19.8 210.5 312
6 21.1 21.3 185.6 217
7 16.2 16 210.8 285.6
8 14.1 14.4 148.6 183
9 26.1 31.1 298.5 385.6
Figure 7: Comparison between the results of the tensile specimen experimental testing and FEA model.
The FEA model gives higher strength and young’s modulus as it neglects the presence of air voids, and it assumes also unique fibers length without processing breakage problems. The ratio between the model and experimental results depends on the manufacturing technique and average fibers length. There is also a remarkable difference between the FEA model and the experimental results at runs 3, 5, and 7. These three runs average fibers length is the highest levels with 50 mm. This means that the increase of the fibers length deviate the results of the suggested model from the experimental results,
The following table shows the process of the design of experiments where the statistical sums, variance, and F-test values.
FEA Model Validation with the Experimental Results
Here we will model tensile strength and young’s modulus as a function of its constituent’s prop-erties and weight percentages as follows:
)
1
(
G CM ME C C CE G G
GE
E
W
K
E
W
K
E
W
W
K
E
(1))
1
(
G CM MS C C CS G G
GS
W
K
W
K
W
W
K
(2)Where:
E, EG, EC, EM : Composite, glass fibers, carbon fibers, and matrix moduli of elasticity
σ, σG, σC , σM : Composite, glass Fibers, carbon fibers, and matrix moduli of elasticity
KGE , KCE , KME : Glass Fibers, Carbon Fibers, and matrix modulus of Elasticity factor KGS ,KCS ,KMS : Glass, Carbon, and matrix Tensile strength factor
WC, WG : Carbon fibers and glass fibers weight percentages
The effect of the average fibers length and the processing factors will be included into the equa-tion as follows:
)
1
(
(
GE G G CE C C ME M G Ca LE
SE
K
L
K
E
W
K
E
W
K
E
W
W
K
E
(3))
1
(
(
GS G G CS C C MS M G Cb LS
SS
K
L
K
W
K
W
K
W
W
K
Where:
KSE and KSS are the model correction numbers, KLE, and KLSare the average fibers length factors,
a,b are the average fiber length exponent.
The 9 runs of the FEA model are used to get the KGE ,KCE , KME , KGS ,KCS ,KMS, KLE, and
KLS ,a, and b. The experimental results were also used to calculate the FEA model correction
num-bers: KSE and KSS. The model correction numbers are mainly depended on the manufacturing
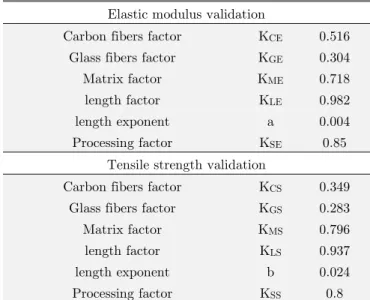
pro-cess, so the will vary if the composite is manufactured through the injection or compression molding techniques. Injection and compression molding will create a preferred direction for the fibers in the injection direction and on the outer surface. The factors values were calculated by comparing the experimental results with the model outputs and they are listed below in table 8.
Elastic modulus validation
Carbon fibers factor KCE 0.516
Glass fibers factor KGE 0.304
Matrix factor KME 0.718
length factor KLE 0.982
length exponent a 0.004
Processing factor KSE 0.85
Tensile strength validation
Carbon fibers factor KCS 0.349
Glass fibers factor KGS 0.283
Matrix factor KMS 0.796
length factor KLS 0.937
length exponent b 0.024
Processing factor KSS 0.8
Table 8: Parameters and constants values used in the modified rule of mixture.
4.3. Power Transmission Coupling FEA Modeling Results
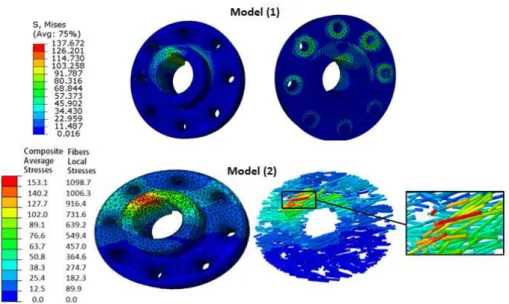
The coupling model was loaded with two different models: Model (1) where the material was de-fined as an isotropic material having the properties calculated from equations of the previous sec-tion; Model (2) where the coupling was modeled as a composite material of fibers as 3D truss ele-ments within the matrix 3D stress eleele-ments. The results of the two models at 100 N.m torque are shown below in figure 8.
Figure 8: Mises Stresses distribution loaded with 100 N.m Torque, for Model (1) at the top, and Model (2) at the bottom of the figure.
Torque (N.m) Mises Stresses (Mpa) Deflection (mm)
Composite Model Fibers Local Stress Isotropic Model Composite Model Isotropic Model
20 32.5 192.3 27.5 0.012 0.009
40 64.3 395.5 54.9 0.025 0.017
60 95.7 618 82.4 0.037 0.026
80 126.6 857 109.9 0.049 0.035
100 153 1098.7 137.3 0.062 0.044
120 180.9 1318.4 164.8 0.074 0.052
140 211.1 1615 192.3 0.086 0.061
160 240.5 1845.8 219.7 0.099 0.07 180 269.8 2101.2 247.2 0.111 0.079 200 299.8 2334.7 274.7 0.123 0.087
Table 9: FEA Model (1) and (2) Results of the power transmission Coupling.
5. CONCLUSION
Short fibers reinforced composite materials can be modeled where the random fibers are simulated as three dimensional random distributed truss elements embedded in a 3D solid homogenous ma-trix. The model is generalized for thermoplastics and thermosets. The model can be applied on the tensile test specimen to estimate the tensile strength and modulus of the composite material. The model can also be applied on rigid power transmission coupling design to estimate the maximum average stresses on the composite and maximum local stresses on the fibers. The results from the models were validated using tensile testing according to the taguchi L9OA design. A modification to the rule of mixture has been introduced with 1.1% mean square error from the experimental results. The suggested modified rule of mixture includes the constituent’s properties, percentages, average fibers lengths, modeling, and processing parameters. Hybrid glass – carbon fibers reinforced compo-sites can be used in power transmission coupling, and maximum permissible torque and speed can be predicted with 5% uncertainty using the suggested approach of modeling. The proposed FEA model can be used to:
1.Reduce the number of experiments performed in finding accurate composite properties. 2.Optimize the fibers type, length, orientation, and concentration on any 3D bulky shape. 3.Predict the failure of any bulky 3D design due to local and interfacial stresses within the
composite.
Randomness and homogeneity of fibers distribution could be controlled using the uniform ran-dom distribution algorithm. This could reflect the real distribution predicted from the manufactur-ing nature. More work is needed in order to predict the effect of the processmanufactur-ing technique on the fibers distribution and homogeneity.
References
Akira I., K. M. (2015). Effect of screw design on fiber breakage and dispersion in injection-molded long glass-fiber-reinforced polypropylene. Journal of Composite Materials, 75-84.
Carozzi, F. G. (2015). Mechanical properties and debonding strength of Fabric Reinforced Cementitious Matrix (FRCM) systems for masonry strengthening, Composites Part B : Engineering, 215–230.
D3039, A. ,2014. ASTM D3039 / D3039M-14, Standard Test Method for Tensile Properties of Polymer Matrix Com-posite Materials, ASTM International, West Conshohocken, PA, 2014.
Don Robbins, A. M., (2015). Progressive failure simulation of as-manufactured short fiber filled injection molded parts: validation for complex geometries and combined load conditions. Autodesk, Inc Society of Plastics, Automo-tive Composite Conference.
Doug Kenik, D. R., (2015). Bridging the gap: as-manufactured structural simulation of injection molded plastics. Spacce conference automotive division. Laramie wy, usa: Autodesk Inc.
Graupner, N., Albrecht, K., Ziegmann, G., Enzler, H., Müssig, J., (2016). Influence of reprocessing on fibre length distribution, tensile strength and impact strength of injection moulded cellulose fibre-reinforced polylactide (PLA) composites. Express Polymer Letters . 2016, Vol. 10 Issue 8.
Herrera-Franco, A. V.-G. (2005). A study of the mechanical properties of short natural-fiber. Composite part B engineering, 597-608.
Jin, BoCheng. (2011) 3-D Numerical simulation and analysis of complex fiber geometry RaFC materials with high volume fraction and high aspect ratio based on ABAQUS PYTHON. New Jersey, USA: the state university of New Jersey, Mechanical and Aerospace Engineering.
Lu, Y., (2002) Mechanical properties of random discontinuous fiber composites manufactured from wetlay process. Blacksburg, Virginia: Faculty of the Virginia Polytechnic Institute and State University.
Mitchell A. Daniels, L. J. (2015). Effects of Finite Element Damage Modeling Parameters in Carbon Fiber Panels Under Mode III Loading. ASME 2015 International Mechanical Engineering Congress and Exposition (pp. ISBN: 978-0-7918-5752-6). Houston, Texas, USA, November 13–19, 2015: ASME.
Rexnord. (2016). Addax composite couplings. Retrieved from Rexnord Cooperation: http://www.rexnord.com/ContentItems/TechLibrary/Documents/2022_Addax-Composite-Couplings_Catalog-pdf Rivin, E. I. (2008). Selection and Performance Criteria for Power Transmission Couplings. Retrieved May 8, 2015, from Power Transmission Engineering: www.powertransmission.com
Satheesh Kumar, P., Srikari, S., Mahesh, N. S., Reddy, S., (2010). Structural analysis of fiber- filled plastics. Sastech journal, 9(2).
Seyyedvahid Mortazavian, A. F. (2014). Effects of Fiber Orientation and Anisotropy on Tensile Strength and Elastic Modulus of Short Fiber Reinforced Polymer Composites. Composites part B engineering, 116-129.
Tamuzs, V. P. (2015). Mechanics of Composite Materials. 1(6).
Axson, (2005), Epolam 2017 system, Retrieved on May 8 , 2015, from Axson technologies :http://www.axson-technologies.com/en/Find-product.
Roblon. (2012). Roblon Products. Retrieved May 8, 2015, from Roblon: http://www.roblon.com/en/business_system/