www.scielo.br/rbg
DEVELOPMENT OF AIRGLOW OH TEMPERATURE IMAGER FOR MESOSPHERIC STUDY
Jos´e Valentin Bageston
1, Delano Gobbi
2, Hisao Takahashi
3and Cristiano Max Wrasse
4Recebido em 23 fevereiro, 2006 / Aceito em 20 junho, 2006 Received on February 23, 2006 / Accepted on June 20, 2006
ABSTRACT.In this work we present a methodology to calculate the temperature in the upper mesosphere using a spectral OH (6-2) airglow temperature imager. The temperature imager system consists of a CCD camera and an optical head (including an interferometer filter, Fresnel lens and objective lens) which was developed by Airglow group of INPE in S˜ao Jos´e dos Campos, Brazil. The instrument calibration was performed at National Institute of Polar Research, Japan, using a 2 m diameter integrating sphere. The airglow test observations were carried out at Cachoeira Paulista Observatory (22.7◦S), Brazil, from March to May 2005, and the results
were compared to that obtained by a tilting-filter zenith photometer (MC2) at the same place. Some results are presented and compared with MSISE-90 atmospheric temperature model, which showed a good agreement in the nocturnal mean values, while exhibiting a different nocturnal variability.
Keywords: mesospheric study, rotational temperature, imager system, methodology.
RESUMO.Neste trabalho ser´a apresentada uma metodologia para calcular a temperatura na alta mesosfera usando a emiss˜ao da luminescˆencia atmosf´erica do OH (6-2). O sistema imageador de temperatura consiste de uma cˆamera CCD e um sistema ´optico (incluindo um filtro de interferˆencia, uma lente Fresnel e a objetiva), instrumento este que foi desenvolvido pelo grupo de Luminescˆencia Atmosf´erica do INPE em S˜ao Jos´e dos Campos, Brasil. A calibrac¸˜ao do instrumento foi realizada no Instituto Nacional de Pesquisa Polar, Jap˜ao, usando uma esfera integradora de 2 m de diˆametro. As primeiras observac¸˜oes de temperatura e intensidade do OH (6-2) foram feitas no Observat´orio de Cachoeira Paulista (22.7◦S), Brasil, de Marc¸o a Maio de 2005, e os resultados foram comparados com os obtidos por um fotˆometro
zenital de filtro inclinado (MC2) que operou no mesmo local. Alguns resultados s˜ao apresentados e comparados com o modelo atmosf´erico de temperatura, MSISE-90, mostrando uma boa concordˆancia com os valores m´edios noturnos, por´em diferindo com relac¸˜ao `a variabilidade noturna.
Palavras-chave: estudos mesosf´ericos, temperatura rotacional, espectro-imageador, metodologia.
National Institute for Space Research, Av. dos Astronautas, 1.758, Jardim da Granja, P.O. Box 515 – 12227-010 S˜ao Jos´e dos Campos, SP, Brazil.
Phone: +55 (12) 3945-7167; Fax: +55 (12) 3945-6990 – E-mails: [email protected]; [email protected]; [email protected]
INTRODUCTION
Measurement of the upper mesospheric temperature is very im-portant to study the global climatic changes (Roble & Dickison, 1989; Rind et al., 1990; Golitsyn et al., 1996). It also permits us to understand the atmospheric dynamics and energy balance in the upper atmosphere (Takahashi et al., 2003).
The airglow Hydroxyl emission band arises from vibration-rotation transitions, within the same electronic state2Q. The
OH spectral range is broad, ranging from 520 nm to 2.7μm. The widely accepted excited OH production mechanism is given by the following equation (Bates & Nicolet, 1950):
H+O3
α1
−−−−−→ O H∗(ν′≤9)+O2+3.32eV. (1)
The exothermic process is sufficient to excite the OH up to a vibrational level ofν′≤9.
The OH vibration-rotation line intensities can be expressed as follows:
I i′,J′, ν′→i′,J′′, ν′′
=NνAν i′,J′, ν′→i′,J′′, ν′′ 2 2J
′+1
Qν′
×exp
−G Fi(J ′, ν)
kTr
(2)
where the prime index represents the upper energy state and dou-ble prime index represents the lower energy level, i represents the electronic state,Jthe rotational state andνthe vibration state. TheNνnumber is the molecules population at upper energy state,
Aνis the Einstein coefficient of the vibration-rotational transition,
Qνis the partition function, the term(2′+1)represents the
de-generescence of the stateJ′,G Fiis the total energy of the upper state,kis the Boltzmann constant, andTr is the rotational tem-perature.
The rotational temperature is derived from the relative pho-ton emission rates of various rotational lines, by constructing a synthetic spectrum that best fit the observations. The obtained rotational temperature is interpreted as kinetic temperature under the hypothesis that the OH′molecules are in thermal equilibrium
with the atmosphere.
Several authors have measured the rotational temperature from the airglow OH spectra using photomultiplier tube as pho-ton detector (e.g. Takahashi et al. (1999); Buriti et al. (2000); French et al. (2000); Wrasse et al. (2004); Phillips et al. (2004)). The rotational temperature has also been measure using CCD de-tectors; Wiens et al. (1991) were the first to measure the tempe-rature in the mesosphere using the Mesopause Oxygen
Rotatio-nal Temperature Imager (MORTI), for the O2(0-1) airglow
emissi-ons. Later on, this instrument was complete re-design to a Spec-tral Airglow Temperature Imager (SATI), in order to make it more flexible for ground-based networks (Wiens et al., 1997). Recen-tly, Taylor et al. (1999) developed the Mesospheric Temperature Mapper (MTM) to provide enhanced imaging capabilities for up-per atmospheric research. The MTM has been used to investigate the induced temperature perturbations (amplitude and phase) and the signature of long-period,∼8-hr, wave-like oscillations in the OH (6-2) band emission and in the rotational temperature at mid-latitudes (Taylor et al., 2001; Pendleton et al., 2000).
In this paper we will present the new imaging spectrometer constructed at INPE, which was designed to observe the OH (6-2) rotational temperature at Brazilian Antarctic Station at King George Island (62◦S, 58◦W). The methodology developed to calculate the
rotational temperature, including the calibration process and the first results obtained at Cachoeira Paulista Airglow Observatory (23◦S, 45◦W) will be present.
INSTRUMENTATION
The Spectrometer Imager – FotAntar-3 was designed to obtain the OH (6-2) rotational temperature and band intensity. It is an imager system that uses a cooled-CCD detector to measure the airglow lines as concentric interference fringes. The instrument uses a narrow-band interference filter, which works as a Fabry-Perot eta-lon, which basic concept is in Eq. (3) (James & Sternberg, 1969),
2dcos(θ )=mλ , (3)
wherem = 1,2,3, . . .(integer),dis a distance between two plate of the Fabry-Perot andθis the incident light angle, which characterizes the spectral response of the filter.
The instrument is composed by two parts: an optical part with a Fresnel lens that together with objectives lens and a field stop sets up an annular field of view of 22.6◦, an interference filter, and
a detector part that uses a cooled-CCD. FotAntar-3 is configu-red to measure a 8380 ˚A–8480 ˚A wavelength range, which corres-ponds to the P-branch of OH (6-2) band. The P-branch spectrum is shown in Table 1. Optical diagram and ray-tracing of FotAntar-3 spectrometer is shown in Figure 1, where we can identify the field of view, the optical (lens and interference filter) and detector part (CCD).
Step motor
Field stop
L2
L1
CCD KAF ST1001E Objetive lens Interference filtrer
Fresnel lens External shutter 22.6o
Figure 1– Optical diagram of the imaging spectrometer FotAntar-3.
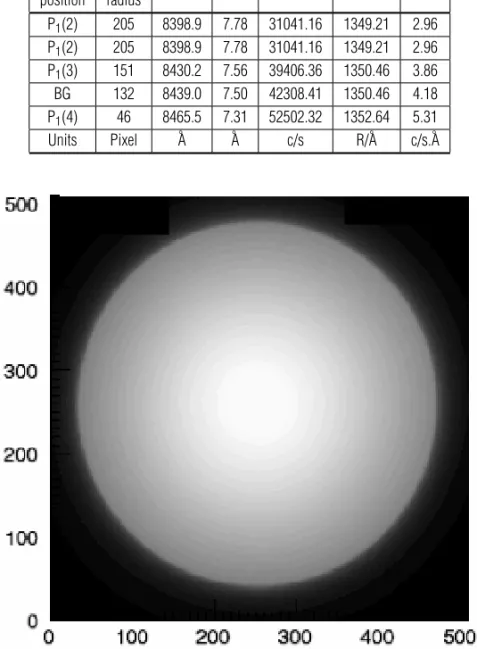
surface with a known spectral radiance. Figure 2 shows an exam-ple of spectral image obtained with the integrating sphere, which was used to calculate the instrumental sensitivity at each wave-length or radius of the image. The results of sensitivity calibration are summarized on the last column of the Table 1.
The spectral calibration (filter transmittance) was made using a dataset of thirty four images obtained from a monochromator. With the information of the sensitivity and the filter transmittance it is possible to calculate the absolute sensitivity. The instrumental errors are originated from the filter transmittance and the radiance of the light in the integrating sphere. The systematic error in the absolute sensitivity was less than 2%.
Table 1 shows the main rotational lines of the OH (6-2) as well the spectral position utilized to estimate the background of the sky (continuum spectral). It is also showed the radial positions (pixel) corresponding to each spectral position. Table 1 also shows the filter transmittance(1λ), the integrating count (Jint), the radiance
(Bint) and sensitivity (S) in the corresponding spectral positions.
FotAntar-3 operated simultaneously with a zenith tilting-filter photometer, MC2, (Melo et al., 1993) at Cachoeira Paulista
(22.7◦S, 45.0◦O), in order to compare the rotational temperature
and OH (6-2) band intensity.
The MC2 photometer uses a photomultiplier as the photon detector. It uses a tilting filter technique with 5 different filters for OI 5577, OI 6300, Na D1,2, OH (6-2) and O2(0-1). Each filter
an-gle corresponds to a different spectral position. On the other hand FotAntar-3 uses only one filter to measure the OH (6-2) airglow band, which observes simultaneously 5 emission lines. One of the main advantages of using the FotAntar-3 is that all interested spectral lines and background of the sky are imaged on a same area simultaneously.
METHODOLOGY
In order to calculate the rotational temperature, it is necessary to know the instrumental response and corresponding synthetic spectrum. The information about calibration process is shown in Table 1.
Table 1– Instrumental parameters obtained from the FotAntar-3 calibration.
Spectral Image
λ 1λ Jint Bint(λ) S
position radius
P1(2) 205 8398.9 7.78 31041.16 1349.21 2.96 P1(2) 205 8398.9 7.78 31041.16 1349.21 2.96 P1(3) 151 8430.2 7.56 39406.36 1350.46 3.86 BG 132 8439.0 7.50 42308.41 1350.46 4.18 P1(4) 46 8465.5 7.31 52502.32 1352.64 5.31 Units Pixel ˚A ˚A c/s R/˚A c/s.˚A
Figure 2– Example of spectral image obtained by imaging spectrometer FotAntar-3 looking to the integrating sphere.
method of the ratio between two spectral lines to obtain the rota-tional temperature. We chose the spectral lines P1(2), P1(3) and
P1(4) (Fig. 3(A)). The P1(3) line at 8430 ˚A was not used because
there are P1(12) and P2(12) lines of the OH (5,1) band and it is
difficult to estimate the contamination of these lines (Shiokawa et al., 2004). Therefore we used the intensity ratio between P1(4) and
P1(2) lines to calculate the rotational temperature.
Figure 3 (A) shows an example of the OH (6-2) spectrum me-asured by FotAntar-3 and the correspondent integrated spectrum in the Figure 3 (B). The rotational lines used to calculate the ro-tational temperature and the spectral background (BG) region are identified in the Figure 3 (A) and the correspondent wavelength is seen in the Figure 3 (B). In this work the BG intensity subtraction
was made directly from the integrating spectrum and the final OH (6-2) integrating spectrum (without background) is showed in the Figure 3 (B).
The image integration process was made to obtain more ac-curate information and to get a better signal to noise ratio. For each interference fringe in Figure 3 (A) it is associated an integra-ting curve in the Figure 3 (B). Note that the wavelength is inversely proportional to images radius.
Figure 3– (A) OH (6-2) airglow image spectrum taken by FotAntar-3. The heavy black lines on the image are to emphasize the background (BG) region. (B) Integrated profile of the image. The rotational lines and background measurement position are shown.
M a r, 1 1 M a r, 1 2 M a r, 1 3 A p r, 8 A p r, 9 A p r, 1 0 A p r, 1 1 A p r, 1 2 A p r, 1 3 A p r, 1 4 M a y , 2 M a y , 0 3 M a y , 0 4 1 2 3 4 5 6 7 8 9 1 0 1 1 1 2 1 3 O b s e rv e d h o u rs
Observation at Cachoeira Paulista (23°S, 45°W), during 2005
FOTANTAR3 MULTI2
Figure 4– Simultaneous observation set at Cachoeira Paulista (23◦S, 45◦W) with the FotAntar-3 and MC2 photometer during 2005.
RESULTS AND DISCUSSION
The first OH (6-2) observation has been carried out at Cachoei-ra Paulista (23◦S, 45◦W) from February to May, 2005. Figure 4
shows a histogram of the data collected with FotAntar-3 imaging
Figure 5– Nocturnal variations of the OH (6-2) rotational temperatures and band emission rates observed at Cachoeira Paulista on April 11th, 2005. The rotational temperatures are also compared with the MSISE-90 temperature model and with the MC2 photometer. The local time is expressed in decimal mode from 18 to 30 (6 P.M. to 6 A.M. in the next day).
Figure 5 shows the nocturnal OH (6-2) band intensity and rotational temperature variations on the night of 11 April, 2005 observed at Cachoeira Paulista by FotAntar-3 and MC2 photo-meter. The temperature measured by FotAntar-3 varied between 170 K and 200 K during the night, showing a minimum at around 23 Local Time (LT) and OH (6-2) band intensity showed a varia-tion with the minimum at around the midnight. MC2 photometer showed a similar nocturnal variations in the OH (6-2) tempera-ture and intensity, but with a systematic differences. The rotatio-nal temperatures measured by FotAntar-3 were compared to the MSISE-90 model temperatures and has shown a good agreement in the absolute temperature values, with differences no larger than 10 K. Figure 6 shows another example on the night of 14 April, 2005.
A good agreement associated to nocturnal variation of the temperature and OH (6-2) intensity was seen between FotAntar-3 and MC2, but the temperature measured by FotAntar-FotAntar-3 is lower than MC2. The nocturnal variation seen in the OH (6-2) rotational temperatures are not in agreement with the MSISE-90 model, but the absolute temperatures calculated with spectrum obtained by FotAntar-3 are closest to MSISE-90 than those obtained by MC2.
The nocturnal variation in the rotational temperature and OH (6-2) band intensity could be due to tidal waves and/or gravity wa-ves that pass through the airglow layer, but the analysis of these waves will be discussed in a future work. The low background le-vel shows that no cloud appears during the nocturnal observation period.
The results obtained for the other eleven nights showed a similar behavior to those presented in the Figs. 5 and 6. The dif-ference in the mean nocturnal temperature measured by FotAntar-3 and MC2 photometer varies between 29 and 45 K, showing the same nocturnal variations in the temperature and OH (6-2) intensity.
The systematic difference in the observed temperature between the FotAntar-3 and MC2 should be investigated. One reason would be in the calibration process, which was made in different laboratories and with different equipments. It would be necessary to accept an error range of 18% in the sensitivity in or-der to get a same temperature range between FotAntar-3 and MC2. However this is out of the present error range. Further investiga-tion would be necessary. Except the uncertain factor, FotAntar-3 showed a good performance, steady in operation without malfunc-tion during the test operamalfunc-tion at Cachoeira Paulista. After the test phase it was installed in the Brazilian Antarctic Station on May 2005.
CONCLUSIONS
An imaging spectrometer, FotAntar-3, for measurement of the OH (6-2) rotational temperature, was designed and constructed at INPE. The instrumental calibration was carried out at National Ins-titute of Polar Research, Japan. An algorithm was developed in order to calculate the rotational temperature and OH (6-2) band intensity from the spectral image.
The observed rotational temperature was compared with that of MSISE-90 model and MC2 tilting-filter photometer at Cachoei-ra Paulista. The comparison between FotAntar-3 and MSISE-90 showed a good agreement in absolute temperatures values. However, the comparison between FotAntar-3 and MC2 has shown a systematic difference, 10-30 K, which should be further investigated. FotAntar-3 is now in operation at Brazilian Antarc-tic Station (62◦S, 58◦W) since June, 2005 and these data will be
presented in a future work.
ACKNOWLEDGMENTS
The authors thank to K. Shiokawa of the National Institute of Po-lar Research – NIPR for provided the instruments to calibration data and M. Tsutsumi and Taguchi for their help. We also thank too the technical team of Airglow group at S˜ao Jos´e dos Campos and Cachoeira Paulista. The present work has been supported by CNPq, under contract PROANTAR project No. 55.0355/02-02 and scholarship contract No. 133880/2003-6.
REFERENCES
BATES DR & NICOLET M. 1950. The photochemistry of the atmospheric water vapor. Journal of Geophysical Research, 55(3): 301–327.
BURITI RA, NAKAMURA T, TSUDA T, FUKAO S, TSUTSUMI M, TAKA-HASHI H & BATISTA PP. 2000. Mesopause temperature observed by airglow OH spectra and meteor echoes at Shigaraki (34.9◦N, 136.1◦E),
Japan. Advances in Space Research, 26(6): 1005–1008.
COXON JA & FOSTER SC. 1982. Rotational analysis of hydroxyl vibration-rotation emission bands: molecular constants for OH X2Q,
6≤ν≤10. Canadian Journal Physics, 60(41): 41–48.
FRENCH WJR, BURNS GB, FINLAYSON PA, GREET RP, LOWE RP & WILLIAMS PFB. 2000. Hydroxyl (6-2) airglow emission intensity ratios for rotational temperature determination. Annales Geophysicae, 18(10): 1293–1303.
GOLITSYN GS, SAMENOV AI, SHEFOV NN, FISHKOVA LM, LYSENKO EV & PEROV SP. 1996. Long-term temperature trends in the middle and upper atmosphere. Geophysical Research Letters, 23(14): 1741–1744.
HEDIN AE. 1991. Extension of the MSIS Thermosphere Model into the Middle and Lower Atmosphere. Journal of Geophysical Research-Space Physics, 96(A2): 1159–1172.
JAMES JF & STERNBERG RS. 1969. The design of optical spectrome-ters. Chapman and Hall, London, 240 p.
LANGHOFF SR, WERNER HJ & ROSMUS P. 1986. Theoretical transitions probabilities for the OH Meinel system. Journal of Molecular Spectros-copy, 188(2): 507–529.
MELO SML, GOBBI D, TAKAHASHI H, TEIXEIRA NR & LOBO R. 1993. O fotˆometro MULTI-2: Experiˆencia de Calibrac¸˜ao – 1992. Instituto Nacional de Pesquisas Espaciais (INPE), S˜ao Jos´e dos Campos/SP. 100 pp.
PHILLIPS F, BURNS GB, FRENCH WJR, WILLIAMS PFB, KLEKOCIUK AR & LOWE RP. 2004. Determining rotational temperatures from the OH (8-3) band, and a comparison with OH (6-2) rotational temperatures at Davis, Antarctica. Annales Geophysicae, 22(5):1549–1561.
PENDLETON WRJ, TAYLOR MJ & GARDNER LC. 2000. Terdiurnal oscil-lations in OH Meinel rotational temperatures for fall conditions at northern mid-latitudes sites. Geophysical Research Letters, 27(12): 1799–1802.
RIND D, SUOZZO R, BALACHANARAN NK & PRATHER MJ. 1990. Cli-mate changes and the middle atmosphere. Part 1: the doublet CO2 cli-mate. Journal of the Atmospheric Sciences, 47(4): 475–494.
ROBLE RG & DICKISON RE. 1989. How will changes in carbon dio-xide and methane modify the mean structure of the mesosphere and ther-mosphere? Geophysics Research Letters. 16(12): 1441–1444.
SHIOKAWA K, OTSUKA Y, OGAWA T, TAKAHASHI H, NAKAMURA T & SHIMOMAI T. 2004. Comparison of OH rotational temperatures
measu-red by the spectral airglow temperature imager (SATI) and by a tilting-filter photometer. Journal of Atmospheric and Solar-Terrestrial Physics, 66(11): 891–897.
TAYLOR MJ, PENDLETON WRJ, GARDNER CS & STATES RJ. 1999. Comparison of terdiurnal tidal oscillations in mesospheric OH rotatio-nal temperature and Na lidar temperature measurements at mid-latitudes for fall/spring conditions. Earth Planets and Space, 51(7-8): 877–885.
TAYLOR MJ, GARDNER LC & PENDLETON WRJ. 2001. Long-period wave signatures in mesospheric OH Meinel (6,2) band intensity and rotational temperature at mid-latitudes. Advances in Space Research, 27(6-7): 1171–1179.
TAKAHASHI H, BATISTA PP, BURITI RA, GOBBI D, NAKAMURA T, TSUDA T & FUKAO S. 1999. Response of the airglow OH emission, temperature and mesopause wind to the atmospheric wave propagation over Shiga-raki, Japan. Earth Planets Space, 51(7-8): 863–875.
TAKAHASHI H, TSUDA T, NAKAMURA T, ISODA F, SCHEER J & HOFFER-MANN D. 2003. The lowest mesopause temperature in 1996 and 1997 at 23◦S. Advances in Space Research, 32(9): 1781–1786.
WIENS RH, ZHANG SP, PETERSON RN & SHEPHERD GG. 1991. MORTI: A mesopause oxygen rotational temperature imager. Planetary and Space Science, 39(10): 1363–1375.
WIENS RH, MOISE A, BROWN S, SARGOYTCHEV S, PETERSON RN, SHEPHERD GG, L ´OPEZ-GONZ´ALEZ MJ, L ´OPEZ-MORENO, JJ & RODRIGO, R. 1997. SATI: A spectral airglow temperature imager. Ad-vances in Space Research, 19(4): 677–680.
WRASSE CM, TAKAHASHI H & Gobbi D. 2004. Comparison of the OH (8-3) and (6-2) band rotational temperature of the mesospheric airglow emissions. Revista Brasileira de Geof´ısica, 22(3): 223–231.
NOTES ABOUT THE AUTHORS
Jos´e Valentin Bageston.Physicist at Universidade Federal de Santa Maria (UFSM), 2003. Msc (Space Geophysics) at Instituto Nacional de Pesquisas Espaciais
(INPE), 2005. Areas of interest: Equatorial and Polar Optical Aeronomy.
Delano Gobbi.Bsc (Physicist) at Universidade Federal do Rio Grande do Sul (UFRGS), 1984. Msc (Space Geophysics) at Instituto Nacional de Pesquisas Espaciais
(INPE), 1988. PhD (Space Geophysics) at Instituto Nacional de Pesquisas Espaciais (INPE), 1993. Areas of interest: Equatorial and Polar Optical Aeronomy.
Hisao Takahashi.Bsc (Physicist) at Niigata University – Japan, 1968. Msc (Upper Atmosphere) at Niigata University – Japan, 1970. PhD (Space Science) at Instituto
Nacional de Pesquisas Espaciais, INPE, 1993. Areas of interest: Equatorial and Polar Optical Aeronomy.
Cristiano Max Wrasse.Physicist at Universidade Federal de Santa Maria (UFSM), 1997. Msc (Space Geophysics) at Instituto Nacional de Pesquisas Espaciais