Article
Voltammetric Oxidation of Dipyridamole in Aqueous Acid Solutions
Marilza Castilho, Luiz E. Almeida, Marcel Tabak and Luiz H. Mazo*
Instituto de Química de São Carlos, Universidade de São Paulo, CP 780, 13560-970, São Carlos - SP, Brazil
A oxidação eletroquímica do dipiridamol (DIP) foi estudada em soluções aquosas acidificadas, empregando-se as técnicas de voltametria cíclica e eletrólise a potencial controlado com eletrodos de platina. Os experimentos de eletrólise foram monitorados por voltametria cíclica com ultramicroeletrodo de platina, espectroscopia de absorção óptica e fluorescência, e a integração da corrente durante a eletrólise resultou em uma carga correspondente a 2 elétrons por molécula de DIP. Os voltamogramas cíclicos registrados para o DIP a baixas velocidades de varredura se caracterizam por um único pico de oxidação em processo controlado por difusão, com o aparecimento do pico de redução correspondente a velocidades de varredura maiores que 1 V s-1. A estequiometria
da reação de oxidação obtida a partir de curvas de polarização de estado estacionário resultou em ordens de reação unitária em relação ao DIP e íons H+.
The electrochemical oxidation of dipyridamole (DIP) has been studied in acidified aqueous solutions at platinum electrodes employing cyclic voltammetry and controlled-potential electrolysis. The progress of the anodic oxidation as a function of time was monitored by cyclic voltammetry with platinum ultramicroelectrodes, absorption and fluorescence optical spectroscopies, the resulting integrated charge being indicative of a two electron process. The cyclic voltammograms registered for low scan speeds are characterized by a single irreversible diffusion controlled anodic wave, the related cathodic wave being also observable for scan speeds higher than 1 V s-1. Oxidation reaction
stoichiommetric parameters were obtained through Tafel slopes resulting in unitary reaction orders for DIP and H+.
Keywords: dipyridamole, anodic oxidation, cyclic voltammetry, aqueous acid solution
Introduction
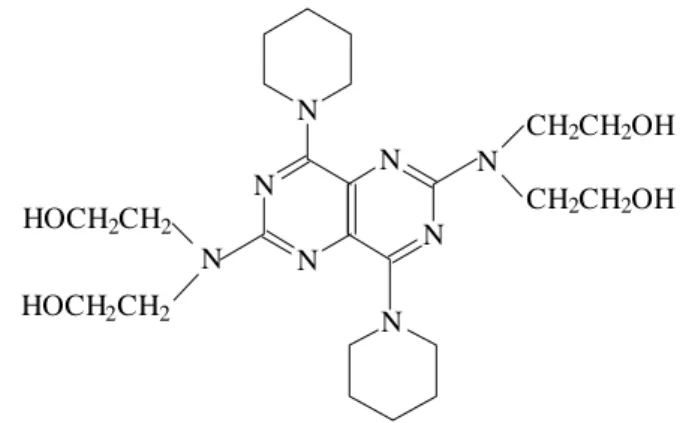
Dipyridamole (DIP), 2,6-bis(diethanolamino)-4,8-dipiperidino [5,4-d] pyrimidine, is a drug used for the treat-ment of cardiovascular diseases due to its vasodilating and antiplatelet properties 1. Its structure (Figure 1) presents a
stable hetero-aromatic double ring core which is respon-sible for the characteristic absorption and fluorescence of the compound. It has been recently reported that DIP also exhibits a potent biological antioxidant activity behaving as an inhibitor of lipid peroxidation initiated by iron (II) ions2 or by thermolabile azo compounds3, acting by the
classical chain breaking mechanism as observed for Vita-min E. In the opinion of the authors2,3 this mechanism
involves the transfer of a hydrogen atom to peroxyl radi-cals. However, Pedulli et. al.4 reported, mainly based in
calculated thermodynamic data for the hydrogen energy
bonds in the molecule, that the antioxidant action of DIP must result from the direct electron transfer reaction.
Presented at the XI Simpósio Brasileiro de Eletroquímica e Eletroana-lítica, Maragogi - AL, Brazil, April 5-9, 1999. Guest editor: Luis Alberto Avaca.
Figure 1. Structure of dipyridamole (DIP).
In previous work5 the electrochemical oxidation of DIP
in organic solvents acetonitrile and ethanol was studied by cyclic voltammetry with ultramicroelectrodes, electronic absorption, fluorescence emission, and ESR spectroscopies.
N
N
N N
N
N
N
N
CH2CH2OH
HOCH2CH2 CH2CH2OH
HOCH2CH2
Voltammograms at high and low scanning rates showed a similar behavior in these different solvents, being charac-terized by two almost reversible voltammetric waves, cor-responding to two consecutive one-electron losses. The electro-oxidation by only one electron produces a stable cationic radical which is easily detected by ESR5.
Although various methods have been employed for the analytical determination of DIP, including spectrophotom-etry6, high-performance liquid chromatography7 and
strip-ping voltammetry8,9, the study of the anodic oxidation
re-action of DIP in acid media can be useful to bring a better understanding over the compound chemical structure and nature, opening, eventually, new analytical possibilities.
The main objective of this work is to establish the proper stoichiometry for the anodic oxidation of DIP in aqueous acid solutions in which the compound can be somewhat extensively dissolved, and as an attempt to elucidate the mechanism of that reaction. The study was carried out in diluted acid solutions using cyclic voltammetry in combi-nation with controlled potential electrolysis and potential stepped polarization data to obtain Tafel curve that allows the determination of the reaction orders for DIP and H+.
Experimental
Chemicals
All reagents used in this work were of analytical grade from Aldrich (dipyridamole), or Merck (sulfuric acid, po-tassium sulfate and others). Water treated in a Milli-Q sys-tem (Millipore) was used to prepare the solutions. All chemicals were used without previous purification.
Cyclic voltammetry
Cyclic voltammograms were registered at conventional platinum disk electrode (φ=0,5 mm) and alternatively by using platinum disk ultramicroelectrodes (φ=25 µm), being recorded with a polarographic analyzer EG&G, PAR Model 174-A, coupled to a home made interface adapted to an IBM-PC that acts as a function generator using a twelve bits digital to analog converter and as a data acquisition system by means of a twelve bits analog to digital converter10. The
computer interface is controlled by a properly developed Windows® compatible program which allows the execu-tion of most convenexecu-tional electrochemistry techniques and provides the necessary facilities for data treatment.
A conventional electrochemical cell containing a plati-num wire counter electrode and an Ag/AgCl(sat) reference
electrode was employed for the conventional working elec-trode application and a two elecelec-trode cell was used in case of the ultramicroelectrode.
Solutions of DIP from 0.5 up to 5.0 x 10⁻³ mol L-1 and of
H2SO4 from 5 up to 100 x 10-3 mol L-1 at constant ionic
strength (µ = 0.3) adjusted by proper addition of K2SO4 were used. Dissolved oxygen was removed from the solu-tions prior to the measurements by bubbling nitrogen (SS grade) from White Martins S.A. for 5 min. Electrode surface was cleaned before use by polishing in a wet cloth embed-ded with alumina powder 0.05 mm diameter emulsion.
Stepped Polarization Curves
Steady state current data in the potentiostatic polariza-tion mode were taken by the applicapolariza-tion of a programmed potential staircase within the appropriate potential range for each experiment with a pre-programmed step duration of 3 seconds, the current being sampled at the end of each step.
Controlled potential electrolysis
Controlled potential electrolysis experiments were per-formed for DIP 0.5 x 10⁻³ mol L-1 containing 0.1 mol L-1
acetate buffer (pH=3.0) using a two compartment electroly-sis cell supplied with a 4.2 cm2 area platinum foil working
electrode and a larger auxiliary platinum electrode posi-tioned in the other cell compartment. The same reference electrode as described above was used in the electrolytic cell. The progress of the electrolysis was monitored every 15 minutes by cyclic voltammetric experiments with plati-num disk ultramicroelectrode, and by registering the opti-cal absorption and fluorescence emission spectra. The elec-trolysis potential was kept applied for 60 min until no more current flow was observed, a negligible residual cur-rent being registered in pre-electrolysis experiments. Op-tical absorption spectra were obtained in a HITACHI U-2000 spectrophotometer coupled to a IBM-PC with the Spectracalc software (Galactic). Fluorescence spectra were obtained in a JASCO FP-777 spectrofluorimeter using quartz cuvettes (Hellma) of 1mm optical path oriented at 45o with relation to the excitation beam. The sample was
excited at 415 nm and the emission spectra was recorded in the range 425-600 nm. All measurements were carried out at laboratory ambient temperature controlled at 25 ± 2 oC.
Results and Discussion
Voltammetric measurements with conventional and ultramicroelectrodes
As shown in Figure 2, at low scan speeds the voltammetric curves registered for DIP 1.0 x 10⁻³ mol L-1 in 0.10 mol L-1
became visible which is indicative of electrolysis product consumption by a slower homogeneous chemical reaction that follows the electron transfer step. The voltammetric pa-rameters measured over the range of scan speeds investigated are presented in Table 1, where the listed values for Ep–Ep/2 are that expected for a two electrode process. The slight in-crease observed for Ep–Ep/2 for high scan speeds is indica-tive of some quasi-irreversibility of the electrode reaction. Figure 3 presents the variation of Ipa as a function of v1/2
where it can be seen that there is a diffusion limited process for low scan speeds that became kinetically controlled in the region of higher scan speeds.
Cyclic voltammetric curves obtained with the platinum disk ultramicroelectrode are shown in Figure 5 A, while Figure 5 B presents a cyclic voltammogram for a 1.0 x 10⁻³
mol L-1 potassium ferricyanide solution registered in the
same conditions. The half-wave potentials for the ongoing voltammetries were calculated by the log-plot procedure being 0.598 V for DIP and 0.343 V for the ferricyanide vs. Ag/AgCl(sat) electrode, with the respective values of 44 and
62 mV/decade obtained from the Log-plot slopes. The pre-cise site of protonation of DIP is still unknown. The fluores-cence emission of DIP decreases sharply with the acidifica-tion of the medium showing a single pKa of 5.8 in aqueous
solution. In the case of a dipyridamole derivative, RA25, which has the same substituents in all positions of the pyrimido pyrimidine ring (methylamines at positions 2,6,4,8), two pKa values of 5.2 and 2.2 were observed in
fluorescence emission titration11. Comparison with pKa
values of simple similar compounds suggests that the unique pKa of 5.8 for DIP is due to protonation of the nitrogens of
Table 1. Electrochemical parameters obtained by voltammetric
oxidation of DIP 1.0 x 10⁻³ mol L-1 in H
2SO4 solution 0.1 mol L-1,
platinum electrode φ=0.5mm.
v Epa ipa Epc Ipa/v1/2 E
p – Ep/2
(Vs-1) (mV) (µA) (mV) (µA.mV-1/2s1/2) (mV)
0.002 609 0.23 - 0.16 31
0.010 618 0.43 - 0.13 33
0.050 627 0.84 - 0.12 33
0.10 631 1.12 - 0.11 34
1.0 638 2.92 - 0.09 37
2.0 649 3.86 586 0.08 42
6.0 658 4.7 580 0.06 48
10.0 660 5.12 580 0.05 46
Figure 2. Cyclic voltammograms for DIP 1.0 x 10⁻³ mol L-1 at Pt
disk electrode (φ=0.5mm) in 0.1 mol L-1 H2SO4 solution. v (a) 0.1;
(b) 1.0; (c) 2.0; (d) 10.0 Vs-1.
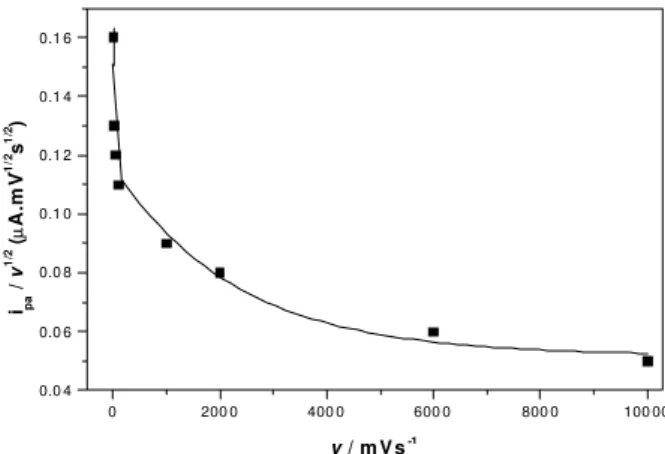
The behavior of the current function (Ip v-1/2) which
decreases exponentially as the scan speed increases (Figure 4) is also compatible with an electrode reaction coupled with a following chemical reaction (ECi), as is the increase in the value of the anodic peak potential (Epa)
observed with the increase in scan speed (Table 1). Voltammetric anodic peak currents registered at v = 10 mV s-1 in the 0.5 to 5 x 10⁻³ mol L-1 DIP concentration range
showed good linearity (correlation coefficient r = 0.997), as expected for a diffusion controlled process.
Figure 3. Anodic peak currents (ipa) for DIP as a function of v1/2,
obtained in 1.0 x 10⁻³ mol L-1 of DIP in 0.1 mol L-1 H2SO4 solution at the Pt disk electrode (φ=0.5mm). r=0.9986.
Figure 4. Variation of the current function (ipa/v1/2) with scan rate
for DIP 1.0 x 10⁻³ mol L-1 in 0,1 mol L-1 H 2SO4.
30 0 40 0 50 0 60 0 70 0 80 0
-4 -2 0 2 4 6 8
d
c
b
a
i /
µµ
A
E / mV vs EAg/AgCl
0.0 0.5 1.0 1.5 2.0 2.5 3.0 3.5
0 1 2 3 4 5 6
ipa
/
µ
A
v1/2 / V1/2s-1/2
0 200 0 400 0 600 0 800 0 100 00
0.0 4 0.0 6 0.0 8 0.1 0 0.1 2 0.1 4 0.1 6
ipa
/
v
1/
2 (
µµ
A.
m
V
-1
/2s
1/
2)
both substituents, bis-ethanolamines and piperidines. The pKa of the nitrogens of the pyrimido pyrimidine ring are
probably quite low (below 2) and the formation of an in-tramolecular hydrogen bond of these nitrogens to the bis-ethanolamine substituents would make it even lower, un-observable. In the case of RA25 the observation of two pKa
values is probably associated to both protonation of the methylamine nitrogens (pKa=5.2) and the nitrogens in the
ring (pKa=2.2). In this case the impossibility of intramo-lecular bond formation would allow the observation of this second pKa due to the protonation of the ring nitrogens, not observed in DIP. Considering, in agreement with the pKa value of DIP of 5.8 previously measured by spectros-copy12,13, that the DIP is totally protonated in the 0.1 mol
L-1 H2SO4 solutions, and by comparison with the
oxida-tive potentials of other known antioxidants like ascorbic acid, it is possible to preview that DIP can still act as an antioxidant when protonated. Otherwise it can be stated, based on the measured diffusion limited current, that the protonated DIP is 2.6 times less mobile than the ferricya-nide ion in this medium.
of only one DIP molecule in the electrode process excluding the occurrence of other competing reaction. The same proce-dure applied to the data presented in Figure 7 results in the plot of log i vs log CH+ shown in the insert for that figure
where the obtained straight line has a slope of –1.15 which is indicative of the release of one H+ ion for each oxidized
DIP molecule.
Figure 5. Cyclic voltammograms of (A) 1.0 x 10⁻³ mol L-1 DIP and
(B) 1.0 x 10⁻³ mol L-1 K3Fe(CN)6 in 0.1 mol L-1 H2SO4 solutions at Pt UME (φ=25mm) v= 2 mVs-1.
Current-potential diagrams
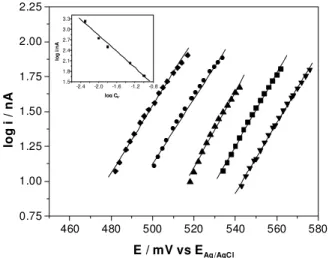
The stepped polarization procedure as described above provides current data values that can be related to the quasi-stationary condition and that can be used to construct Tafel lines by plotting log i vs E, as show in Figure 6 for different DIP concentrations and in Figure 7 for different sulfuric acid concentrations. The analysis of the slopes of Tafel plots for the two cases shows linear segments with slopes close to 30 mV/decade as expected for a two electron reaction.
The log i vs log CDIP curve plotted in the insert for
Figure 6, obtained for currents at the fixed E value of +570 mV results in a straight line with a slope of 0.98 and correla-tion coefficient r=0.999, which implies in the participacorrela-tion
Figure 6. Tafel plots for different concentrations of DIP in
0.1 mol L-1 H2SO4 solutions: (■) 0.48; (●) 0.91; (▲) 2.0; (▼) 3.1; (◆)
3.94 and (✚) 5.0 x 10⁻³ mol L-1. Insert - log i / nA vs. log C DIP in 0.1
mol L-1 H
2SO4, E= +570mV. r=0.999
Figure 7. Tafel plots for different concentrations of H2SO4 (◆) 5.0;
(●) 10.0; (▲) 15.0; (■) 50.0 and (▼) 100.0 x 10⁻³ mol L-1. CDIP 1.0
x 10-3 mol L-1. Insert - Log i / nA vs. log CH+, E= +570mV, r=0.996.
Controlled potential electrolysis
Exhaustive electrolysis experiments were conducted to confirm the number of electrons involved, the reaction completion and the possibility to prepare the electrolytic products for subsequent identification. These experiments were monitored by recording cyclic voltammetry with
400 600 800
0 1 2 3 4
A
i
/ n
A
E / mV vs E
Ag/AgC l
0 200 400 600
-4 -3 -2 -1 0
B
520 540 560 580 600
0.5 1.0 1.5 2.0 2.5 3.0
lo
g
i/
n
A
E / mV vs EAg/AgCl
- 3.4 - 3.2 - 3.0 - 2.8 - 2.6 - 2.4 - 2.2
1.0 1.2 1.4 1.6 1.8 2.0 2.2
log i
/nA
l og CD IP
460 480 500 520 540 560 580
0.75 1.00 1.25 1.50 1.75 2.00 2.25
lo
g
i / n
A
E / mV vs EAg/AgCl
-2.4 -2.0 -1.6 -1.2 -0.8
1.5 1.8 2.1 2.4 2.7 3.0 3.3
lo
g
i/n
A
ultramicroelectrode at low scan speed, where a progres-sive decay in the diffusion current was observed, showing the total consumption of DIP after 60 minutes of the elec-trolysis process (Figure 8). The integrated elecelec-trolysis charge was also that expected for the two electron removal of each DIP molecule.
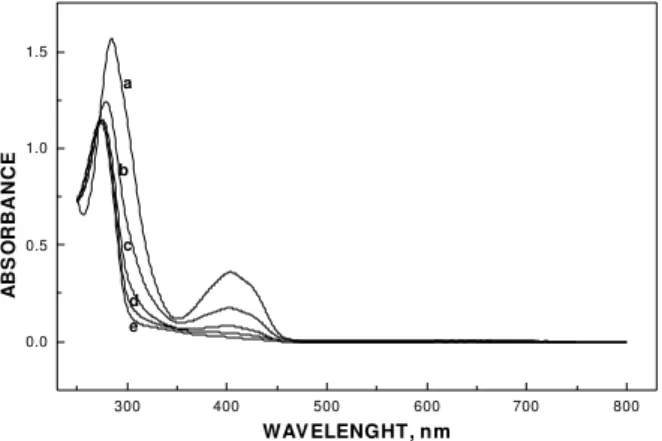
The optical absorption spectra were also registered every 15 minutes during the course of the electrolysis and, as shown in Figure 9, the absorption band with maximum close to 400 nm disappears while the ultra violet band at 280 nm decreases in intensity shifting to shorter wavelength values. This new spectrum of the discolored solution can be attributed to the presence of the oxidation products for this reaction.
to be 3% of the value found in acetonitrile solvent. Due to the protonation the fluorescence of DIP is significantly reduced12,13. The fluorescence emission vanishes
com-pletely in the course of the electrolysis.
Reaction stoichiometry for DIP oxidation
According to the results of the present work the equation for the electrochemical heterogeneous irreversible oxidation reaction of dipyridamole in acid media can be written as:
DIPH+ → A2+ + H+ + 2e
-A2+ is the resulting product from the electrochemical
re-action, which is chemically consumed probably by one homogeneous hydrolytic reaction.
It is worth of mention that in the analytical determi-nation of DIP in acidic medium in the presence of H2O2 the authors suggested that the cleavage of the piperidine ring with the formation of an aldehyde occurs as a first step with the subsequent formation of an N-oxide deriva-tive in the pyrimido pyrimidine ring14. Since they did
not characterize the final oxidation product (s) this pro-posal remains only speculative.
The observed mechanism is in contrast with the oxi-dation process observed in organic solvents like aceto-nitrile where a two step one electron process was found, the first one corresponding to the formation of a stable cationic radical. In that non-aqueous medium the second process leads to a larger number of oxidation products which are observed by analysis of the optical and voltammetric spectra. Besides that the cationic radical is not stabilized in aqueous acidic solutions which is con-sistent with the fact that DIP protonation makes the oxi-dation more difficult increasing the necessary potential corresponding to a two-electron process.
Additional relevant mechanistic conclusions can only be drawn by the proper study of the molecule electronic structure, and by the identification of the reaction products in the different media. Some analytical studies with these purposes are in course.
Conclusions
The electrochemical oxidation of DIP in aqueous acid medium is characterized by an irreversible two elec-tron process where the primary oxidation product is transformed by a coupled homogeneous irreversible re-action. The observed voltammetric behavior is compat-ible with an ECi overall reaction mechanism, which will be object of future research. The voltammetric experi-ments carried out at high scan speeds (above 1 V s-1)
Figure 8. Cyclic voltammograms (forward scans) for the oxidation
of 0.5 x 10⁻³ mol L-1 of DIP in 0.1 mol L-1 acetate buffer solution
(pH=3.0), at UME of Pt (φ=25mm), ν=20 mV s-1. Bulk electrolysis
at E = +850mV (a) 0; (b) 15; (c) 30; (d) 45 and (e) 60 min.
Figure 9. Optical absorption spectra of DIP 0.5 x 10⁻³ mol L-1 in
0.1 mol L-1 acetate buffer solution (pH=3.0), during bulk electrolysis
at E = + 850mV: (a) 0; (b) 15; (c) 30; (d) 45 and (e) 60 min.
The fluorescence emission spectra were also registered. Before the electrolysis the starting fluorescence emission with maximum at 500 nm has an intensity which was found
300 400 500 600 700 800 900
-0.5 0.0 0.5 1.0 1.5 2.0 2.5
e d c b a
I / n
A
E / mV vs EAg/AgCl
300 400 500 600 700 800
0.0 0.5 1.0 1.5
e d c b a
A
BS
O
RBANCE
show the appearance of the reduction process, which means that the chemically coupled reaction is not very fast and can be followed by voltammetry. Repetitive cyclic voltammetric experiments have shown that the electrode reaction is clean in the sense that the elec-trode remains activated after a great number of cycles. Despite the characteristic symmetric double functional-ity of the DIP structure the stoichiommetry found for the an-odic oxidation of DIP in aqueous acid solutions corresponds to a two electrons removal for each DIP molecule followed by the release of one proton per oxidized molecule.
These conclusions were supported by the application of the usually accepted criteria for mechanistic choice based on Tafel data.
Acknowledgments
The authors are grateful to FAPESP, CNPq , CAPES and FINEP for financial support.
References
1. Fitzgerald, G. A. N. Engl. J. Med. 1987, 316, 1247.
2. De La Cruz, J. P.; Carrasco, T.; Ortega, G.; Sánches de la Cuesta, F. Lipids1992, 27, 192.
3. Iuliano, L.; Pedersen, J. Z.; Rotilio, G.; Ferro, D.; Violi, F. Free Rad. Biol. Med.1995, 18, 239.
4. Pedulli, G. F.; Lucarini, M.; Marchesi, E.; Paolucci, F.; Roffia, S.; Fiorentini, D.; Landi, L. Free Rad. Biol.
Med.1999, 26, 295.
5. Almeida, L. E.; Castilho, M.; Mazo, L. H.; Tabak, M.
Anal. Chim. Acta1998, 375, 223.
6. Barary, M. H.; El-Sayed, M. A. H.; Abdel-Hay, M. H.; Mohamed, S. M. Anal. Lett.1989, 22(7), 1643. 7. Zhang, J.; Miller, R. B.; Russel, S.; Jacobus, R. J. Liq.
Chrom. & Rel. Technol.1997, 20(13), 2109. 8. Zeng, X.; Lin, S.; Hu, N. Talanta1993, 40, 1183. 9. Wang, Z.; Zhang, H.; Zhou, S. Talanta1997, 44, 621. 10. Mazo, L. H.; Machado, S. A. S.; Avaca, L. A. Instrum.
Scienc. Technol.1994, 22, 61.
11. Borges, C. P. F.; Tabak, M. Spectrochimica Acta1994
50A (6), 1047.
12. Borissevitch, I. E.; Tabak, M. J. of Luminescence
1992, 51, 315.
13. Borges, C. P. F.; Borissevitch, I. E.; Tabak, M.
J. of Luminescence1995,65, 105.
Received: June 01, 1999