Measurements of the Neutron Spectrum Energy in the IPEN/MB-01 Reactor Core
Ulysses d’Utra Bitelli, Fernando Prat Gonc¸alves Martins and Rog´erio Jerez Instituto de Pesquisas Energ´eticas e Nucleares, IPEN - CNEN/SP
Av. Prof. Lineu Prestes, 2242 – Cidade Universitria – CEP 05508-000 S˜ao Paulo – SP – Brasil (Received on 12 September, 2008)
This work presents the results of neutron spectrum measurements at central position of the IPEN/MB-01 reactor core. For this purpose has been used several activation foils (Au, Sc, U, Mg, Ti, Ni, and In Foils) that have been irradiated at central position of the reactor core (standard rectangular configuration 28×26 fuel rods) in the maximum power level (100 watts). After this one the foils were counting at HPGe solid state detector (gamma spectrometry). The nuclear reaction rates experimental results (saturated activity per target nucleus) is together with an initial approach to the neutron reactor spectrum (estimated by reactor physics cellular codes) the main data to obtain the most appropriated neutron spectrum at the irradiation position by interactive adjustment process using the unfolding SANDBP code. The results obtained were (5.1312±0.1609).109 n/cm2.s to the integral neutron flux, (9.8087±0.4974).108n/cm2to the thermal neutron flux, (3.2272±0.4378).109n/cm2.s to the intermediate neutron flux and (1.9040±0.6390).109n/cm2.s to the fast neutron flux. These results are important and may be used to check and validate reactor physics codes and several nuclear data libraries.
Keywords: Neutron spectrum; Nuclear reaction rate; Activation detectors; Neutron flux; Reactor core; Gamma spectrometry
1. INTRODUCTION
Several nuclear reactor physics parameters are obtained through the spectrometry gamma of targets irradiated inside the core of a research reactor. This is the case of the nu-clear reaction rates measured by activation foils by the mea-surements of its induced radioactivity, known parameters as irradiation time, time of counting, wait time for counting (de-cay), efficiency of the counting system, cross section for the nuclear reaction, etc. Thus it is possible to determine the neutron flux exactly at place where the same foils had been irradiated. The reaction rates depend of several factors. The most important is the cross section magnitude value around the energy spectrum region that had been covered by mate-rials (activation detectors) with different neutronic sensitiv-ity (cross section). The experimental values obtained can be used to estimate the important reactor physics parameters as such neutron flux (thermal, intermediate and fast), extension of the asymptotic region, spectral indices (cadmium ratio), buckling, etc. These experimental parameters when com-pared with the same parameters calculated by reactor physics codes enable to obtain the accuracy and precision of the dif-ferent calculation methodology and its nuclear data libraries associated.
The knowledge of the energetic and spatial neutron flux dis-tribution in reactor core is very important because enable to estimate with good precision several reactors physics param-eters such as nuclear reaction rates, fuel burnup and safety parameters (temperature distribution, peak factors, reactiv-ity).
The neutron energy spectrum of research reactors can be obtained by reaction nuclear rates induced in activation de-tectors (metallic foils) irradiated inside of the reactor core always in the same position and reactor operational condi-tions such as power level, control rods posicondi-tions, moderate (water) temperature, etc. Thus for this purpose may be used unfolding codes such as SANDII, SANDBP [1], SPECTRA [2] and others. These codes by iterative processes change the initial spectrum (generally calculated by reactor physics codes and its associated data libraries) to the best spectrum adjusted by the minimum deviation between experimental
and calculation saturation activity per nucleus target of the different irradiated foils. This work used the SANDBP that is computer code developed by Technical University of Bu-dapest. This code is a modified version of the SANDII code [3] and the main difference is that is possible to use the ex-perimental input (saturation activity per nucleus target) with its uncertainties. Thus is possible to obtain the neutron flux and its uncertainties at all neutron spectrum energy after to run the SANDBP code that change the initial and calculation spectrum obtained by cellular codes. For an iterative process is obtained a ratio between calculated and experimental nu-clear reaction rates and this ratio is used to modify the initial neutron spectrum around several energy ranges where there are foils covering. Some energy ranges where do not exist this covering the code makes an interpolation. In this work the initial neutron spectrum was calculated using the cellular code Hammer-Technion at 84 energy groups at cell repre-sentative of the IPEN/MB-01 reactor core. In this calcula-tion the initial guess spectrum was obtained exactly in the central position of the moderate region of the IPEN/MB-01 representative cell by Hammer-Technion cellular code using the ENDF/B-V nuclear data libraries using neutron transport theory.
2. EXPERIMENTAL METHODOLOGY
The IPEN/MB-01 reactor is a zero power reactor projected to measure a great variety of the nuclear reactor Physics pa-rameters. After 20 years and more than 2200 operations sev-eral experiments were made and some ones have an inter-national status at OECD/NEA (benchmarks). The standard reactor core consist of 26 ×28 fuel elements (rectangular configuration). This configuration has 680 fuel elements and 2 safety rods and 2 control rods. Each safety and control rods contains 12 absorbed neutron rods (B4C to safety rods and Ag-In-Cd allow to control rods). The fuel is UO2and the
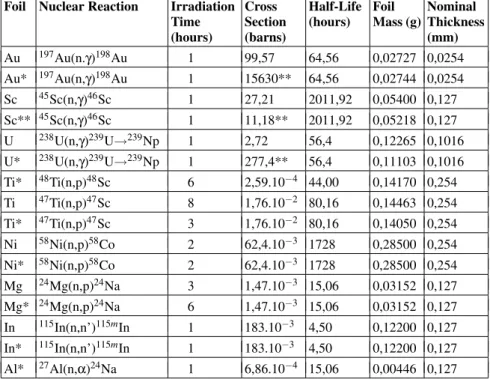
TABLE 1: Foils Data: Nuclear reactions, irradiation time, cross section, half-life of formatted radionuclide, mass and thickness.
Foil Nuclear Reaction Irradiation Time (hours)
Cross Section (barns)
Half-Life (hours)
Foil Mass (g)
Nominal Thickness (mm)
Au 197Au(n.γ)198Au 1 99,57 64,56 0,02727 0,0254 Au* 197Au(n,γ)198Au 1 15630** 64,56 0,02744 0,0254
Sc 45Sc(n,γ)46Sc 1 27,21 2011,92 0,05400 0,127
Sc** 45Sc(n,γ)46Sc 1 11,18** 2011,92 0,05218 0,127
U 238U(n,γ)239U→239Np 1 2,72 56,4 0,12265 0,1016 U* 238U(n,γ)239U→239Np 1 277,4** 56,4 0,11103 0,1016 Ti* 48Ti(n,p)48Sc 6 2,59.10−4 44,00 0,14170 0,254
Ti 47Ti(n,p)47Sc 8 1,76.10−2 80,16 0,14463 0,254
Ti* 47Ti(n,p)47Sc 3 1,76.10−2 80,16 0,14050 0,254 Ni 58Ni(n,p)58Co 2 62,4.10−3 1728 0,28500 0,254 Ni* 58Ni(n,p)58Co 2 62,4.10−3 1728 0,28500 0,254
Mg 24Mg(n,p)24Na 3 1,47.10−3 15,06 0,03152 0,127
Mg* 24Mg(n,p)24Na 6 1,47.10−3 15,06 0,03152 0,127
In 115In(n,n’)115mIn 1 183.10−3 4,50 0,12200 0,127 In* 115In(n,n’)115mIn 1 183.10−3 4,50 0,12200 0,127
Al* 27Al(n,α)24Na 1 6,86.10−4 15,06 0,00446 0,127
*– cadmium covered (0.5 mm Thickness);** – Resonance integral
2.1. Irradiation Conditions
To obtain the final results of the neutron spectrum at central position of the IPEN/MB-01 reactor core were irradiated 8 kinds of foils and analyzed 16 nuclear reactions. The mate-rials foils irradiated, irradiation time, foils masses and thick-ness are showed in the Table 1.
The times irradiation were estimated from knowledge of ra-dionuclides half-lives formatted through of nuclear reactions and the its cross section magnitude. Some foils were cover-ing by cadmium boxes to avoid the thermal neutron interfer-ence. Every irradiation was made in the maximum reactor power level (100 watts) and in the same experimental condi-tions (control rods posicondi-tions, foil posicondi-tions). The foils were positioned in the central position of the core by experimen-tal apparatus called articulated device that consist of acrylic ruler. In this acrylic ruler are fixed the foils and them inserted in moderator channel between central fuel elements by artic-ulate system. The nuclear channel number 10 (10B detector) is the most far detector at the east face of the reactor core (∼40 cm). Therefore it was used to normalize the little op-erational different of power level between each irradiation. Thus each little power level fluctuation was corrected. The control rods positions always were the same (∼41% inserted) during all irradiations to avoid flux neutron distur-bance.
2.2. Gamma Spectrometry
The foils are sent to gamma spectrometry laboratory to determine the radioactivity after its irradiation. This parame-ter is directly proportional the nuclear reaction rate. For this
FIG. 1: Decay Curve to Gold Foil.
purpose a detector of solid state of hyper-pure germanium of relative efficiency 40% was used to gamma spectrometry. An example can be visualized in Figure 1 that it shows the curve of radioactive decay of the gold foil.
3. ANALYSIS OF THE RESULTS
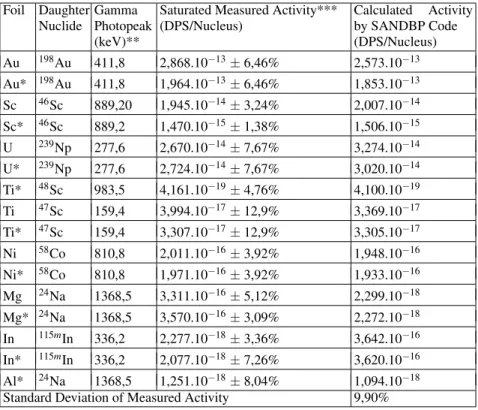
TABLE 2: Saturated Measured Activity with Calculated Activity by SABDBP code after 3 iterations.
Foil Daughter Nuclide
Gamma Photopeak (keV)**
Saturated Measured Activity*** (DPS/Nucleus)
Calculated Activity by SANDBP Code (DPS/Nucleus)
Au 198Au 411,8 2,868.10−13±6,46% 2,573.10−13
Au* 198Au 411,8 1,964.10−13
±6,46% 1,853.10−13
Sc 46Sc 889,20 1,945.10−14
±3,24% 2,007.10−14
Sc* 46Sc 889,2 1,470.10−15±1,38% 1,506.10−15 U 239Np 277,6 2,670.10−14
±7,67% 3,274.10−14
U* 239Np 277,6 2,724.10−14
±7,67% 3,020.10−14
Ti* 48Sc 983,5 4,161.10−19±4,76% 4,100.10−19
Ti 47Sc 159,4 3,994.10−17
±12,9% 3,369.10−17
Ti* 47Sc 159,4 3,307.10−17
±12,9% 3,305.10−17
Ni 58Co 810,8 2,011.10−16±3,92% 1,948.10−16 Ni* 58Co 810,8 1,971.10−16
±3,92% 1,933.10−16
Mg 24Na 1368,5 3,311.10−16±5,12% 2,299.10−18
Mg* 24Na 1368,5 3,570.10−16
±3,09% 2,272.10−18
In 115mIn 336,2 2,277.10−18±3,36% 3,642.10−16 In* 115mIn 336,2 2,077.10−18
±7,26% 3,620.10−16
Al* 24Na 1368,5 1,251.10−18±8,04% 1,094.10−18
Standard Deviation of Measured Activity 9,90%
*– cadmium covered; **– net peak counts during the gamma spectrometry; ***– Corrected to self-shielding effect.
the wait time to countingtw, irradiation time ti, and counting
timetcit is possible to obtain the saturated activity foilA∞of
the equation (3.1).
A∞= C.λ.e (λ.tw)
I.ε. 1−e−λ.tc 1−e−λ.ti·CF (3.1) CF is a total correction factors. This factor is a product of little fluctuation power level factor between the several irradiations, discount to contribution do activity foil due ramp power elevation until the irradiation level (ramp factor), and gamma self-absorption during the gamma spectrometry (self-absorption factor).
The main input data in the SANDBP code is the saturated activity per target nucleus (A∞n) given by the next equation (3.2), whereW is the weight atomic of the target nucleus, m the mass foil, fisothe isotropic fraction of the target nucleus,
and NA the Avogadro number.
A∞n = A
∞.W m.NA.fiso
(3.2)
The experimental results are given in the Table 2 for each type of foils and its respective activities of saturation for tar-get nucleus. Also is present the ratio measured from calcu-lated activity obtained from SANDBP code after 3 iterations. The standard deviation was 9.90% between the measured ac-tivities and those adjusted by the most appropriated neutron spectrum obtained through SANDBP code. The most appro-priated adjusted neutron spectrum is sowed in next Figure 1. The SANDBP code gives the most appropriated spectrum adjusted (Figure 1) from the inputs data such as initial guess
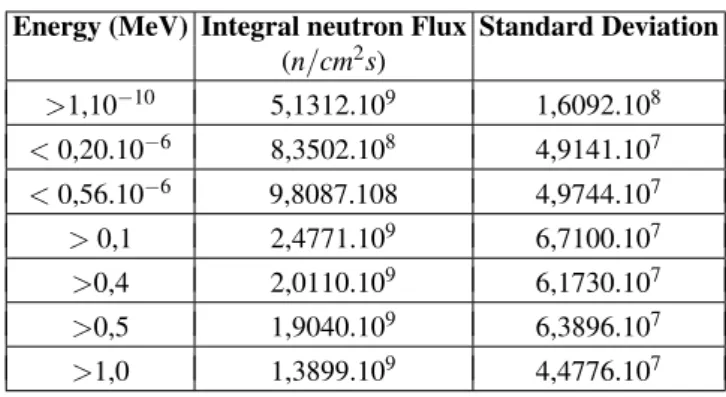
spectrum given by Hammer – Technion cellular code and the experimental values of the saturated activity per target nu-cleus given in the Table 2. Thus in the Table 3 is showed the neutron fluxes values given by SANDBP Code.
FIG. 2: Neutron Spectrum at the Central Position of the IPEN/MB-01 Reactor Core obtained by SANDBP Code (3 iterations) to 51 energy points/5/.
TABLE 3: Neutron Flux values obtained by SANDBP code/5/. Energy (MeV) Integral neutron Flux Standard Deviation
(n/cm2s)
>1,10−10 5,1312.109 1,6092.108 <0,20.10−6 8,3502.108 4,9141.107 <0,56.10−6 9,8087.108 4,9744.107
>0,1 2,4771.109 6,7100.107
>0,4 2,0110.109 6,1730.107
>0,5 1,9040.109 6,3896.107
>1,0 1,3899.109 4,4776.107
fast (above 0,5 Mev) will be possible to obtain the integral neutron flux inside each energy range. Thus, the magnitude of the thermal neutrons at the central position of the standard configuration core (28×26 fuel elements arrangement) is given below.
Φ(Thermal) = (9,8087±0,4974).108n/cm2.s The same way the Intermediate Neutron flux.
Φ(Intermediate) = (3,2272±0,378).109n/cm2.s Finally the fast neutron flux.
Φ(Fast) = (1,9040±0,6390).109n/cm2.s
FIG. 3: Comparative Graphics between Initial Guess Spectrum cal-culated by Hammer-Technion Cellular Code and that obtained by Experimental Values Using the SANDBP Code. The Spectrum is presented in Lethargy Units.
4. FINAL COMMENTS
The best neutron spectrum adjusted at experimental val-ues (saturated activity per target nucleus) and initial gval-uess spectrum calculated by transport theory (Hammer-technion cellular code) showed a 9,91% standard deviation between experimental values (saturated activity per target nucleus) and those obtained by SANDBP Code to adjusted neutron spectrum. When are compared the integral neutron flux ob-tained by SANDBP Code with calculated values obob-tained by CITATION/6/ code (Diffusion Theory using Hammer-Technion data input to Cross Section in collapsed Groups ) at central position of the core is possible to see that there are a good agreement between both methodologies. This can be sawn in the Table 4. The calculated value is sub estimated about 5% .The same way when are compared the shape of the initial neutron spectrum (Hammer-Technion) and that ob-tained by SANDBP Code after 3 iterations how can be sawn at Figure 2. For future works will very interesting to change the initial guess neutron spectrum to make an analysis of the sensitivity in the final neutron spectrum results. The same way would be interesting to use more activation foils of dif-ferent materials to cover specially the intermediate region of the neutron spectrum.
TABLE 4: Integral Neutron Flux at Central Position of the IPEN/MB-01 (Standard Configuration of 28×26 fuel rods.
Integral Neutron Flux Adjusted Calculated Integral Neutron
C/E
at Experimental values by
Flux by Citation Code
/6/SANDBP Code
/1/(
n/cm
2.s
)
(
n/cm
2.s
)
(5,13
±
0,32*).10
94,87.10
9(0,95
±
0,06*)
*– Statistical Confidence Level of 2 Sigma (95,45% ).
The neutron spectrum is a very important reactor physics pa-rameter. Its understanding to take possible the estimation of nuclear reaction rates and the neutron flux values. These re-sults are important and may be used to check and validate reactor physics codes and different nuclear data libraries.
[1] E.J. Szondi, E.M. Zsolnay, Documentation of the Code SANDBP: Report, Institute of Nuclear Techniques, Technical
University of Budapest, Budapest, September 1992.
Unfold-ing Neutron Spectra From Activation Measurements, Report SC-RR-67-746-1967.
[3] W.N. McElroy, et al.Sand. Neutron Spectra Determination by Multiple Foil Activation Iterative Method. Oak Ridge National Laboratory, RSIC Computer Code Collection CCC-112, May 1969.
[4] J.E. Suich, H.C. Honeck,The Hammer System Heterogeneous Analysis of Multigroup Methods of Exponential and reactor.
Aiken, S.C., Du Pont de Nemours, Savannah River Laboratory, 1967.
[5] F.P.G. Martins,Medida do Espectro de Energia dos Nutrons no Ncleo do Reator IPEN/MB-01. Dissertao de Mestrado, IPEN, 2006.