Application of alternative anthropometric
measure-ments to predict metabolic syndrome
Gul Sagun,IAytekin Oguz,IEngin Karagoz,I Arzu Tig˘li Filizer,IIGonca Tamer,III Banu MesciI
IIstanbul Medeniyet University Goztepe Training and Research Hospital, Department of Internal Medicine, Istanbul, Turkey.IIIstanbul Medeniyet
University Goztepe Training and Research Hospital, Department of Family Medicine, Istanbul, Turkey.IIIIstanbul Medeniyet University Goztepe Training and Research Hospital, Department of Endocrinology, Istanbul, Turkey.
OBJECTIVE:The association between rarely used anthropometric measurements (e.g., mid-upper arm, forearm, and calf circumference) and metabolic syndrome has not been proven. The aim of this study was to assess whether mid-upper arm, forearm, calf, and waist circumferences, as well as waist/height ratio and waist-to-hip ratio, were associated with metabolic syndrome.
METHODS: We enrolled 387 subjects (340 women, 47 men) who were admitted to the obesity outpatient department of Istanbul Medeniyet University Goztepe Training and Research Hospital between September 2010 and December 2010. The following measurements were recorded: waist circumference, hip circumference, waist/height ratio, waist-to-hip ratio, mid-upper arm circumference, forearm circumference, calf circumference, and body composition. Fasting blood samples were collected to measure plasma glucose, lipids, uric acid, insulin, and HbA1c.
RESULTS: The odds ratios for visceral fat (measured via bioelectric impedance), hip circumference, forearm circumference, and waist circumference/hip circumference were 2.19 (95% CI, 1.30-3.71), 1.89 (95% CI, 1.07-3.35), 2.47 (95% CI, 1.24-4.95), and 2.11(95% CI, 1.26-3.53), respectively. The bioelectric impedance-measured body fat percentage correlated with waist circumference only in subjects without metabolic syndrome; the body fat percentage was negatively correlated with waist circumference/hip circumference in the metabolic syndrome group. All measurements except for forearm circumference were equally well correlated with the bioelectric impedance-measured body fat percentages in both groups. Hip circumference was moderately correlated with bioelectric impedance-measured visceral fat in subjects without metabolic syndrome. Muscle mass (measured via bioelectric impedance) was weakly correlated with waist and forearm circumference in subjects with metabolic syndrome and with calf circumference in subjects without metabolic syndrome. CONCLUSION:Waist circumference was not linked to metabolic syndrome in obese and overweight subjects; however, forearm circumference, an unconventional but simple and appropriate anthropometric index, was associated with metabolic syndrome and bioelectric impedance-measured visceral fat, hip circumference, and waist-to-hip ratio.
KEYWORDS: Metabolic Syndrome; Anthropometric Measurements; Body Composition.
Sagun G, Aytekin O, Karagoz E, Filizer AT, Tamer G, Mesci B. Application of alternative anthropometric measurements to predict metabolic syndrome. Clinics. 2014;69(5):347-353.
Received for publication onOctober 12, 2013;First review completed onNovember 6, 2013;Accepted for publication onNovember 6, 2013 E-mail: [email protected]
Tel.: 0216 566 40 00
& INTRODUCTION
Metabolic syndrome (MetS) was described by Reaven in a 1988 Banting award lecture, and the National Cholesterol Education Program-Adult Treatment Panel III (NCEP-ATP III) has recommended the most commonly used criteria for diagnosing MetS (1,2). The International Diabetes
Federation (IDF) recently proposed using lower cut-off values for waist circumference (WC) for some ethnic groups to identify individuals who are likely to have insulin resistance (3). High waist circumference is a mandatory criterion for MetS diagnosis in the IDF criteria. MetS includes visceral adiposity, which is closely associated with diabetes, hyperlipidemia, hypertension, and cardiovascular disease (MetS components) (4,5). The relationship between waist circumference and intra-abdominal obesity depends on age, gender, and ethnicity (6,7). Findings in studies of different ethnic groups have revealed inconsistent results (8-11).
Although studies have indicated the harmful metabolic effect of high amounts of visceral adipose tissue, evidence suggests that subcutaneous fat is not without harm (12,13).
Copyrightß2014CLINICS– This is an Open Access article distributed under the terms of the Creative Commons Attribution Non-Commercial License (http:// creativecommons.org/licenses/by-nc/3.0/) which permits unrestricted non-commercial use, distribution, and reproduction in any medium, provided the original work is properly cited.
No potential conflict of interest was reported.
Visceral and subcutaneous fat tissue is associated with inflammatory markers and disease risk (14). High levels of subcutaneous fat can also contribute to insulin resistance (15,16). Moreover, WC is more highly correlated with subcutaneous fat tissue than with visceral adipose tissue (17). According to the results of previous studies, in some ethnic groups, the structural heterogeneity of tissue in the abdominal region does not allow the use of a unique definition of abdominal obesity or, consequently, MetS. Several anthropometric indices, such as body mass index (BMI), waist circumference (WC), hip circumference (HC), waist-to-hip ratio (WC/HC), and waist/height ratio (WC/ ht), have been proposed to identify individuals who are at risk of MetS and its components (18,19). These anthropo-metric indices have been investigated in numerous publica-tions, but direct measurements related to the extremities, such as the mid-upper arm circumference (MUAC), forearm circumference (FC), and calf circumference (CC), have not studied in relation to MetS. In addition, the relationship between body composition and these rarely used anthro-pometric indices has not been reported in any population.
Our purpose was to determine the association between MetS and MUAC, FC, and CC as unusual anthropometric measurements. The correlation of all anthropometric mea-surements (WC, HC, WC/HC, WC/ht, MUAC, FC, and CC) with % body fat (bioelectric impedance body fat percentage, BF), visceral fat (bioelectric impedance visceral fat, BEI-VF), and % body muscle (bioelectric impedance muscle percentage, BEI-M) was assessed using the bioelectric impedance method.
& METHODS
We conducted a cross-sectional study of 387 consecutive subjects (340 women, 47 men) aged 18 to 64 years who were admitted to the obesity outpatient department of Istanbul Medeniyet University Goztepe Training and Research Hospital between September 2010 and December 2010. The exclusion criteria included overt or subclinical hypothyroidism, hyperthyroidism, Cushing’s disease, insu-lin- or sulfonylurea-dependent diabetes, malignancy, chronic renal and hepatic failure, and NYHA stage 3 and stage 4 congestive heart failure. The ethics committee of Istanbul Medeniyet University Goztepe Training and Research Hospital, Istanbul approved this study, and written informed consent was obtained from all subjects.
Biochemical measurements
Blood specimens were collected after 10 to 12 hours of fasting. Fasting plasma glucose, total cholesterol, triglycer-ides, HDL-C, LDL-C, uric acid, fasting insulin, and HbA1c were measured with standard assays. A Roche Cobas 8000 analyzer (Roche Diagnostics, Switzerland) was used to measure fasting plasma glucose (intra-assay cv % 1.7 and 0.7 for low and high concentrations, respectively), uric acid (intra-assay cv % 0.6 and 0.3 for low and high concentrations, respectively), triglycerides (intra-assay cv % 0.9 and 0.6 for low and high concentrations, respectively) and HDL-C (intra-assay cv % 0.8 and 0.6 for low and high concentrations, respectively). A Beckman Coulter Unicel Dxl 800 (Beckman Coulter Inc, USA) was used for the insulin assay (intra-assay cv % 5.6, 4.5, and 3.1 for normal, intermediate, and high concentrations, respectively). Primus MRDV with the HPLC technique was used for HbA1c (intra-assay cv % 0.82, 0.91,
and 0.46 for normal, intermediate, and high concentrations, respectively; inter-assay cv % 2.91, 1.79, and 1.09 for normal, intermediate, and high concentrations, respectively). The homeostasis model was used to assess insulin resistance (HOMA-IR). The formula for HOMA-IR is as follows: insulin resistance (HOMA-IR) = (fasting insulin [mU/l6fasting
glucose [mg/dl])/405 (20).
Anthropometric measurements and MetS definition
Height (centimeters) and weight (kilograms) were mea-sured with the subjects wearing light clothing and no shoes. BMI (kilograms per square meter) was calculated. WC was assessed at the midpoint between the 12th rib and the iliac crest, while hip circumference was measured at the level of the greater trochanter. WC/HC and WC/ht were then calculated. CC was measured at the widest level while the subject was standing upright. MUAC was measured at the midpoint between the acromion process and olecranon while the palm was held upward parallel to the floor with flexion of the elbow near the body. FC was measured from the widest level while the arm was hanging freely at the side.
MetS is defined based on the presence of three or more of the following criteria: abdominal obesity with waist circumference.94 cm for men or.80 cm for women (2), triglycerides $150 mg/dl (3), HDL-cholesterol,40 mg/dl for men or ,50 mg/dl for women (4), blood pressure
$130/85 mmHg, and (5) fasting glucose$100 mg/dl (2).
Body composition measurements
Bioelectric impedance (Omron BF 510 body composition monitor, Kyoto, Japan) was used to calculate percent body fat using the following equation: body fat percentage (%) = (body fat mass [kg]/body weight [kg])6100. Visceral fat is
represented as levels, and skeletal muscle is shown as a percentage.
Statistics
The statistical analyses were performed using the Number Cruncher Statistical System (NCSS) 2007 & PASS 2008 Statistical Software (Utah, USA) programs. The variables were investigated using graphs (histograms and probability plots), and the Kolmogorov-Smirnov test was used as an analytic method to determine whether the variables were normally distributed. For data analysis, descriptive methods (mean, standard deviation, frequency) were applied. Descriptive statistics are given as means¡
SD. Categorical data are represented as numbers and percentages. To compare between-group parameters that show normal distribution, Student’s t test was used. Receiver operating characteristic (ROC) curves were con-structed, and the areas under the curve (AUC) were calculated with a 95% confidence interval. Pearson’s coefficient was used for continuous variables with normal distribution. Logistic regression analysis was used to evaluate the independent predictors of MetS. A value of
p,0.05 indicated statistical significance.
& RESULTS
in age and BEI-BF, with higher values for both variables at the women with MetS, whereas HDL-C values were lower. For SBP, fasting plasma glucose and higher mean TG values were found in the men with MetS. The mean values for age, BEI-VF, WC, HC, MUAC, FC, WC/height, WC/HC, SBP, DBP, fasting plasma glucose, insulin, HOMA-IR, uric acid, TG, and HbA1c were significantly higher and HDL-C was lower in the subjects with MetS (Table 1).
In the subjects with and without MetS, body composition was correlated with some of the anthropometric measure-ments to various degrees. BEI-BF was positively correlated with HC, MUAC, CC, and WC/ht in subjects with and without MetS and negatively correlated with WC/HC in the subjects with MetS. However, BEI-BF was correlated with WC only in the subjects without MetS. BEI-VF was positively correlated with WC, MUAC, FC, CC, WC/ht, and WC/HC in the subjects with and without MetS. BEI-VF was also strongly correlated with CC in the subjects without MetS. BEI-VF was reflected equally well by MUAC and WC/ht, and it was even more strongly correlated with WC in the subjects with MetS. BEI-M was negatively correlated with HC and WC/ht in the subjects with and without MetS, but it was positively correlated with WC and FC only in the subjects with MetS. BEI-M was negatively correlated with CC only in the subjects without MetS. WC/HC was correlated with BEI-M in both groups (Table 2).
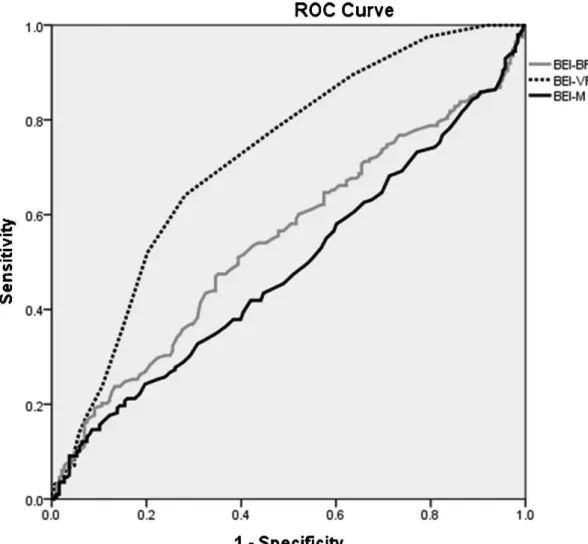
In Figure 1, the anthropometric measurements’ accuracy for diagnosing MetS is compared using plots of the ROC curves. The AUC value for WC/ht was slightly higher than were the AUC values for WC, WC/HC, FC, MUAC, and HC
(0.67, 0.65, 0.63, 0.63, 0.62, and 0.58, respectively). The sensitivity, specificity, positive predictive value, and nega-tive predicnega-tive values of the anthropometric measurements were as follows: 4.26%, 99.5%, 52.38%, and 88.89%, respectively, for WC; 48.94%, 67.34%, 58.26%, and 58.60% for HC; 40.24%, 78.70%, 57.58%, and 64.71% for MUAC; 39.63%, 84.62%, 59.09%, and 71.43% for FC; 35.98%, 72.78%, 53.95%, and 56.19% for CC; 58.51%, 72.86%, 65.02%, and 67.07% for WC/ht; and 62.23%, 66.33%, 65.02%, and 63.59 for WC/HC. ROC curves related to body composition revealed that BEI-VF was the best predictor (other than body composition) of MetS (AUC, 0.72; Figure 2). In terms of body composition measurements, the sensitivity, specificity, positive predictive value and negative predictive values, respectively, were as follows: 56.38%, 54.04%, 56.61%, and 53.81% for BEI-BF; 71.81%, 64.14%, 70.56%, and 65.53% for BEI-VF; and 46.28%, 49.49%, 49.25%, and 46.52% for BEI-M. Table 3 summarizes the logistic regression analysis results for BEI-BF, BEI-VF, BEI-M, WC, HC, MUAC, FC, CC, WC/ ht, and WC/HC as independent variables for MetS. BEI-VF, HC, FC, and WC/HC increased the risk of MetS 2.19 (95% CI, 1.30-3.71), 1.89 (95% CI, 1.89-1.07), 2.47 (95% CI, 1.24-4.95), and 2.11 (95% CI, 1.26-3.53) times, respectively. CC was close to significance, but it was not significant enough to increase the risk of MetS.
& DISCUSSION
The main finding of our study suggests that in an obese population, BEI-VF, HC, FC, and WC/HC are associated with MetS to varying degrees. As a direct measure of
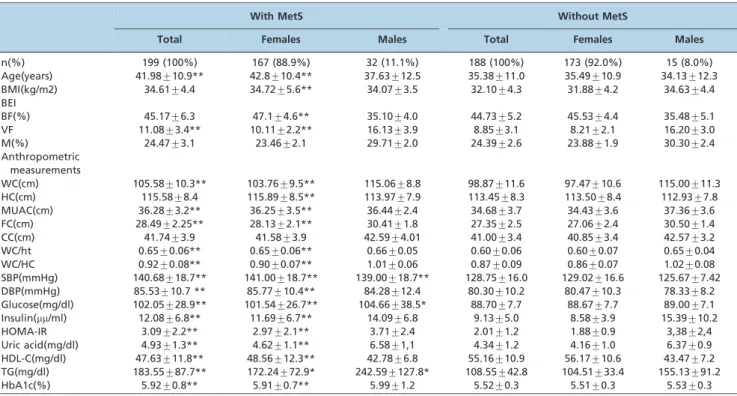
Table 1 -Descriptive characteristics, anthropometric indices, body composition, and metabolic risk parameters of the study population with and without MetS. n, (%), mean¡SD.
With MetS Without MetS
Total Females Males Total Females Males
n(%) 199 (100%) 167 (88.9%) 32 (11.1%) 188 (100%) 173 (92.0%) 15 (8.0%)
Age(years) 41.98¡10.9** 42.8¡10.4** 37.63¡12.5 35.38¡11.0 35.49¡10.9 34.13¡12.3 BMI(kg/m2) 34.61¡4.4 34.72¡5.6** 34.07¡3.5 32.10¡4.3 31.88¡4.2 34.63¡4.4 BEI
BF(%) 45.17¡6.3 47.1¡4.6** 35.10¡4.0 44.73¡5.2 45.53¡4.4 35.48¡5.1
VF 11.08¡3.4** 10.11¡2.2** 16.13¡3.9 8.85¡3.1 8.21¡2.1 16.20¡3.0
M(%) 24.47¡3.1 23.46¡2.1 29.71¡2.0 24.39¡2.6 23.88¡1.9 30.30¡2.4
Anthropometric measurements
WC(cm) 105.58¡10.3** 103.76¡9.5** 115.06¡8.8 98.87¡11.6 97.47¡10.6 115.00¡11.3 HC(cm) 115.58¡8.4 115.89¡8.5** 113.97¡7.9 113.45¡8.3 113.50¡8.4 112.93¡7.8 MUAC(cm) 36.28¡3.2** 36.25¡3.5** 36.44¡2.4 34.68¡3.7 34.43¡3.6 37.36¡3.6 FC(cm) 28.49¡2.25** 28.13¡2.1** 30.41¡1.8 27.35¡2.5 27.06¡2.4 30.50¡1.4 CC(cm) 41.74¡3.9 41.58¡3.9 42.59¡4.01 41.00¡3.4 40.85¡3.4 42.57¡3.2 WC/ht 0.65¡0.06** 0.65¡0.06** 0.66¡0.05 0.60¡0.06 0.60¡0.07 0.65¡0.04 WC/HC 0.92¡0.08** 0.90¡0.07** 1.01¡0.06 0.87¡0.09 0.86¡0.07 1.02¡0.08 SBP(mmHg) 140.68¡18.7** 141.00¡18.7** 139.00¡18.7** 128.75¡16.0 129.02¡16.6 125.67¡7.42 DBP(mmHg) 85.53¡10.7 ** 85.77¡10.4** 84.28¡12.4 80.30¡10.2 80.47¡10.3 78.33¡8.2 Glucose(mg/dl) 102.05¡28.9** 101.54¡26.7** 104.66¡38.5* 88.70¡7.7 88.67¡7.7 89.00¡7.1 Insulin(mm/ml) 12.08¡6.8** 11.69¡6.7** 14.09¡6.8 9.13¡5.0 8.58¡3.9 15.39¡10.2
HOMA-IR 3.09¡2.2** 2.97¡2.1** 3.71¡2.4 2.01¡1.2 1.88¡0.9 3,38¡2,4
Uric acid(mg/dl) 4.93¡1.3** 4.62¡1.1** 6.58¡1,1 4.34¡1.2 4.16¡1.0 6.37¡0.9 HDL-C(mg/dl) 47.63¡11.8** 48.56¡12.3** 42.78¡6.8 55.16¡10.9 56.17¡10.6 43.47¡7.2 TG(mg/dl) 183.55¡87.7** 172.24¡72.9* 242.59¡127.8* 108.55¡42.8 104.51¡33.4 155.13¡91.2
HbA1c(%) 5.92¡0.8** 5.91¡0.7** 5.99¡1.2 5.52¡0.3 5.51¡0.3 5.53¡0.3
Student’s t test. *
Table 2 -Pearson’s correlation coefficients between anthropometric measurements and body composition in subjects with and without MetS.
Anthropometric measurements BEI-BF BEI-VF BEI-M
r r r
With MetS (n = 199) WC -0.051 0.611** 0.151*
HC 0.498** 0.139 -0.363**
MUAC 0.232** 0.301** -0.102
FC -0.088 0.494** 0.223**
CC 0.213** 0.186* -0.069
WC/ht 0.307** 0.397** -0.218**
WC/HC -0.444** 0.516** 0.441**
Without MetS (n = 188) WC 0.288** 0.666** -0.059
HC 0.609** 0.288** -0.405**
MUAC 0.345** 0.516** -0.114
FC 0.148 0.553** 0.073
CC 0.378** 0.323** -0.166*
WC/ht 0.451** 0.592** -0.229**
WC/HC -0.119 0.608** 0.250**
r: Pearson’s correlation coefficient **p,0.01 *p,0.05.
WC, waist circumference; HC, hip circumference; MUAC, mid-upper arm circumference; FC, forearm circumference; CC, calf circumference; WC/ht, waist-to-height ratio; WC/HC, waist-to-hip ratio; BEI-BF, total body fat; BEI-VF, visceral fat; BEI-M, muscle.
extremity circumference, FC was closely related to BEI-VF, HC, and WC/HC as an indicator of MetS. We believe that the current study is the first to associate this unusual anthropometric index with MetS. We did not find a study
that directly discussed these results as related to unusual anthropometric measurements, such as MUAC, FC, and CC. WC is the main feature of MetS, according to the IDF. However, Tulloch-Reid et al. found that body fat distribu-tion and other general obesity measures are less important in predicting type 2 diabetes mellitus in male subjects with high BMIs (21). When the BMI is$30 kg/m2, WC/ht and WC lose their ability to indicate MetS in men. The San Antonio study concluded that body fat distribution was more strongly related to diabetes risk in subjects with BMIs
,27 kg/m2compared with subjects with BMIs
.27 kg/m2
(22). Different methods, such as air displacement plethys-mography, dual energy X-ray absorptiometry, and bioelec-trical impedance analysis, were used to determine body composition (21,23-25). However, there have been some discussions about the inaccuracy of the methods for assessing body composition. In the case of intra-abdominal fat distribution, different methods, such as computed tomography and magnetic resonance imaging, have been found to more accurately determine visceral fat and metabolic risk (26,27). However, high cost and radiation exposure limit the use of such methods in large epidemio-logical studies and daily medical practice.
Alternative methods have been developed to measure metabolic risk and different body composition; for example,
Figure 2 -Receiver-operating characteristic curves of body composition. BEI-BF: total body fat; BEI-VF: viseral fat; BEI-M: muscle.
Table 3 -Results of logistic regression analysis using anthropometric measurements and body composition.
p-value ODDS 95% CI
Lower Upper
BEI-BF 0.594 1.158 0.675 1.99
BEI-VF 0.003** 2.198 1.303 3.71
BEI-M 0.939 1.034 0.441 2.42
WC 0.544 1.952 0.225 16.96
HC 0.042* 1.897 1.071 3.35
MUAC 0.952 0.976 0.445 2.14
FC 0.010* 2.474 1.247 4.95
CC 0.071 0.523 0.258 1.06
WC/ht 0.702 1.139 0.586 2.21
WC/HC 0.004** 2.111 1.262 3.53
*p,0.05; **p,0.01.
BEI-BF, total body fat; BEI-VF, visceral fat; BEI-M, muscle; WC, waist circumference; HC, hip circumference; MUAC, mid-upper arm
Aeberli et al. used skinfold thickness to determine % body fat (28). These currently accepted methods for defining and measuring body composition, is not definitely determined. Impractical methods that measure the circumferences of two different anatomic areas and divide the circumferences, such as WC/HC, are time consuming in daily medical practice. Although BEI-VF, HC, and WC/HC are currently accepted measurements for predicting MetS, we found that FC is powerfully associated with MetS, particularly in an obese population. Based on these conclusions, different anthropometric and body composition measurements are associated with MetS, particularly in an obese population.
The accuracy of anthropometric measurements and body composition as predictors of MetS were compared using the plots of ROC curves (Figures 1-2). The AUCs of different anthropometric measurements were in a somewhat similar range, with the exception of CC. This result is in accordance with two prospective studies showing that WC and WC/ht performed equally well in their ability to predict type 2 diabetes in Pima Indians (21,25). Hsieh et al. found that WC/ht was a practical and simple anthropometric measure-ment for identifying subjects of both genders with higher metabolic risk (29). In a multiethnic study, WC/ht was the most predictive measure of type 2 diabetes, followed by BMI, although central measurements appeared to predict type 2 diabetes in an African American group (18). He et al. found that WC/ht was useful for screening MetS in Chinese women, particularly those older than 70 years (30). This close association between WC/ht and MetS might be explained by the inverse relationship between height and coronary heart disease in middle-aged men, which was independent of BMI and WC/HC (31). Bosy-Westphal et al. associated WC/ht with MetS and related their results to WC as a risk factor and height as a protective factor that compensates for body composition (supposing that fat-free mass or muscle mass was reflected by height) (23).
In subjects with MetS, as BEI-BF increases, WC/HC decreases. This result is supported by the results of a study showing that WC is strongly correlated with visceral fat tissue and subcutaneous fat accumulation (17). Although WC/HC is the index that is most frequently used to report the regional distribution of body fat, in epidemiological studies, it is important to be cautious when using WC/HC as an indicator of visceral fat accumulation because of its inability to assess changes in visceral fat quantity during weight loss or gain (32).
WC increases as BEI-BF increases and reflects BEI-BF moderately only in subjects without MetS. Furthermore, the other anthropometric measurements were correlated with BEI-BF with different degrees of FC and WC/HC.
HC had a moderately positive correlation with BEI-VF only in the subjects without MetS, whereas all other anthropometric measurements were positively correlated with BEI-VF in subjects with and without MetS. The positive correlation of HC with BEI-VF could be explained by the protective effect that a wider HC has on high VF levels in subjects without MetS. HC could overcome the negative metabolic effects of VF.
BEI-M had a weak correlation with WC and FC only in the subjects with MetS, while CC was negatively correlated with BEI-M in the subjects without MetS. At a given WC, the mortality rate ratio decreased as BMI increased. This decrease was noteworthy at lower WCs and was weaker at higher WCs. WC was only weakly reflected by BEI-M,
which could be explained by the protective effect of a high BMI, which may be caused by a higher absolute amount of lean body mass in relation to visceral adipose tissue, as reflected by WC.
In conclusion, as an unusual anthropometric measure-ment, FC was associated with MetS, BEI-VF, HC, and WC/ HC in obese and overweight subjects.
This study has some limitations. First, a larger sample size would result in more significant and meaningful findings, particularly in regard to other unusual anthropometric measurements. Second, methods other than bioelectrical impedance analysis should be used to assess body composi-tion. Despite the inaccuracies of impedance measurements, some studies have used them to evaluate body composition (21,25).
& AUTHOR CONTRIBUTIONS
Sagun G assisted with the study design, collected and analyzed the data, and wrote the manuscript. Oguz A assisted with the study design. Karagoz E, Filizer AT, Tamer G, and Mesci B collected the data. Mesci B analyzed the data.
& REFERENCES
1. Reaven GM. Banting lecture 1988. Role of insulin resistance in human disease. Diabetes. 1988;37(12):1595-607.
2. Grundy SM, Cleeman JI, Daniels SR, Donato KA, Eckel RH, Franklin BA, et al. Diagnosis and management of the metabolic syndrome: an American Heart Association/National Heart, Lung, and Blood Institute Scientific Statement. Circulation. 2005;112(17):2735-52, http://dx.doi. org/10.1161/CIRCULATIONAHA.105.169404.
3. Alberti KG, Zimmet P, Shaw J. IDF Epidemiology Task Force Consensus Group. The metabolic syndrome–a new worldwide definition. Lancet. 2005;366(9491):1059-62, http://dx.doi.org/10.1016/S0140-6736(05)67402-8.
4. Bergman RN, Kim SP, Catalano KJ, Hsu IR, Chiu JD, Kabir M, et al. Why visceral fat is bad: mechanisms of the metabolic syndrome. Obesity (Silver Spring). 2006;Suppl 1:16S-19S, http://dx.doi.org/10.1038/oby. 2006.277.
5. Tremblay AJ, Despre´s JP, Piche´ ME, Nadeau A, Bergeron J, Alme´ras N, et al. Associations between the fatty acid content of triglyceride, visceral adipose tissue accumulation, and components of the insulin resistance syndrome. Metabolism. 2004;53(3):310-7, http://dx.doi.org/10.1016/j. metabol.2003.10.011.
6. Despre´s JP, Couillard C, Gagnon J, Bergeron J, Leon AS, Rao DC, et al. Race, visceral adipose tissue, plasma lipids, and lipoprotein lipase activity in men and women: the Health, Risk Factors, Exercise Training, and Genetics (HERITAGE) family study. Arterioscler Thromb Vasc Biol. 2000;20(8):1932-38, http://dx.doi.org/10.1161/01.ATV.20.8.1932. 7. Misra A, Wasir JS, Vikram NK. Waist circumference criteria for the
diagnosis of abdominal obesity are not applicable uniformly to all populations and ethnic groups. Nutrition. 2005;21(9):1969-76. 8. Meisinger C, Do¨ring A, Thorand B, Heier M, Lo¨wel H. Body fat
distribution and risk of type 2 diabetes in the general population: are there differences between men and women? The MONICA/KORA Augsburg cohort study. Am J Clin Nutr. 2006;84(3):483-9.
9. Sargeant LA, Bennett FI, Forrester TE, Cooper RS, Wilks RJ. Predicting incident diabetes in Jamaica: the role of anthropometry. Obes Res. 2002; 10(8):792-8, http://dx.doi.org/10.1038/oby.2002.107.
10. Stevens J, Couper D, Pankow J, Folsom AR, Duncan BB, Nieto FJ. Sensitivity and specificity of anthropometrics for the prediction of diabetes in a biracial cohort. Obes Res. 2001;9(11):696-705, http://dx.doi. org/10.1038/oby.2001.94.
11. Shiwaku K, Anuurad E, Enkhmaa B, Nogi A, Kitajima K, Yamasaki M. Predictive values of anthropometric measurements for multiple meta-bolic disorders in Asian populations. Diabetes Res Clin Pract. 2005;69(1):52-62, http://dx.doi.org/10.1016/j.diabres.2004.11.001. 12. Ross R, Freeman J, Hudson R, Janssen I. Abdominal obesity, muscle
composition, and insulin resistance in premenopausal women. J Clin Endocrinol Metab. 2002;87(11):5044-51, http://dx.doi.org/10.1210/jc. 2002-020570.
14. Pou KM, Massaro JM, Hoffmann U, Vasan RS, Maurovich-Horvat P, Larson MG, et al. Visceral and subcutaneous adipose tissue volumes are cross-sectionally related to markers of inflammation and oxidative stress: the Framingham Heart Study. Circulation. 2007;116(11):1234-41, http:// dx.doi.org/10.1161/CIRCULATIONAHA.107.710509.
15. Tchoukalova YD, Koutsari C, Karpyak MV, Votruba SB, Wendland E, Jensen MD. Subcutaneous adipocyte size and body fat distribution. Am J Clin Nutr. 2008;87(1):56-63.
16. Krotkiewski M, Bjo¨rntorp P, Sjo¨stro¨m L, Smith U. Impact of obesity on metabolism in men and women. Importance of regional adipose tissue distribution. J Clin Invest. 1983;72(3):1150-62, http://dx.doi.org/10. 1172/JCI111040.
17. Fox CS, Massaro JM, Hoffmann U, Pou KM, Maurovich-Horvat P, Liu CY, et al. Abdominal visceral and subcutaneous adipose tissue compartments: association with metabolic risk factors in the Framingham Heart Study. Circulation. 2007;116(1):39-48, http://dx.doi. org/10.1161/CIRCULATIONAHA.106.675355.
18. MacKay MF, Haffner SM, Wagenknecht LE, D’Agostino RB Jr, Hanley AJ. Prediction of type 2 diabetes using alternate anthropometric measures in a multi-ethnic cohort: the insulin resistance atherosclerosis study. Diabetes Care. 2009;32(5):956-8, http://dx.doi.org/10.2337/dc08-1663.
19. Pischon T, Boeing H, Hoffmann K, Bergmann M, Schulze MB, Overvad K, et al. General and abdominal adiposity and risk of death in Europe. N Engl J Med. 2008;359(20):2105-21.
20. Matthews DR, Hosker JP, Rudenski AS, Naylor BA, Treacher DF, Turner RC. Homeostasis model assessment: insulin resistance and beta-cell function from fasting plasma glucose and insulin concentrations in man. Diabetologia. 1985;28(7):412-9, http://dx.doi.org/10.1007/BF00280883. 21. Tulloch-Reid MK, Williams DE, Looker HC, Hanson RL, Knowler WC.
Do measures of body fat distribution provide information on the risk of type 2 diabetes in addition to measures of general obesity? Comparison of anthropometric predictors of type 2 diabetes in Pima Indians. Diabetes Care. 2003;26(9):2556-61, http://dx.doi.org/10.2337/diacare.26.9.2556. 22. Wei M, Gaskill SP, Haffner SM, Stern MP. Waist circumference as the best
predictor of noninsulin dependent diabetes mellitus (NIDDM) compared to body mass index, waist/hip ratio and other anthropometric measurements
in Mexican Americans–a 7-year prospective study. Obes Res. 1997;5(1):16-23, http://dx.doi.org/10.1002/j.1550-8528.1997.tb00278.x.
23. Bosy-Westphal A, Geisler C, Onur S, Korth O, Selberg O, Schrezenmeir J. Value of body fat mass vs anthropometric obesity indices in the assessment of metabolic risk factors. Int J Obes (Lond). 2006;30(3):475-83. 24. Yavari R, McEntee E, McEntee M, Brines M. Anthropometric variables accurately predict dual energy x-ray absorptiometric-derived body composition and can be used to screen for diabetes. PLoS One. 2011; 6(9):e24017, http://dx.doi.org/10.1371/journal.pone.0024017.
25. Warne DK, Charles MA, Hanson RL, Jacobsson LT, McCance DR, Knowler WC. Comparison of body size measurements as predictors of NIDDM in Pima Indians. Diabetes Care. 1995;18(4):435-9, http://dx.doi. org/10.2337/diacare.18.4.435.
26. Caprio S, Hyman LD, McCarthy S, Lange R, Bronson M, Tamborlane WV. Fat distribution and cardiovascular risk factors in obese adolescent girls: importance of the intraabdominal fat depot. Am J Clin Nutr. 1996; 64(1):12-7.
27. Mueller WH, Wear ML, Hanis CL, Emerson JB, Barton SA, Hewett-Emmett D, et al. Which measure of body fat distribution is best for epidemiologic research?Am J Epidemiol. 1991;133(9):858-69.
28. Aeberli I, Gut-Knabenhans I, Kusche-Ammann RS, Molinari L, Zimmermann MB. Waist circumference and waist-to-height ratio percentiles in a nationally representative sample of 6-13 year old children in Switzerland. Swiss Med Wkly. 2011;141:w13227.
29. Hsieh SD, Yoshinaga H, Muto T. Waist-to-height ratio, a simple and practical index for assessing central fat distribution and metabolic risk in Japanese men and women. Int J Obes Relat Metab Disord. 2003; 27(5):610-6, http://dx.doi.org/10.1038/sj.ijo.0802259.
30. He YH, Chen YC, Jiang GX, Huang HE, Li R, Li XY. Evaluation of anthropometric indices for metabolic syndrome in Chinese adults aged 40 years and over. Eur J Nutr. 2012;51(1):81-7.
31. Henriksson KM, Lindblad U, Agren B, Nilsson-Ehle P, Ra˚stam L. Associations between body height, body composition and cholesterol levels in middle-aged men. the coronary risk factor study in southern Sweden (CRISS). Eur J Epidemiol. 2001;17(6):521-6.