ISSN: 1809-4430 (on-line) www.engenhariaagricola.org.br
2 Centro Universitário Moura Lacerda/ Ribeirão Preto – SP, Brasil. 3 Universidade Estadual Paulista/ Jaboticabal - SP, Brasil.
Received in: 1-5-2016
Doi:http://dx.doi.org/10.1590/1809-4430-Eng.Agric.v38n1p88-96/2018
Failure mode and effect analysis (FMEA) in mechanized harvest of sugarcane billets
Murilo A. Voltarelli
1*, Carla S. S. Paixão
2, Cristiano Zerbato
3, Rouverson P. da Silva
3,
Jonathan Gazzola
11*Corresponding author. Universidade Federal de São Carlos/ Lagoa do Sino, Buri - SP, Brasil. Email: voltarelli@ufscar
KEYWORDS
quality control,
flowchart, agricultural
mechanization,
PDCA, Harvester.
ABSTRACT
The quality control is used for the evaluation of processes and products, and it is
important to detect and reduce variability and in operations management can be applied in
mechanized harvesting of sugarcane billets. In this sense, this study aimed to identify
critical quality indicators and, if necessary, to develop a continuous improvement plan for
harvest of sugarcane billets. For the survey and definition of critical quality indicators the
FMEA (Failure Mode and Effect Analysis) was applied, after the formation of the quality
technical team. Evaluations of the collected variables were through control charts of
individual values and the process capability indexes. There are 8 critical quality indicators
in the billets harvesting process; the cutting height, the damage index, the percentage of
non-viable buds and operating speed have greater importance for analysis due to the risk
priority index and the easiness of obtaining data for analysis. The development of the
improvement plan aims to reduce the variability due to crop billets, thus, making it able to
perform the operation within the required quality standards.
INTRODUCTION
In the current scenario of the sugarcane sector, the use of machines for the sugarcane cutting in stalks, with the purpose of using them in the mechanized planting, has become an usual practice because the machine that carries out the planting require the fractionation of the stalks and the labor laws in force do not allow manual cutting. According to Voltarelli et al. (2013), the use of mechanization in the mechanized planting system (all operations involving from the billets harvest, the transportation and the loading stages) of sugarcane has become irreversible over the years, due to the use of machines to harvest chopped billets, which can perform the operation with a high level of quality, which favors the initial development of the crop.
In this sense, increasing the quality of the sugarcane billets harvest becomes fundamental to guarantee greater longevity and productivity to the sugarcane plantations, after the cutting of the billets and subsequent planting, over the years, and it is essential to identify the critical factors that affect the operation, as a way to monitor them or to eliminate their influence during the process (Kumar
& Singh, 2012) through the use of quality control methods (Barros & Milan, 2010).
According to Laurenti et al. (2012), the Failure Mode and Effect Analysis (FMEA) is a tool that seeks to avoid, through the analysis of potential failures (identification of critical production factors) and proposals for improvement actions that irregularities occur in the design of a product or in a particular process. The failure mode and effect analysis aims at detecting and eliminating potential problems in a systematic and complete way, its main objective is to identify and prioritize critical failures, pointing out the potential risk of each one and assisting in the elaboration of an action plan to block potential detected failures (Frank et al., 2014).
Therefore, assuming that the quality of the sugarcane billets harvest operation is influenced by external factors and may compromise the quality of other future operations, the aim of this study was to identify the critical quality indicators by the analysis method of failures mode and effect and, if it is necessary, to develop a continuous improvement plan for the sugarcane billets harvest process.
MATERIAL AND METHODS
The experiment was carried out in an agricultural area of a sugarcane mill in the region of the Triângulo Mineiro - MG, Brazil, near the geodesic coordinates: latitude 20º01’ S and longitude 48º56’ W, with average altitude of 516 meters. The average slope of the agricultural areas of the production unit, where the billets were harvested, is around 2 to 5%, and the predominant climate is Aw, according to Köeppen classification.
The mechanized harvest of the billets was evaluated in March 2014, in which the samplings were standardized in nurseries of first-cut billets. The mill work shifts were divided in three throughout the day, each of which was formed by a new staff to carry out the work. The staffs, for all shifts, were formed in ascending order of hierarchy, as follows: operators, field leader, coordinators, supervisors, agricultural manager and chief executive officer. The operators and field leader varied depending on the shift. The variety harvested during the experimental period was RB85-5453.
The number of harvesters destined to harvest the sugarcane billets was 12, all of them were adequate to harvest a planting row with a spacing of 1.50 m. These harvesters had a time interval of use between 1 and 4 years, with different amounts of hour-lift (harvesting sugarcane) worked. The machines used had the following technical characteristics: engine 6090T PowerTech (Tier III), with 9.0 liters, of 251 kW (342 hp), being equipped with the FieldCruise system, of rotation control of the engine and mats wheels with gauge of 1.88 m. These harvesters did not have the automatic pilot system and billet kit during the operation, and it worked in an average speed range of 2.5-3.0 km h-1 during the harvest. All the
machines involved in the billet harvest were considered for the analysis of this process.
For the development of the work, a staff of 10 employees of the company was formed, being called the technical staff of quality. This staff consisted of two operators, two field leaders and two area coordinators (Agricultural Technicians), who work in the day and night shifts, three supervisors (Agronomists), who work in the agricultural and administrative area and an executive director (working only in the administrative part, being also an Agronomist). After the formation of the work staff, the analysis of the billets harvest process was divided into stages, which are:
Stage 1 - Definition of critical quality indicators,
consisting of five phases. The stage begins with the characterization of the production process and the billet harvest process, through the elaboration of the flow chart (Phase 1) and the identification of the customer-supplier-product relationship (Phase 2), based on the methodology
of Bressan (2013), in relation to logistics operations. This author describes that clients are defined by making use of a product. Such product can be described and generated by the production process, being directed to the customer's needs and, finally, the suppliers are the ones who designate some favorable factor to the customers. The possible failures that could occur during the harvest process (Phase 3) were determined using the brainstorming technique in which all participants in a staff have the opportunity to contribute with their ideas freely (Barros & Milan, 2010). After the presentation of opinions to improve the quality of the process, or to prevent it from not meeting the specific standards or limits established, the critical quality indicators of the sugarcane billets harvest that must be monitored and disposed immediately were identified.
Subsequently, critical failure potentials (Phase 4) were determined using the failure mode and effect analysis, making use of a questionnaire listed with the quality indicators previously selected (Phase 3). Taking into consideration the easiness of potentials failure detection (easy or not to be detected), the frequency with which the failure occurs (occurring very or very little) and, finally, its severity in the process (depicting how much failure is harmful). Then, the trend (numerical value that most repeats) of the detection criteria (scores), occurrence and severity of all failure potentials was calculated using a score scale of 1 to 5, established by Likert, according to Stamatis (2003).
Based on the trends of the assigned scores, a risk priority index (RPI) was calculated and agreed with the quality technical staff, using two criteria for its definition: the first was through the Risk Priority Index score attributed to the main critical failures. All failures with RPI values above 27 were considered to be susceptible to be analyzed (Barros & Milan, 2010; Matos & Milan, 2009), being considered as a moderate factor through the multiplication of the grades related to severity, occurrence and detection as an analysis parameter (score value 3); the second criterion, characteristics of obtaining, was to take into account the number of samples, the availability of labor of the company, the cost and the time necessary to obtain the data (Barros & Milan, 2010; Matos & Milan, 2009). Based on the two criteria, scores and characteristics, the critical indicators of the mechanized harvest process of sugarcane billets (Phase 5) were defined.
Stage 2 - It consists of the evaluation of the critical
Flowchart of sugarcane billets harvest process (1)
Identification of customer and supplier operation (2)
Analysis of possible failures during harvesting
(3)
Determination of failure rates (4)
Definition of critical quality indicators (5)
Stage 1
•Training of the technical staff
•Data collect
•Data analysis
• Quality control
•Set Goals
•Methodology to evaluate the process
to reach the goal
•Elaboration of the improvement plan
Act Plan
Execute Verify
Stage 2
FIGURE 1. Stages of the execution of failure mode and effect analysis.
Stage 3 - If the stage 2 indicates an unstable
process or does not meet the standards established by the production unit, through the control charts, the stage 3 begins, in the evaluation and the insertion of improvements. This stage was also based on the PDCA cycle and had as its aim (to plan) to reduce the causes of instability of quality indicators, through the actions proposed in the improvement plan, elaborated in Stage 2. These actions are carried out and analyzed. In case the process is still considered unpredictable, another plan is proposed (acting), aiming at the continuous improvement of the operation, for the goals to be reached according to or
close to the values demanded by the managers of the sugarcane billets harvest.
RESULTS AND DISCUSSION
STAGE – 1 – Phases 1 and 2: Flowchart analysis and interpretation
In Figure 2, the flowchart of the mechanized sugarcane billets harvest, prepared by the quality technical staff, can be evidenced, representing the operational sequence of the development of this process.
Mill
Harvester
Harvest
Planting area Trator-overflow
Billets Maintenance
(1)
(2)
(4)
(3) (6)
(5)
(7)
Start
End
D e c i s i o n
Preparation of the machines
Predefined process
Predefined process Process
Process Process
Preparation Flow
Transport / handling
After the machines are in the field (pre-defined by the managers) where the billets were harvested (4), the consequence of this operation generates a product, which are the stems sorted by the machine, that is, the billets (5) ready for planting (7) and are deposited in the tractor- overflow set, arriving at the final stage of the harvest process. In the sequence, after leaving the tractor-overflow set of the harvested area to the planting area (pre-defined) this process was called transport/handling. The harvester and its maintenance staff have no direct connection with the planting area, and this linkage also does not exist between the harvester maintenance staff in relation to the planting area. Finally, the executions of these operations do not affect each other during the harvest process.
The maintenance staff (6), the harvester (2), the tractor-overflow set (3) and the planting area (7) are directly connected to one another, since if there is a need for any corrective maintenance, for example in the harvester or in the tractor-overflow, and this is not carried out instantaneously, the efficiency of the harvesting process becomes ineffective, since the billets did not reach the planting area. Therefore, any preventive maintenance, as a way to avoid corrective maintenance, must be carried out with rigor to avoid stagnating the operation process. In affirmation to the result of this study, Silva et al. (2013) report that the maintenance, both preventive and corrective, should be carried out on machines, especially in harvesters, to increase their efficiency of times, to have the optimization of the harvest.
For the sugarcane billets (5) constituted by the fractionated stalks, when analyzed as a product, the quantity of viable buds in these stalks must be as large as possible, so that the budding occurs within the established standards. The factors that affect its viability are describe as: working speed of the harvester, variety, wear of the basal cutting knives, wear of the chopping knife, deterioration of the billets and the impacts that the billets
suffer in the transport. After the detection of variation sources, the harvest (4), the harvester (2) and the tractor-overflow set (3) are customers of the billets, and its main supplier is the planning and monitoring of the harvest process.
Finally, harvest (4) is considered as the product of the process, and can be influenced by the shifts, the operators, the wear of the active organs of the harvester, the deterioration of the billets, the distance between the harvested area and the planting area, the working speed of the harvester, the synchronization between the harvester and the tractor-overflow set, among others. Based on the factors that affect the billets harvest, the billets operations can be described by the harvester (2), tractor-overflow set (3), maintenance (6) and planting area (7), resulting in its main supplier, being determined by the planning and the logistics of the process of sugarcane billets harvest.
Phases 3, 4 and 5 - Determination of critical quality indicators
After the definition of the stages of the mechanized sugarcane billets harvest process, the suppliers, the products and the customers of the operation were also determined, thus resulting in the potential indicators of failures that may occur during the harvest process, due to the brainstorming carried out. Therefore, in the billets harvest process, 21 possible quality indicators of failure occurred, and phase 3 was finished (Table 4). Following, taking into account the scores on severity, occurrence and detection, the risk priority index (RPI) is obtained for each potential of failure, within the processes of sugarcane billets harvest, in descending order (Phase 4). Phase 4 was defined for this study as the moment of elaboration of the RPI, but it has a relation with Phase 3 to be calculated.
TABLE 4. Score scales for quality indicators of the process of mechanized sugarcane billets harvest.
Process Potential of failure Dt* Oc Sv
Billets harvest
Number of not viable buds per stalks 3 4 5
Night shift 3 4 4
Losses 3 3 4
Conveyor belt harvester 2 3 3
Sugarcane field size 1 3 4
Ground slope 1 3 4
Variety used 2 2 4
Number of not viable buds by stem 2 3 3
Type of soil preparation used 1 3 4
Knives without coating 1 3 3
Wheel sliding harvesters 1 3 3
Operator 2 2 3
Day shift 2 3 2
Billet length after cutting 1 2 3
Cutting height 4 4 5
Damage to the ratoon 3 5 4
Cutting knives wear 3 4 4
Shock to the ratoon 1 3 4
Distance from the billets to planting 2 4 4
Impact of the billets on the overflow 3 3 4
Deterioration of the billets 2 3 4
According to Tanik (2010), the use of the Failure Mode and Effect Analysis (FMEA) method is essential to raise critical quality indicators in certain processes, and their use has a potential gain when it is carried out in association with the quality deployment function (QDF). However, by associating this fact to this study, we can note the difference among the analyzes, since, for this study, only potential failures were raised, not the incorporation of
improvements or technological innovation in the design of the machine that develops the operation.
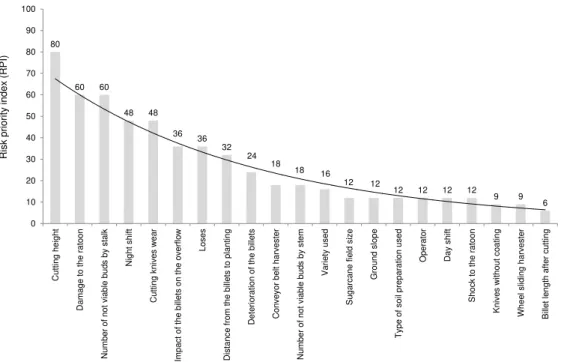
Considering only the failure potentials with RPI above 27, according to the score scale, they were totaled in eight, and four failures are related to the billet harvest process, two associated to the basal cut and two interrelated to the transport/logistics process (Figure 3).
80 60 60 48 48 36 36 32 24 18 18 16 12 12
12 12 12 12
9 9 6 0 10 20 30 40 50 60 70 80 90 100 Cut ti n g h e igh t Damag e t o t h e ra to o n Numbe r o f n o t via b le b u d s b y st a lk Ni g h t sh ift Cut ti n g kn ive s we a r Imp a ct o f t h e b illet s o n th e o ve rfl o w L o se s Di sta n ce f rom t h e b ille ts to p lan tin g D et e rio ra tion of t he bill e ts C on veyo r b elt h arveste r Numbe r o f n o t via b le b u d s b y st e m V a rie ty u se d S u g a rcan e f ie ld size Gro u n d sl o p e Typ e o f so il p rep a ratio n u se d Op e rato r Day sh ift S h o ck t o t h e ra to o n K n ive s with o u t co a tin g W h e e l sli d in g h a rvest e r B illet le n g th a ft e r cu tt ing R is k priorit y index (R PI )
FIGURE 3. Risk priority index for quality indicators of the mechanical harvesting process of sugarcane billets.
On the other hand, analyzing the knives wear, which results in the loss of sharpening (when no knives are coated in the first working hours), the contact of the knives with the ground is associated, and it can cause wear or breakage by the intense contact with the raw material, soil type texture, factors that influence when the knife will lose the sharpening, among others. In order to finalize the failure potentials of the billets harvest, there is the night shift, which is affected by the absence of sunlight, which causes greater difficulties for the control of the harvester and its synchronism with the tractor-overflow set, mainly in the absence of the automatic steering system (autopilot).
Cutting height and damage caused to sugarcane ratoon are potential failures related to the basal cutting of the machine, being influenced by the ground slope, preparation of the land with irregularities, lack of experience of the operator in the use of the machine, failure of the automatic height controller (soil copier), wear of the basal cutting knives and the high working speed. According to Noronha et al. (2011), the cutting height in the mechanized sugarcane harvest during the harvest did not present as a critical quality indicator, however, the damage rate to the ratoons resulted in a high potential for the analysis and monitoring of the process, to avoid possible failures in the sugarcane regrown. This result coincides, in part, with the priority indexes of risk in this study, the cutting height and damage index to the ratoons were considered as critical quality indicators for billets harvesting.
STAGE 2
After the definition of the critical quality indicators, together with the quality staff of the production unit, they were considered as potential failures during the billet harvest process due to the RPI (cutting height, damage to the ratoons and the number of buds not viable by stalk). In this sense, it becomes possible to implement a management plan for the improvement of quality in this productive process, whose final product is the billets. Based on this, a control plan was drawn up using the PDCA cycle, following step by step its phases and concepts to implement a management plan for monitoring and improving the quality of this agricultural process. The following phases were:
Phase 1: Plan (P) - The planning was carried out
for the billets harvest process, defining the methodologies and goals to be used to evaluate each quality indicator:
- cutting height was delimited to a sample area through the square frame of 0.25 m2, disposed randomly in
the harvested lines, right after the passage of the machine according to Toledo et al. (2013). For this study, this indicator was considered as unstable by the technical staff, if there were 20% of the samples above the upper control limit (UCL);
the stems delimited within the frame were counted and classified according to a proposal described by Toledo et al. (2013). The process is considered unstable by the work staff, if 15% of the samples reached the 1.00 level of damage to the ratoons (fragmented damages);
The number of buds by stalks was measured using the methodology proposed by Robotham & Chappell (2002), by the direct and visual analysis of the damaged buds in the fractionated stalks. This quality indicator was considered as unstable by the work staff, if 20% of the samples reached 100% of the damage buds.
Based on the methodology described for analysis, the quality technical staff established, for each critical indicator of the process, the specifications limits or quality standards of the producing unit (Table 2):
TABLE 2. Specification limits used for process analysis. Quality indicators LSL* Goal USL
Cutting height (mm) 0 50 100
Damage to the ratoon 0.00 0.50 0.66
Unviable buds (%) 5.0 15 25
*LSL – Lower specific limit; USL – Upper specific limit.
Phase 2: Do (D) - The technical staff was trained, the theoretical and practical part of the evaluations was presented, and the responsible for data collection and tabulation was defined. For all evaluations of quality
indicators, a single person carried out all the samplings, for greater control of the experimental conditions. After choosing the evaluator, the number of samples to be collected for each critical quality indicator was defined, and for the cutting height and damage index, 100 samples were collected over two working days, 50 samples per day. For the quantification of the number of unviable buds, 300 stalks were collected, which were subsequently analyzed visually, counting the unviable buds, within the same evaluation period described above.
Phase 3: Check (C) - to verify the data collected, we used statistical process control tools, which are described by the individual charts, which monitor the process over time. In addition, the process capacity analysis (Cpk, Cp, Pp and Cpm) was carried out to detect whether it meets the standards established throughout the operation, when the process was considered stable (Liu et al., 2013).
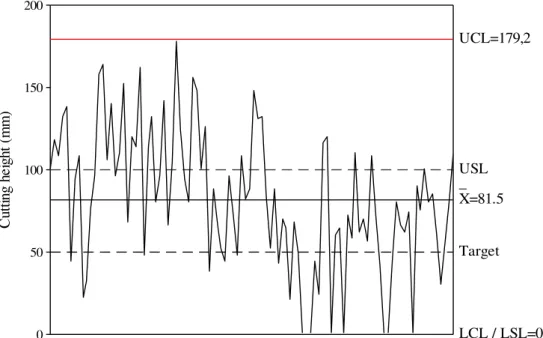
The cutting height quality indicator was stable throughout the monitored process, with all points between the lower and upper control limits. The stability of the process shows that, during the sugarcane billets harvest, for this indicator, there was only influence of random causes, which do not affect the quality of the operation (Figure 4).
200
150
100
50
0
C
ut
tin
g
he
ig
ht
(
m
m
)
_ X=81.5 UCL=179,2
LCL / LSL=0 Target USL
FIGURE 4. Control chart for the cutting height quality indicator. LCL: lower control limit; UCL upper control limit.
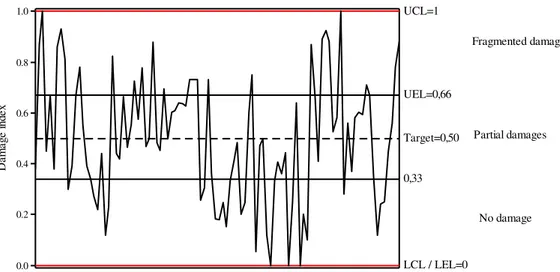
The index of damage to the ratoons presented 28% of the samples in the classification of fragmented damages, or above the upper specific limit, representing the stability of the process for the index proposed in the methodology for this analysis (Figure 5). 26 and 46% of the damage index in the classification range were found without damage and partial damages, respectively.
1.0
0.8
0.6
0.4
0.2
0.0
D
am
ag
e
in
de
x
UCL=1
LCL / LEL=0 0,33 Target=0,50 UEL=0,66
No damage Partial damages Fragmented damages
FIGURE 5. Control chart for damage index to the ratoons. LCL: lower control limit; UCL upper control limit.
Cassia et al. (2014) evaluated the mechanism of basal cutting in the mechanized sugarcane harvest and reported the occurrence of high variability of the damage index to the ratoons, not reaching the predetermined specific limits, although the process is considered stable. This result resembles to this study, since part of the sample
values reached the established specifications, which, to a certain extent, may be acceptable for the operation.
The percentage of unviable buds presented 15% of the samples reaching the maximum value of unviability (100%), being considered stable and, therefore, within the quality standards required by the producing unit (Figure 6).
100
80
60
40
20
0
%
o
f
in
vi
ab
le
b
ud
s
_ X=31.8
LCL=0 UEL
Target UCL=100
LEL
FIGURE 6. Control chart for percentage of unviable buds. LCL: lower control limit; UCL upper control limit.
The greater amounts of values are allocated above the USL and the rest are below the LSL, a situation that portrays the impossibility of this quality indicator to reach its established goal. The average value of the unviable buds in the billet harvest (31.8%) represents the loss of buds viability in the process of cutting, feeding, cleaning and unloading the billets in the transport performed by the machine. However, of this value, the improper buds were not discounted due to climatic factors and diseases, before they passed through the processing inside the harvester.
For the cutting height and damage index to ratoons and percentage of unviable buds, the process is not centered on the established goal (Cpk <1.33) and also because of the distance of the Cpk and Cp indexes, being considered as incapable of reaching the short-term goal
(Cp <1.33) and long-term (Pp <1.33), according to Bonilla's classification (1994) (Table 3).
TABLE 3. Capability index of critical quality indicators.
Process indexes* Cutting height
Damage indexes
(%) Unviable buds
Cpk 0.19 0.29 -0.02
Cp 0.51 0.59 0.10
Pp 0.39 0.45 0.09
Cpm 0.31 0.22 0.09
Classification** Unable Unable
However, for all the quality indicators when comparing the proximity of the Cpm value with the Cp and Cpk values, being all smaller and far from 1.33, it is characterized the distance of the average value obtained in relation to the specified goal, due to the variability of the samples that exist between the specification limits and the process goal value. The cutting height, the damage index and the percentage of viable buds presented stability of the evaluated process, when it is rigorously analyzed its capacity to keep within the specifications, these do not meet this requirement and, therefore, they can be considered unacceptable due to the quality standards established by the producing unit.
Campos et al. (2008), when evaluating the monitoring of a mechanized agricultural operation in sugarcane, reported that quality indicators were unstable by control charts. However, a decision was made to evaluate the capacity of the process to verify the service of the operation to the specified limits, which resulted in non-compliance with the required quality standards, and the process was classified as incapable. When comparing this result to this study, the same behavior of the process is verified, being considered as unable of meeting the specifications, regardless of the condition of the control chart, making feasible the search to reduce the variability of the operation until the process meets the specific quality limits.
Phase 4: - Action (A) - For the percentage of
unviable buds (number of unviable buds) the monitoring was recommended throughout the harvest, due to the stability of the process presented by the control charts, as it meets the acceptable standards. On the other hand, the elaboration of an improvement plan and the search of the external variations sources, for the cutting height and damage index to the ratoons, becomes fundamental to increase the harvest operation quality of sugarcane to meet
the limits and goals established by the technical staff of the producing unit and, consequently, present adequate process capability indexes. These indexes are factors of greater importance for the elaboration of the improvement plan when they are calculated, since they complement the control charts and a stable process does not show if it is meeting the limits and goals established for the process under analysis.
Since the process was stable, the improvement plan was developed by monitoring and seeking sources of random variation during the process, which are more difficult to diagnose, analyze and eliminate from the operation. Therefore, the search for these random causes can be carried out carefully by the technical staff, and it is pertinent to evaluate the cost-benefit ratio of these analyzes and, if it is necessary to re-adjust the goals for their potential service.
STAGE 3
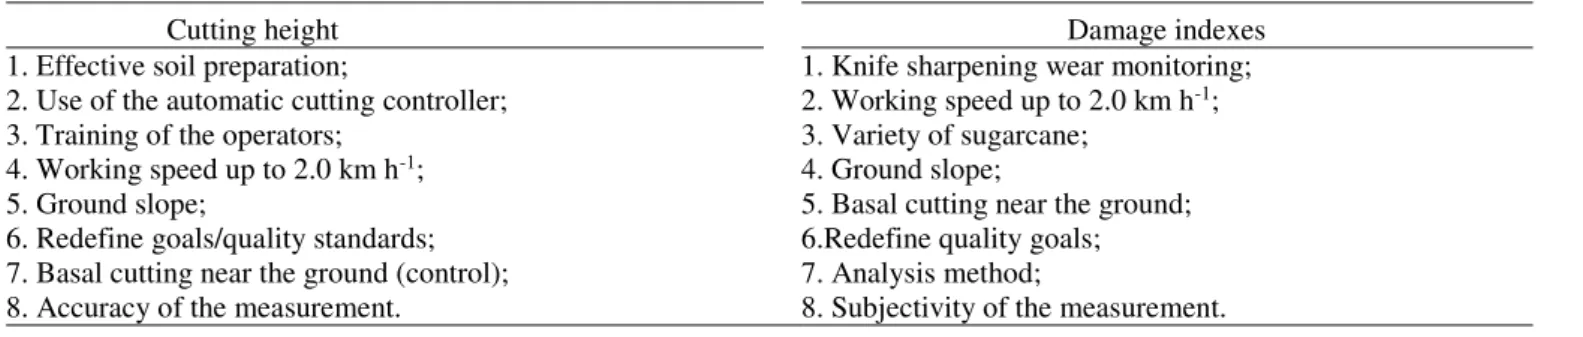
Based on phase 4 (Stage 2) it is possible to carry out an investigation of the variation causes that affect the limits established or calculated during the process. An improvement plan was developed for the analysis and detection of special causes (Table 4).The preparation of the soil performed with quality, leaving it as uniform as possible (method factor), avoids the oscillation in the sugarcane harvester displacement at the harvest time, and this condition, associated to the use of the automatic height control (machine factor), machine control by the operator (labor factor), adequate working speed (machine factor in association with labor) and the measurement method (standardization of how to carry out the data collection through training of the collection team) are points that must be monitored for the improvement of the harvest process, due to the cutting height quality indicator.
TABLE 4. Improvement plan for mechanized harvest of sugarcane billets.
Cutting height Damage indexes
1. Effective soil preparation; 1. Knife sharpening wear monitoring; 2. Use of the automatic cutting controller; 2. Working speed up to 2.0 km h-1;
3. Training of the operators; 3. Variety of sugarcane; 4. Working speed up to 2.0 km h-1; 4. Ground slope;
5. Ground slope; 5. Basal cutting near the ground;
6. Redefine goals/quality standards; 6.Redefine quality goals; 7. Basal cutting near the ground (control); 7. Analysis method;
8. Accuracy of the measurement. 8. Subjectivity of the measurement. % Unviable buds
1. Use the billets kit (rubber); 2. Pre-harvest cultural treatment; 3. Knife sharpening wear;
4. Variety suitable for mechanized harvest;
5. Subjectivity of measurement and method of analysis.
On the other hand, the damage index can be improved by the appropriate working speed and the monitoring of the knives wear of the basal cutting (machine and labor factor, respectively). Finally, the method factor is related to the way in which this quality indicator was evaluated, and the measurement factor, of how it was quantified (visual analysis), so that the evaluation standardization and training staff are constant
and there are no variations in field data collection, since this evaluation is subjective for each evaluator.
(machine labor and material factors), variety directed to the billets production (raw material factor) and, finally, to the method and measurement of the analysis of this quality indicator, in which subjectivity is intrinsic to the evaluator (labor factor associated with the method and measurement factors) so that the best result can be quantified and later interpreted with reliability.
CONCLUSIONS
There are a total of 8 critical quality indicators in the mechanized harvest process of sugarcane billets, and the cutting height, damage index and percentage of unviable buds are more important due to the higher values of the risk priority index.
The elaboration of the improvement plan aims to reduce the variability resulting from mechanized billet harvest, in order to make the process within the established and/or calculated limits so that it can perform its operation within the standards of quality over time.
The need to carry out new evaluations and to implement automation in the collection of samples and improvements to the process, must be carefully analyzed by the technical team once the process is stable, thus eliminating random causes are more difficult to occur.
REFERENCES
Albiero D, Maciel AJS, Milan M, Mion RL, Viliotti CA (2010) Análise do Modo e Efeito de Falhas (FMEA) no desenvolvimento de semeadora multifuncional conservacionista para a agricultura familiar. INGEPRO 2(11):26-37.
Barros FF, Milan M (2010) Qualidade operacional do plantio de cana-de-açúcar. Bragantia 69(1):221-229. Bonilla JA (1994) Qualidade total na agricultura: fundamentos e aplicações. Belo Horizonte, Centro de Estudos de Qualidade Total na Agricultura, 334p.
Bressan F (2013) Uma equação proposta para fomentar a inovação nas organizações. Estudios Gerenciales 29:26-36. Campos CM, Milan M, Siqueira LFF (2008) Identificação e avaliação de variáveis críticas no processo de produção da cana-de-açúcar. Engenharia Agrícola 28(3):554-564. Cassia MT, Silva RP, Paixão CSS, Bertonha RS, Cavichioli FA (2014) Desgaste das facas de corte basal na qualidade da colheita mecanizada de cana-de-açúcar. Ciência Rural 44(6):987-993.
Frank AG, Pedrini DC, Echeveste ME, Ribeiro JLD (2014) Integração do QFD e da FMEA por meio de uma sistemática para tomada de decisões no processo de desenvolvimento de produtos. Produção 24(2):295-310. Kumar S, Singh BR (2012) Performance feasibility and economic viability of sugarcane planter in western Plane zone of Uttar Pradesh, India. Sugar Tech 14(2):101-108.
Laurenti R, Rozenfeldi H, Franieck EK (2012) Avaliação da aplicação dos métodos FMEA e DRBFM no processo de desenvolvimento de produtos em uma empresa de autopeças. Gestão e Produção 19(4):841-855.
Liu L, Yu M, Ma Y, Tu Y (2013) Economic and economic-statistical designs of an control chart for two-unit series systems with condition-based maintenance. European Journal Of Operation Research 226(3):491-499.
Matos RB, Milan M (2009) Aplicação sistêmica do modo de análise de falhas e efeitos (FMEA) para o desenvolvimento de indicadores de desempenho de empresas de pequeno porte. Revista Árvore 33(5):977-985.
Noronha RHF, Silva RP, Chioderoli CA, Santos EP, Cassia MT (2011) Controle estatístico aplicado ao processo de colheita mecanizada diurna e noturna de cana-de-açúcar. Bragantia 70(4):931-938.
Peloia PR, Milan M, Romanelli TL (2010) Capacity of the mechanical harvesting process of sugarcane billets. Scientia Agricola 67(6):619-623.
Robotham BG, Chappell WJ (2002) High quality planting billets-whole-stalk planter billets compared to billets from modified and unmodified harvesters. Proceedings Australian Society of Sugar Cane Technology 24:199-206.
Silva ML, Conçeição IL, França WA, Lopes LAS (2013) A importância da manutenção em motores diesel. Revista Exatas e Engenharia 3(7):54-61.
Stamatis DH (2003) FMEA: A general overview. In: Stamatis DH. Failure mode and effect analysis: FMEA from theory to execution. Wisconsin, ASQ Quality Press, p21-81.
Tanik M (2010) Improving “order handling” process by
using QFD and FMEA methodologies: a case estudy. International Journal of Quality and Reliability Management 27(4):404-423.
Toledo A, Silva RP, Furlani CEA (2013) Quality of cut and basecutter blade configuration for the mechanized harvest of green sugarcane. Scientia Agricola 70(6):384-389.