Law in Brazil: evidence in large municipalities
Cláudia Ferreira da Cruz
Universidade Federal do Rio de Janeiro / Programa de Pós-Graduação em Ciências Contábeis Rio de Janeiro / RJ — Brazil
Luís Eduardo Afonso
Universidade de São Paulo / Faculdade de Economia, Administração e Contabilidade, Programa de Pós-Graduação em Controladoria e Contabilidade
São Paulo / SP — Brazil
Through a multidimensional perspective of fiscal management, the present study analyses the relationship between the indexes of fiscal compliance and fiscal limits with variables that represent the pillars of planning, transparency and control. The study used primary data from 282 Brazilian municipalities, with more than 100 thousand inha-bitants, in the period between 2010 and 2013. The fiscal indexes did not present relevant mutual relationships and showed a reduced association with the other variables of fiscal management. It is suggested that one of the reasons lies in the difference between the incentives that public managers have to accomplish fiscal targets and limits and to comply with the other pillars. This paper broadens the discussion about responsible fiscal management evaluation, as well as the literature on indexes of compliance with targets and fiscal limits.
Keywords: fiscal responsibility; fiscal indexes; Brazilian municipalities; public finance; public accounting.
Gestão fiscal e pilares da Lei de Responsabilidade Fiscal: evidências em grandes municípios
Sob uma perspectiva multidimensional da gestão fiscal, este trabalho analisa a relação entre indicadores de cumpri-mento de metas e limites fiscais com variáveis representativas dos pilares planejacumpri-mento, transparência e controle. O estudo utilizou dados primários de 282 municípios brasileiros, com população superior a 100 mil habitantes, no período de 2010 a 2013. Os indicadores fiscais não apresentaram relações significativas entre si e relevaram ainda reduzida associação com as demais variáveis representativas da gestão fiscal. Sugere-se que uma das razões esteja na diferença entre os incentivos que os gestores públicos têm para cumprir metas e limites fiscais e para atender os demais pilares. Esta pesquisa amplia a discussão sobre a avaliação da gestão fiscal responsável, além da literatura sobre indicadores de cumprimento de metas e limites fiscais.
Palavras-chave: responsabilidade fiscal; indicadores fiscais; municípios; finanças públicas; contabilidade pública.
Gestión fiscal y pilares de la Ley de Responsabilidad Fiscal: evidencias en los grandes municipios brasileños
Bajo una perspectiva multidimensional de la gestión fiscal, este estudio tiene como objetivo investigar la relación entre indicadores de cumplimiento de metas y límites fiscales con variables que representan planificación, trans-parencia y control. El estudio utilizó datos primarios de 282 municipios brasileños, con más de 100 mil habitantes en el período 2010-2013. Los indicadores fiscales no mostraron relaciones significativas entre ellos y también mostraron una asociación reducida con las otras variables representativas de la gestión fiscal. Se sugiere que una de las razones es la diferencia entre los incentivos que tienen los administradores públicos para cumplir las metas y los límites fiscales y para cumplir con los otros pilares. Esta investigación amplia la discusión sobre evaluación de la gestión fiscal responsable y indicadores de cumplimiento de las metas y límites fiscales.
Palabras clave: responsabilidad fiscal; indicadores fiscales; municipios brasileños; finanzas públicas; contabilidad pública.
DOI: http://dx.doi.org/10.1590/0034-7612165847
Article received on June 27, 2016 and accepted on January 9, 2018.
1. INTRODUCTION
Within legal mechanisms and academic literature, responsible fiscal management is associated with the concepts of planning, control, transparency and accountability. The initiatives for the evaluation of fiscal responsibility in public entities have emphasized parameters related to the fulfillment of fiscal targets and legal limits. However, there is no consensus on how fiscal responsibility in public entities should be assessed.
Hendrick (2004), Dholakia (2005), Leite and Peres (2010) and Cruz and Marques (2017) add that fiscal responsibility evaluation should consider aspects often not covered by legal norms or tra-ditional indicators. Establishing explanatory factors of fiscal responsibility can contribute to finding appropriate evaluation criteria.
Besides identifying adequate parameters to evaluate fiscal management, Hagen and Vabo (2005) indicate that there is a growing interest in the relationship between political and institutional factors and fiscal performance at the national and local levels: Alesina and Perotti (1996), Poterba (1996) and Dafflon (2002).
Leite and Peres (2010) suggest that the Fiscal Responsibility Law (LRF) has brought political, insti-tutional, fiscal and managerial impacts to public entities. After 16 years of the LRF’s implementation, it is pertinent to question how the pillars of fiscal responsibility are being taken into consideration to evaluate the fiscal management in the entities of the federation.
Empirical studies conducted in Brazil (Ortolani, Campello and Matias, 2004; Giuberti, 2005; Calife, 2006; Fioravante, Pinheiro and Vieira, 2006; Gobetti and Klering, 2007; Gerigk, 2008; Cavalcante, 2012; Nascimento e Vicente, 2012) emphasize the use of variables related to the achievement of fiscal targets and limits in the assessment of fiscal responsibility.
Within the scope of responsibility in the fiscal management of Brazilian governmental entities, the Tax Crimes Law only penalizes noncompliance with fiscal targets and limits, without establishing objective punishments for noncompliance with the other pillars of fiscal management.
Studies that take into consideration the dimensions of responsible fiscal management, beyond those regarding meeting targets and limits, can contribute to identify significant relationships or lack of them between those dimensions and raise discussions about the appropriateness of the targets and fiscal limits applicable to subnational entities (Hendrick, 2004).
Afonso (2008), Isen (2014) and Cruz and Marques (2017) consider that the evaluation of fiscal management should not be limited to traditional fiscal targets and suggest a more comprehensive approach that follows the results of budget execution. In turn, Greggianin (2008) and Zhang and Barnett (2014) ponder the possibility of meeting fiscal targets but neglecting other relevant factors, such as: adequate planning, control structure, fiscal transparency, among others.
2. THEORETICAL BACKGROUND
2.1 RESPONSIBILITY IN FISCAL MANAGEMENT
One of the challenges of the studies that evaluate the fiscal situation of public entities is the dif-ficulty in finding adequate theoretical and measurement foundations (Kloha, Weissert and Kleine, 2005; Araújo and Loureiro, 2005; Cruz and Marques, 2017). Many studies use aggregate indicators, often doing so without a consistent theoretical rationale for their use.
In Brazil, the LRF states that planned and transparent action and efficient control mechanisms are necessary conditions for reaching a balance in public accounts. However, overall, studies have considered only the pillar of responsibility in meeting goals and limits. Not only legal instruments but also academic articles on fiscal responsibility refer to the fact that the achievement of goals and limits is conditioned by the existence of a management and control system that prevents risks and corrects deviations that may affect the fiscal balance.
2.1.1 PLANNING
Several studies have indicated that budget institutions have an impact on the results (Gleich, 2003; Alesina et al., 1999; Hagen and Vabo, 2005; Benito and Bastida, 2009; Cruz and Marques, 2017). For these authors, the nature of budgetary procedures influences fiscal performance.
Granted that the public budget is the result of collective decisions, a critical point is that many stakeholders have incentives to expand the budget and create deficits, while others have incentives to internalize public budget constraints. This understanding leads to the study of planning in the public sector from the perspective of budget forecasts.
From the perspective of the accuracy of the forecasts, several studies use the perspective of the accuracy of the budget forecasts in order to compare the numbers defined in the budget proposal with the results verified after the execution of the budget. Some examples are Bretschneider and partners (1989), Mocan and Azad (1995), Vecchia and Montoya (2002), Deschamps (2004) and McNichol (2014).
Maher and Deller (2011) and Vecchia and Montoya (2002) consider that realistic budgets are associated with greater balance in public accounts. These are consistent with the logic of managerial administration, where budget instruments assist decision-making. Bretschneider and partners (1989) found that the political environment and organizational procedures also influence the accuracy of revenue forecasting.
According to Maher and Deller (2011), public managers have incentives to manipulate revenue esti-mates during periods of fiscal pressure, with the purpose of raising taxes or reducing the risk of sanctions in case of fiscal imbalances. The absence of monitoring mechanisms and the lack of defined sanctions represent a disincentive for budgets to be more accurate, especially with regard to revenue forecasting.
2.1.2 TRANSPARENCY
Transparency is one of the principles of public governance. Initiatives seeking to improve mechanisms for transparency in public management are considered good governance practices.
reporting. Since transparency does not depend exclusively on legislation, there may be a discrepancy between what governments are willing to make available in terms of information and what citizens expect.
According to Kopits and Craig (1998), fiscal transparency is the process of publicizing informa-tion about tax structure, fiscal policy, reports and projecinforma-tions. This informainforma-tion should be reliable, clear, complete and timely, and should include all actions taken by the government, in order to allow citizens to evaluate and compare them (Cruz et al., 2012).
In the IMF’s view (2007), fiscal transparency encompasses fiscal management and accountability. Information flows assure that governments have an accurate picture of the fiscal situation and pros-pects. Fiscal transparency also provides legislators and citizens with information to hold governments accountable (Cruz et al., 2015).
In Brazil, debates over the transparency of public management were fostered by the approval of the LRF (Brazil, 2000), which presents as a requirement of transparency of fiscal management the wide dissemination, including in electronic means of public access, of plans and budgets, the Executive’s reports and the Courts of Accounts reports, as well as other reports concerning fiscal management. Additionally, Supplementary Law 131/2009 (Brazil, 2009) detailed the content and deadlines for entities.
Despite the relevance of fiscal transparency for promoting government accountability, Zuccolotto and Teixeira (2014) argue, based on evidence from state governments, that fiscal transparency is still incipient in Brazil.
2.1.3 CONTROL
The institutional controls of public entities in democratic societies are means for making sure that political rulers are responsive to citizens. This process has been called accountability by the academic literature (Arantes et al., 2010).
The need for institutional control mechanisms is justified because voting alone cannot guarantee full control of the rulers, since their evaluation is retrospective (O’Donnell, 1998). This reinforces the need for instruments for monitoring and citizen participation in decisions of a collective nature.
Arantes and partners (2010) also add that the exercise of control over time goes beyond the elections, affects the mandates and is conditioned by the transparency and visibility of acts of public power. Even if it is not enough, transparency is a necessary condition for governmental control. And among the instruments of accountability stand out: legislative control, judicial controls, administrative and financial controls and social control.
The Federal Constitution (Brazil, 1988) specifies that the control of municipalities shall be exer-cised by the Legislative Branch, through external control, and by the internal control systems of the Executive Branch. The constitutional text adds that external control will be exercised with the help of the Courts of Accounts.
Given the objective of the present study, it is accepted that the quality of an internal control system can contribute to the issuance of favorable Courts of Accounts reports, due to the inexistence of evi-dence that indicates improprieties in resource management and compliance with laws and regulations.
3. METHODOLOGY
3.1 CHOICE OF MUNICIPALITIES AND PERIOD OF STUDY
The 283 municipalities considered metropolis or large municipalities compose the sample of this study. They represent 5.1% of the total of municipalities and concentrate 54,8% of the country’s population. Although it is classified as a city with a large population, Brasília was excluded from the study because it did not fit the characteristics common to other Brazilian municipalities.
The period analyzed is from 2010 to 2013. These years were selected due to the greater detailing of the transparency requirements in fiscal management made mandatory by Complementary Law no. 131/2009, which came into effect in 2010. In addition to the legal conditions that define the frequency of submission of fiscal data, in small municipalities there is greater difficulty in accessing data related to budgetary execution, mainly because of the lack of official websites or even outdated websites.
It should be noted that data collection was hampered because of missing values of some of the variables in some of the municipalities during the period analyzed, especially information from pre-vious reports issued by the Courts of Accounts.
3.2 VARIABLES
Given the purposes of the study, the variables considered reflect the responsibility for meeting fiscal targets and limits, the adequacy of the budgeting process of the municipalities from the perspective of the forecast accuracy (planned action), the results of the control mechanisms (Courts of Accounts reports) and transparency in the disclosure of fiscal information.
3.2.1 COMPLIANCE WITH FISCAL TARGETS AND LIMITS
Overall, the indicators related to responsibility in fiscal management were obtained from the quanti-tative criteria proposed in the LRF. For the analysis of the variables related to compliance with fiscal limits, we chose to use the margin concept (Hendrick, 2004). Because of this choice, the index obtained represents the fiscal gap of the municipality in relation to the maximum limit. The variables related to compliance with targets and fiscal limits adopted in the study are as follows:
• Margin related to the limit of Total Expense with personnel (m_dpess)
This variable references article 19, subsection III and article 20, subsection III of the LRF, which establish the limit of 54% of the Net Current Revenue (RCL) for total expenditure on personnel (DTP) within the scope of the municipal Executive Branch. As the concept of margin in relation to the maximum limits was adopted, this variable is given by: m_dpessit = (0.54 - DTPit / RCLit) / 0.54.
• Margin related to the limit of the Net Consolidated Debt (m_dcl)
Net Consolidated Debt (DCL) of the municipalities. As the concept of margin in relation to the maximum limits has been adopted, this variable is given by: m_dclit = (1,2 - DCLit / RCLit) / 1,2.
• Margin related to the limit of Concession of guarantees (m_garant)
This variable references articles 29, subsection IV, article 55, subsection I, and article 40, paragraph 1 of the LRF, as well as article 9 of Federal Senate Resolution nº 40/2001, art. 9, which set the limit of 22% of the Net Current Revenue for the granting of guarantees and counter-guarantees by the municipalities. As the concept of margin in relation to the maximum limits was adopted, this variable is given by: m_garantit = (0,22 - garantit / RCLit) / 0,22.
• Margin related to the limit of internal and external credit operations (m_opcr)
This variable references articles 29, subsection IV and article 30, paragraph 3, of the LRF and article 7, subsection I, of the Federal Senate Resolution no. 43/2001, art. 7, I, which define the limit of 16% of the Net Current Revenue (RCL) for the contracting of credit operations by the municipalities in a fiscal year. As the concept of margin in terms of maximum limits has been adopted, this variable is given by: m_opcrit = (0.16 - opcrit / RCLit) / 0.16.
• Margin related to the limit of Anticipation of the Budget Revenue (m_aro)
This variable references article 29, subsection IV of the LRF Law and and article 10 of Federal Senate Resolution 43/2001, which set the limit of 7% of the Net Current Revenue for the contracting of credit operations using credit from Anticipation of Budget Revenue (ARO) by the municipalities. As the concept of margin in relation to the maximum limits was adopted, this variable is given by: m_aroit = (0,07 - AROit / RCLit) / 0,07.
• Variation in the achievement of the Nominal Result goal (res_nom)
This variable references article 4, paragraph 1, and article 9 of the LRF, which legislate about the definition of the nominal result goal in the Fiscal Targets Annex (AMF) of the Budget Guidelines Law (LDO) of each financial year. As the concept of variation around the goal has been adopted, this variable is given by: res_nomit = (res_nom_apuradoit - meta_res_nomit) / meta_res_nomit.
• Variation in the achievement of the Primary Result goal (res_prim)
This variable references article 4, paragraph 1, and article 9 of the LRF, which legislate about the for the definition of the primary result target in the MFA of the LDO of each financial year. As the concept of variation around the goal has been adopted, this variable is given by: res_primit = (res_prim_apuradoit - meta_res_primit) / meta_res_primit.
• Liquidity to cover unused funds from other fiscal years not yet processed (liq_rpg)
This variable references articles 42 and 55, subsection III of the LRF, which deals with the need for cash availability (disp_cx) for the registration of expenses as “unused funds from other fiscal years to be paid” (rpg). As it is a verification item, we adopted the perspective that cash flow might be compromised with the use of these type of funds. The variable is given by: liq_rpgit = disp_cxit / rpgit.
3.2.2 PLANNING
The variables adopted in the study are based on the classification by economic category and or-igin of the budget revenues and aim at verifying the accuracy of the budget forecasts, given that the fiscal responsibility is fulfilled through planned action. The assumption is that more accurate budget estimates tend to generate more balanced fiscal results.
Variables related to accuracy in revenue planning:
• Accuracy in budget revenue planning (pl_rorcit): this variable aims to verify the accuracy in forecast-ing the total revenue collected by a government entity durforecast-ing a fiscal year. It is calculated on the basis of the ratio between actual budget revenue (ROrcR) and planned budget revenue (ROrcP), according to the following formula: pl_rorcit = ROrcRit / ROrcPit.
• Accuracy in current revenue planning (pl_rcorit): this variable aims to measure accuracy in the forecast of current revenues, which are the main economic category of revenues of municipalities, as well as being the basis for calculating Net Current Revenue, which is defined by the LRF as a parameter to monitor fiscal targets and limits. The variable is given by the ratio of current revenues (RCorR) to current expected revenues (RCorP): pl_rcorit = RCorRit / RCorPit.
• Accuracy in tax revenue planning (pl_rtribit): calculated from the ratio between actual tax revenues (RTribR) and expected tax revenues (RTribP), according to the following formula: pl_rtribit = RTribRit / RTribPit.
• Accuracy in the planning of revenues from current transfers (pl_rtrcorit): calculated from the ratio between actual current transfers (RTrCorR) and expected current transfers (RTrCorP), given by the formula: pl_RTrCorit = RTrCorRit / RTrCorPit.
• Accuracy in capital revenue planning (pl_rcapit): calculated from the ratio of actual capital revenues (RCapR) to expected capital revenues (RCapP): pl_rcapit = RCapRit / RCapPit. Capital revenues are instruments for financing the programs and actions defined in the budget.
• Accuracy in planning revenues from capital transfers (pl_rtrcapit): calculated from the ratio between actual revenue from capital transfers made (RTrCapR) and expected revenue capital transfers (RTrCapP): pl_rtrcapit = RTrCapRit / RTrCapPit.
Variables related to accuracy in the planning and execution of expenditures:
• Accuracy in the planning of budget expenditure (pl_dorcit): this variable iscalculated from the ratio of the executed budget expenditure (DOrcE) and budget expenditure (DOrcF) fixed by the Annual Budget Law (LOA) (pl_dorcit = DOrcEit / DOrcFit). This variable aims to verify the accuracy when determining the amount of expenses to be carried out in a financial year, from the forecast of the amount of resources available.
• Accuracy in the planning of current expenses (pl_dcorit): this variable is given by the ratio between the executed current expenses (DCorE) and current fixed expenses (DCorF) in the budget law, according to the formula: pl_dcorit = DCorEit / DCorFit.
• Accuracy in capital expenditure planning (pl_dcapit): this variable is given by the ratio of capital expen-diture executed (DCapE) to fixed capital expenexpen-diture (DCapF) in LOA: pl_dcapit = DCapEit / DCapFit.
• Inscription of expenditure as “unused funds from other fiscal years” (insc_rpg it): this variable given by the ratio between the amount recorded as “unused funds from other fiscal years” to be paid and the budget expenditures spend (DOrc). It reflects to what extent the expenditure did not complete the implementation stages, representing only commitment of the budget credit, from the following formula: insc_rpgit = InscRpgit/DOrcEit.
Variables related to the planning of revenues and expenses in studies involving fiscal indicators were identified in the works of Bretschneider and partners (1989), Jones, Sanguinetti and Tommasi (2000), Gleich (2003), Hendrick (2004), Kloha, Weissert and Kleine (2005), Azevedo (2014) and Cruz and Marques (2017).
The data for the creation of the variables related to the accomplishment of goals and fiscal limits and to the accuracy of the budget forecasts were obtained in the System of Collection of Accounting Data of the Institutions of the Federation (SISTN).
3.2.3 TRANSPARENCY
The fiscal transparency assessments were based on the LRF guidelines (article 48) about transpar-ency instruments related to responsible fiscal management. The units of information were verified exclusively in the official municipalities’ websites. The transparency indicator was measured from 0 to 1, according to the proportion of compliance to the required items. The 14 items of transparency represent 100% of compliance to the required items, considered individually and with the same weight.
Chart 1 presents the set of fiscal transparency variables proposed, segregated according to the different phases of the budget process to which they are related.
CHART 1 INDICATORS FOR ASSESSING THE TRANSPARENCY OF FISCAL MANAGEMENT.
Variable Descrição Items
Transparency of budget planning instruments (tr_plan)
proportion of the transparency of budget planning instruments
4
Transparency of budget execution instruments (tr_exec)
proportion of the transparency of budget execution instruments
4
Transparency of control and accountability instruments (tr_pcon)
proportion of the transparency of control and accountability instruments
6
Transparency of fiscal management (tr_fiscal) proportion of the transparency of fiscal management instruments required
14
Source: Elaborated by the authors.
Additionally, as it was considered one the good practices of governance and transparency in the public sector, the disclosure of fiscal transparency instruments for fiscal years prior to those legally required was verified. Thus, it was verified how many years prior to 2010 (ex_anter) were the fiscal transparency instruments available on the websites of the municipalities surveyed.
3.2.4 CONTROL
As a representative control variable, this study proposes the result of the prior report issued by the Court of Accounts analyzing the annual account reports of the Executive Branch. The registration of the type of prior report issued by the Court of Accounts for each municipality related to the fiscal years included in the survey originated the categorical variables, representative of the dimension of the control, through the judgment of the account.
The results of the management of revenues and expenses, based on Courts of Accounts reports, constitute a picture of how control structures have acted to prevent corruption capable of affecting the balance of public accounts. Some studies about the Courts of Accounts and the previous reports issued by them are: Arantes, Abrucio and Teixeira (2005), Melo, Pereira and Figueiredo (2009), Pereira and Cordeiro Filho (2012) and Azevedo (2014). Thus, as variables representative of the control exercised by the courts of law, three categorical variables were adopted based on the recommendation of previous reports, as follows:
• Favorable report (pp_fav): in this category, account reports indicate the adequacy of the control mechanisms and compliance with legal principles. They do not have formal and material errors.
• Favorable report, with caveats (pp_fav_res): category in which account reports indicate failures in the control mechanisms. They present formal, but not material, errors that result in damage to the government.
• Unfavorable report (pp_desfav): in this category, account reports indicate deficiencies in the control mechanisms. They present formal and material errors that result in damage to the treasury.
The results of the Courts of Accounts reports were collected on the websites of the relevant courts of auditors, but there were many cases of reports not available for the period analyzed.
In addition to the recommendation of Courts of Accounts reports, it was verified, during the collection of data on the websites of municipalities, whether they had a specific internal control body (CGM) in the municipal administrative structure. As already discussed, the existence of exclusive and independent bodies of internal control in municipalities tends to provide greater control of the acts regarding the principles governing public administration.
3.3 HYPOTHESES
• Planning
The literature and the logic of calculating the fiscal indicators consider that municipalities that prepare more accurate budget forecasts and have more efficient planning present more balanced fiscal results. Bretschneider and partners (1989), Hagen and Harden (1995), Alesina and partners (1999), Jones, Sanguinetti and Tommasi (2000), Gleich (2003) and Hendrick (2004) adopted this hypothesis. The literature is not conclusive, but leaves room for the assumption that public budget configurations tend to influence fiscal outcomes. Thus, the first hypothesis is proposed:
H
a: More accurate budget forecasts are positively associated with more balanced and fiscal targets.
• Transparency
Research has suggested an association between transparency and fiscal performance indicators (Kopits and Craig, 1998; Heald, 2003; Benito and Bastida, 2009). Under the LRF, Sacramento and Pinho (2007) and Zuccolotto and Teixeira (2014) point out the relationship between transparency and fiscal indicators. From these findings, we present the hypothesis:
H
b: Higher levels of fiscal transparency are positively associated with more balanced and fiscal
targets.
• Control
From the perspective of fiscal management, control structures in public entities are designed to prevent risks and correct deviations that may affect the balance of public accounts. Melo, Pereira and Figueiredo (2009) and Pereira and Cordeiro Filho (2012) consider that previous reports issued by the courts of law have the potential to reflect the structures of management and control of entities, including unfolding fiscal indicators. One of the objectives of internal control is to assist the work of external control, which tends to give favorable reports the better the control structure.
From the idea that the control mechanisms are essential factors for the achievement of the respon-sibility in fiscal management, the hypothesis Hc is elaborated:
H
c: Higher quality in control structures is positively associated with more balanced indicators of
achievement of targets and fiscal limits.
4. EMPIRICAL PROCEDURES
4.1 DESCRIPTIVE STATISTICS
4.1.1 VARIABLES FOR MEETING TARGETS AND FISCAL LIMITS
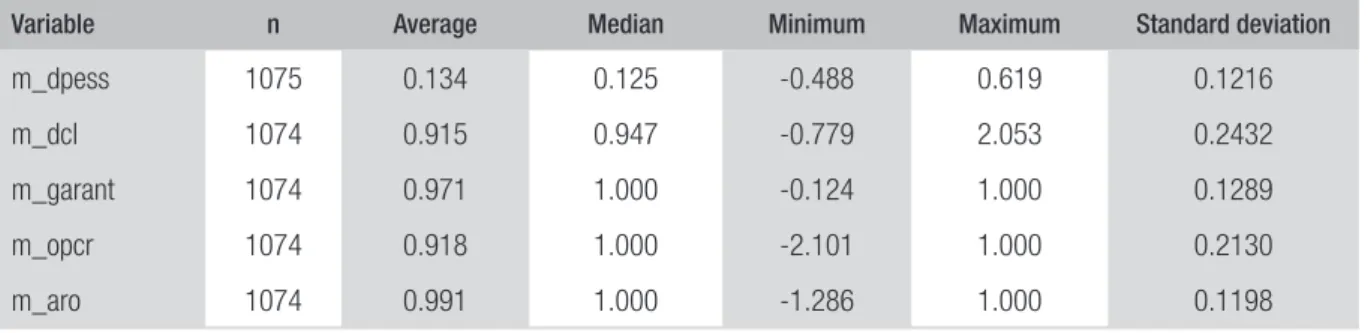
Table 1 presents the descriptive statistics of the variables related to the margins in relation to the fiscal limits.
TABLE 1 DESCRIPTIVE STATISTICS — VARIABLES OF COMPLIANCE WITH FISCAL LIMITS
Variable n Average Median Minimum Maximum Standard deviation
m_dpess 1075 0.134 0.125 -0.488 0.619 0.1216
m_dcl 1074 0.915 0.947 -0.779 2.053 0.2432
m_garant 1074 0.971 1.000 -0.124 1.000 0.1289
m_opcr 1074 0.918 1.000 -2.101 1.000 0.2130
m_aro 1074 0.991 1.000 -1.286 1.000 0.1198
Source: Elaborated by the authors, based on research data.
Regarding the limits of the granting of guarantees (m_garant) and credit operations by anticipa-tion of revenue (m_aro), there are few municipalities that use these instruments in budget execution (median = maximum = 1 and average close to 1) of the few cases, the observations of noncompliance of the limits are reduced. In these cases, the margin is close to 1 (or 100%), which indicates absence of guarantees and anticipation of revenue.
One of the possible explanations is that the fiscal management of municipalities is adequate. This is unlikely, given the scarcity of resources against the demands and financial imbalance of many en-tities. Another is that the limits do not fit the fiscal reality of the municipalities. Most municipalities presented a large margin in relation to the ceilings.
The idea underlying the definition of fiscal limits is for the entities to efficiently manage revenues and expenses so as not to exceed the limits. If the margins are large, it indicates that the limits need to be reassessed so that government agencies need to make some fiscal effort in order to not default.
Table 2 shows the descriptive statistics of the variables related to the achievement of the nominal result goals (res_nom) and primary result (res_prim).
TABLE 2 DESCRIPTIVE STATISTICS OF THE NOMINAL AND PRIMARY OUTCOME TARGETS
Variable n Average Median Minimum Maximum Standard deviation
res_nom 629 -0.114 -0.734 -793.293 2203.191 105.8791
res_prim 654 45.504 0.332 -1107.405 21945.464 891.3585
Source: Elaborated by the authors, based on research data.
(LDO). For the valid cases (654) of res_prim, an average change of 4550% was obtained — this means that, on average, the primary result was larger than the target.
The expressive variation around the goals suggests the possibility of imperfection or non-use of reliable information in its definition. Although these results may suffer variations due to variables beyond the control of managers, there is a high and persistent discrepancy over the years.
4.1.2 PLANNING ACCURACY VARIABLES
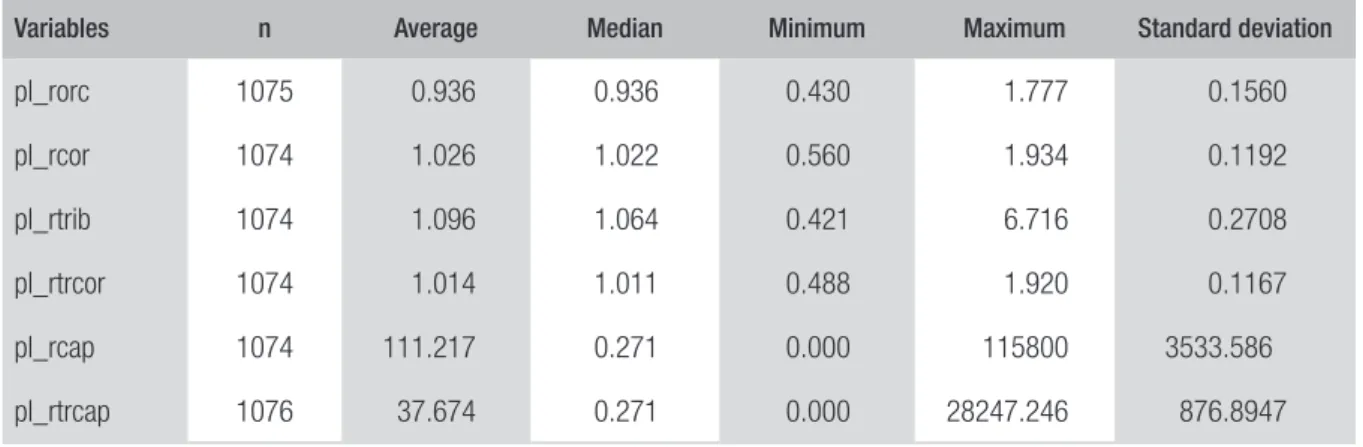
Table 3 presents the descriptive statistics of the variables related to the accuracy of the revenue forecast.
TABLE 3 DESCRIPTIVE STATISTICS OF VARIABLES RELATED TO THE FORECAST AND REALIZATION
OF BUDGET REVENUES
Variables n Average Median Minimum Maximum Standard deviation
pl_rorc 1075 0.936 0.936 0.430 1.777 0.1560
pl_rcor 1074 1.026 1.022 0.560 1.934 0.1192
pl_rtrib 1074 1.096 1.064 0.421 6.716 0.2708
pl_rtrcor 1074 1.014 1.011 0.488 1.920 0.1167
pl_rcap 1074 111.217 0.271 0.000 115800 3533.586
pl_rtrcap 1076 37.674 0.271 0.000 28247.246 876.8947
Source: Elaborated by the authors, based on research data.
The municipalities analyzed spent, on average, 93.6% of the total budgetary revenues provided for in the LOA (pl_rorc). Current transfer revenues (pl_rtrcor) are the main source of funding for most Brazilian municipalities (Vecchia and Montoya, 2002; Cruz and Senhoras, 2013) and had an average achievement of 101.4% in the period studied, very close to the expected amount.
The remaining classifications, which represent details of the budget revenue, present a higher performance than the forecast, especially capital revenues and capital transfers, which are more volatile, mainly because they are more subject to the discretionary power of managers, such as those arising of voluntary transfers.
Table 5 presents the descriptive statistics of the variables related to the accuracy in the forecast and execution of the expenses.
not comply with all stages of execution totaled an average of 8.5%, with inscription as “unused funds from other fiscal years”.
TABLE 4 DESCRIPTIVE STATISTICS OF VARIABLES RELATED TO THE DEFINITION AND EXECUTION
OF BUDGET EXPENDITURES
Variable n Average Median Minimum Maximum Standard deviation
pl_dorc 1075 0.913 0.915 0.278 1.669 0.1558
cr_adic 1076 0.107 0.075 -0.039 1.002 0.1167
pl_dcor 1073 1.051 1.044 0.410 1.602 0.1195
pl_dcap 1073 0.619 0.512 0.046 6.548 0.4452
insc_rpg 1073 0.085 0.077 0.000 0.415 0.0556
Source: Elaborated by the authors, based on research data.
A joint analysis of the accuracy of revenue and expenditure planning indicates a more flexible percentage for revenues, since these, despite their crucial role, are obviously only forecast. And while forecasts must be constructed using appropriate techniques and reliable information to achieve greater accuracy, there are factors, mainly related to the behavior of the economy, that are outside the control of the public administration at the municipal level, which can affect revenue collection during the fiscal year. In turn, the expenses are fixed based on the collection forecast and the Executive Branch does not have total autonomy to change the appropriations legally approved.
4.1.3 FISCAL TRANSPARENCY VARIABLES
Table 5 presents the statistics of the variables related to the disclosure of fiscal transparency instru-ments on the websites of city halls.
TABLE 5 DESCRIPTIVE STATISTICS — DISCLOSURE OF FISCAL TRANSPARENCY INSTRUMENTS
Variable n Average Median Minimum Maximum Standard deviation
tr_plan 1128 0.571 0.750 0 1 0.3864
tr_exec 1128 0.646 0.750 0 1 0.4146
tr_pcon 1128 0.365 0.359 0 1 0.3159
tr_fiscal 1128 0.504 0.569 0 1 0.2798
ex_anter 282 1.613 0 0 11 2.6241
The average disclosure of the planning transparency instruments (tr_plan) was 57.1%, while the median value was 75%. Of the fiscal transparency instruments related to the planning process, the less publicized item was the holding of public hearings to discuss plans and budgets.
As for the transparency instruments of budget execution (tr_exec), there was an average disclosure of 64.6% of the required items. In this category, the items with the lowest disclosure were the analytical information about the budget execution of revenue and expenditure in real time.
Regarding the transparency of the control and accountability instruments (tr_pcon), the average disclosure was 36.5% of the items. There was an increasing trend, and in 2013 40% of the items were disclosed. This suggests that transparency requirements are gradually being enforced by municipal-ities. Fiscal transparency, which includes the disclosure of all the mentioned instruments, presented an average of 50.4%, with evolution in the period analyzed.
Finally, the disclosure of the instruments of fiscal transparency was verified for fiscal years prior to those legally required (ex_anter). The 282 municipalities surveyed presented an average of 1.6 years of disclosure prior to the validity of Law 131/2009.
4.1.3 VARIABLES RELATED TO CONTROL THROUGH ACCOUNT JUDGMENT
Table 6 details the types of prior reports issued for the municipalities included in the survey.
TABLE 6 TYPES OF PREVIOUS REPORTS SENT BY THE COURTS OF ACCOUNTS
Year pp_fav pp_fav_res pp_desfav Total
n % n % n %
2010 127 0.512 67 0.270 54 0.218 248
2011 99 0.440 73 0.324 53 0.236 225
2012 49 0.327 40 0.267 61 0.407 150
2013 13 0.325 26 0.650 1 0.025 40
Total 288 0.434 206 0.311 169 0.255 663
Source: Elaborated by the authors, based on research data.
4.2 CORRELATION ANALYSIS
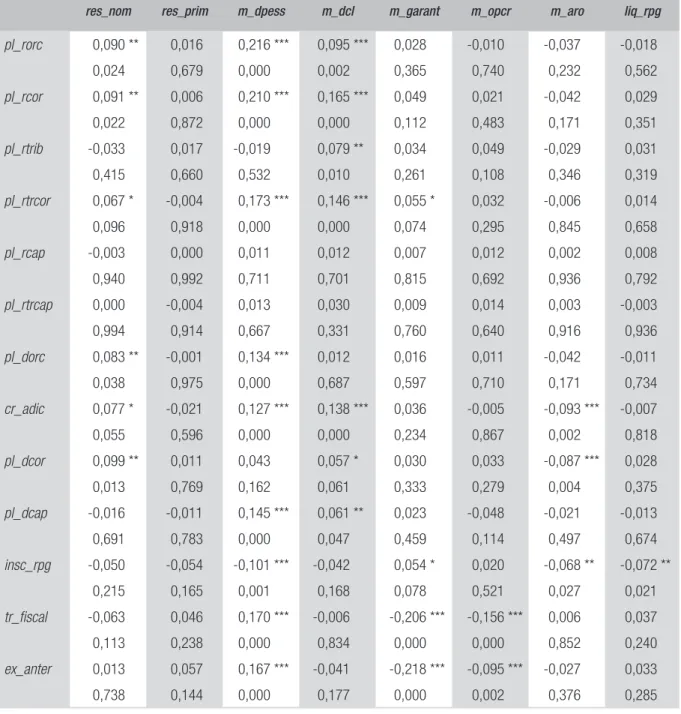
Table 7 presents the results of the Pearson correlation test between the dependent and explanatory variables, in order to initially measure the degree of relationship between the variables.
TABLE 7 CORRELATION BETWEEN DEPENDENT AND EXPLANATORY VARIABLES
res_nom res_prim m_dpess m_dcl m_garant m_opcr m_aro liq_rpg
pl_rorc 0,090 ** 0,016 0,216 *** 0,095 *** 0,028 -0,010 -0,037 -0,018
0,024 0,679 0,000 0,002 0,365 0,740 0,232 0,562
pl_rcor 0,091 ** 0,006 0,210 *** 0,165 *** 0,049 0,021 -0,042 0,029
0,022 0,872 0,000 0,000 0,112 0,483 0,171 0,351
pl_rtrib -0,033 0,017 -0,019 0,079 ** 0,034 0,049 -0,029 0,031
0,415 0,660 0,532 0,010 0,261 0,108 0,346 0,319
pl_rtrcor 0,067 * -0,004 0,173 *** 0,146 *** 0,055 * 0,032 -0,006 0,014
0,096 0,918 0,000 0,000 0,074 0,295 0,845 0,658
pl_rcap -0,003 0,000 0,011 0,012 0,007 0,012 0,002 0,008
0,940 0,992 0,711 0,701 0,815 0,692 0,936 0,792
pl_rtrcap 0,000 -0,004 0,013 0,030 0,009 0,014 0,003 -0,003
0,994 0,914 0,667 0,331 0,760 0,640 0,916 0,936
pl_dorc 0,083 ** -0,001 0,134 *** 0,012 0,016 0,011 -0,042 -0,011
0,038 0,975 0,000 0,687 0,597 0,710 0,171 0,734
cr_adic 0,077 * -0,021 0,127 *** 0,138 *** 0,036 -0,005 -0,093 *** -0,007
0,055 0,596 0,000 0,000 0,234 0,867 0,002 0,818
pl_dcor 0,099 ** 0,011 0,043 0,057 * 0,030 0,033 -0,087 *** 0,028
0,013 0,769 0,162 0,061 0,333 0,279 0,004 0,375
pl_dcap -0,016 -0,011 0,145 *** 0,061 ** 0,023 -0,048 -0,021 -0,013
0,691 0,783 0,000 0,047 0,459 0,114 0,497 0,674
insc_rpg -0,050 -0,054 -0,101 *** -0,042 0,054 * 0,020 -0,068 ** -0,072 **
0,215 0,165 0,001 0,168 0,078 0,521 0,027 0,021
tr_fiscal -0,063 0,046 0,170 *** -0,006 -0,206 *** -0,156 *** 0,006 0,037
0,113 0,238 0,000 0,834 0,000 0,000 0,852 0,240
ex_anter 0,013 0,057 0,167 *** -0,041 -0,218 *** -0,095 *** -0,027 0,033
0,738 0,144 0,000 0,177 0,000 0,002 0,376 0,285
Source: Elaborated by the authors, based on research data.
The variables related to the planned action (forecasts accuracy) showed a greater adherence to the hypothesis of positive association with the variables of compliance with targets and fiscal limits. For the fiscal transparency variables, the analysis verified the adherence to the hypothesis of positive association with only one of the variables of compliance with targets and fiscal limits was verified. These results are in line with the works of Bretschneider and partners (1989), Jones, Sanguinetti and Tommasi (2000), Hendrick (2004) and Azevedo (2014), but differ from Gleich’s (2003) findings.
4.3 FACTOR ANALYSIS FOR DEFINING RELEVANT VARIABLES
In the context of this research, two pillars of responsible fiscal management analyzed are measured by a set of variables that, a priori, would be interrelated: responsibility in meeting targets and limits and planned action. As a result of the lack of consensus in the literature on the most representative variables of these pillars and considering that the use of such variables is recurrent in the monitoring of fiscal management, a factor analysis was performed for the sets of variables of the two pillars. The objective was to identify a subset of variables that have an informational load representative of the pillars.
The factor analysis1 of the variables related to the accomplishment of goals and fiscal limits did not show to be adequate ex-post because the parameters generated did not reach the minimum values considered acceptable. The absence of significant correlation and of common factors are indications that the variables related to the accomplishment of goals and fiscal limits refer to different dimensions of the fiscal reality of the municipalities. This finding suggests a specific analysis (Hendrick, 2004) for each variable related to the achievement of goals and limits in relation to the other dimensions of responsibility in fiscal management
The factor analysis of the variables related to the planned action dimension resulted in a factor (factor_pl) composed of five variables: pl_rorc, pl_rcor, pl_rtrcor, pl_dorc and pl_dcor, all of which are economic categories of current revenues and expenses, with explained variance exceeding 75%.
4.4 ECONOMETRIC PROCEDURES
4.4.1 MODELS
From the multidimensional perspective of fiscal management, regression models were estimated in order to identify the relationship between the variables related to the achievement of fiscal targets and limits and the other pillars of fiscal management: planned action, transparency and control.
The general model (Equation 1) expresses the relation between a variable of compliance with targets and fiscal limits (dependent) and the variables representative of the other pillars of responsible fiscal management (explanatory), which are planned action, transparency and control.
VCMLFmit = αi + βplanit + δtransit + γcontrit +εit (1)
1 The factor analysis was performed using the principal components method. The method of rotation of the factors adopted was the
In which:
VCMLFmit = variable of compliance with goals and fiscal limits of the municipality i in year t; In the estimated models, VCMLFmit can be represented by the following variables:
i. Variation around the nominal result goal (res_nomit); ii. Variation around the primary outcome goal (res_primit);
iii. Margin in relation to the limit of the total expenditure with personnel (m_dpessit); iv. Margin in relation to the limit of the Net Consolidated Debt (m_dclit);
v. Margin in relation to the guarantee limit (m_garantit);
saw. Margin in relation to the limit of credit operations (m_opcrit);
vii. Margin in relation to the limit of credit operations by Anticipation of the Budget Revenue (m_aroit); viii. Liquidity for unused funds from other fiscal years to be paid (liq_rpgit).
The explanatory variables are as follows:
planit = indicates the accuracy of the planning of revenues and expenditures of municipality i in year t.
transit = indicates the level of disclosure of fiscal transparency instruments of municipality i in year t contrit = indicates the control of municipality i in year t, through the reports of the Courts of Accounts and existence of control structure.
The data used were organized in a panel format, where the municipalities are the transversal elements and the years are the temporal elements. The models were initially estimated by the ordinary least squares method. Then tests were performed to verify the statistical properties of the regression errors: absence of serial auto correlation, homoscedasticity and normality of the residuals. After that, the most appropriate methodology to estimate the models was verified: grouped or panel-based regression. Finally, we defined the specification of the effects of the models: fixed effects or random effects.
4.4.2 RESULTS
Eight regressions were performed from equation 1, and for each regression the VCMLF (dependent variable) was adopted a different indicator. The regressions with the dependent variables res_nom, res_prim, m_aro and liq_rpg did not present significant coefficients in any of the specifications. Thus, these variables related to the achievement of fiscal goals and limits could not be explained by the explanatory variables adopted in the general model given by equation 1.
For the variables m_dpess, m_dcl, m_garant and m_opcr, the models presented significant coefficients.
TABLE 8 RESULTS OF REGRESSIONS WITH SIGNIFICANT COEFFICIENTS
VCLMF: m_dpess VCLMF: m_dcl VCLMF: m_garant VCLMF: m_opcr
Random effects Fixed Effects Random effects Random effects
Coef. z Sig Coef. t Sig Coef. z sig Coef. z sig
factor_pl 0,013** 2,59 0,010 0,0325*** 2,76 0,006 0,0024 0,44 0,663 0,0066 0,83 0,408
tr_fiscal 0,019 0,81 0,417 -0,0199 -0,36 0,721 -0,0460** -2,41 0,016 -0,0849** -2,54 0,011
ex_anter 0,007*** 2,79 0,005 -0,0064 -1,43 0,153 -0,0011 -0,27 0,787
pp_fav 0,005 0,69 0,489 -0,013 -0,8 0,426 -0,0054 -0,7 0,484 -0,0204* -1,69 0,090
pp_desfav -0,017* -1,77 0,078 -0,0443* -1,89 0,060 -0,0006 -0,1 0,918 -0,0026 -0,19 0,847
cgm -0,024* -1,85 0,064 -0,0262** -2,05 0,040 0,0461** 2 0,045
C 0,146*** 8,99 0,000 0,9325*** 29,98 0,000 1,0234*** 82,4 0,000 0,9477*** 36,32 0,000
Wald chi2 27,91 0,0001 F 2,29 0,0603 Wald chi2 11,61 0,0713 Wald chi2 28,72 0,0001
R2 Within 0,0078 0,0586 0,000 0,0017
Between 0,1186 0,0498 0,079 0,0573
Overall 0,1027 0,0489 0,0719 0,0466
Source: Elaborated by the authors, based on research data.
Note: (1) *** = sig.<0,01; ** = sig.<0,05; * = sig.<0,10; (2) Models estimated with robust standard errors.
Regarding the dependent variable m_dcl, in the significance test, the factor score of the planning variables and the unfavorable prior report dummy (pp_desfav) were shown to be statistically significant. The F test presented significance less than 10%, which indicates that the model has the ability (R2 overall = 0.0489) to explain the dependent variable.
Regarding the m_garant dependent variable, only the tr_fiscal and cgm variables presented significance, but all with opposite sign than expected. The Wald test presented statistical significance, with sig. <0.10, which indicates that the model with the factor score of the planning variables (factor_pl) as proxy for the planned action dimension along with the other transparency and control variables has the capacity (R2 overall = 0.0719) to explain the behavior of the m_garant variable.
The estimated regression with the dependent variable m_opcr revealed significance of the variables
tr_fiscal and pp_fav, those with sign opposite to what was expected, and cgm. The Wald test revealed that the estimated model with robust standard errors was significant at 1%. The explanatory capacity of the regression (R2 overall) was 0.0466.
4.4.3 ANALYSIS OF THE RESULTS CONSIDERING THE HYPOTHESES
The hypotheses that admit the existence of a positive and significant relationship between the variables of compliance with targets and fiscal limits and the dimensions of the planned action, transparency and control were not completely rejected.
goals and limits established to the fiscal reality of the municipalities. These findings corroborate with previous studies.
Public managers have incentives to meet targets and fiscal limits as a result of punitive mecha-nisms objectively defined in cases of non-compliance. The absence of clearly defined penalties for poor planning does not contribute to the efforts of municipal managers to promote more accurate budget forecasts (Azevedo, 2014).
Hypothesis Hb: from the perspective of transparency, the representative variables revealed a sig-nificant positive relationship only with the variable m_dpess. For the variables m_garant and m_opcr
the association was negative.
Variables res_nom, res_prim, m_dcl, m_aro and liq_rpg were not significantly related to the proxies for disclosure of fiscal transparency instruments. These results point to a lack of integration between the pillars of responsible fiscal management that the LRF defends.
Hypothesis Hc: From the perspective of control exercised by the Courts of Accounts, a significant positive association with the dependent variables m_dpess and m_dcl was found. The variable
m_opcr presented negative relation with the result of the previous report. This finding indicates the predominance of the Courts of Accounts as watchdogs of conformity.
The variables related to the fulfillment of goals (res_nom and res_prim), limits (m_aro) and related to financial balance and unused funds from other fiscal years to be paid (liq_rpg) did not present significant relation with any of the pillars of fiscal management. The explanatory variables did not present explanatory capacity for these variables, which contradicts the provisions of the LRF that indicate the contribution of the pillars of the fiscal management to the fulfillment of goals and fiscal limits. Thus, the results indicate the existence of only partial integration among the pillars of fiscal management in the municipalities and period surveyed.
5. CONCLUSIONS
This study has its origin in the provisions of the LRF that deal with the pillars of responsible fiscal management. To achieve the research objectives, an original database was built, from the data collection in primary sources in the SISTN, in the Courts of Accounts and in the websites of the 282 municipalities of the sample.
With a multidimensional conception of fiscal management, this paper proposes the use of concepts related to planning, transparency and control as representative of the pillars of fiscal management. The proposal of variables related to the pillars of planned action, fiscal transparency and control provided new possibilities to confront the results of traditional fiscal variables with factors inherent to fiscal management.
In relation to the pillar of planned action, a positive and significant relationship was observed with target and boundary variables, but some proxies presented a negative relation and others did not present any significant relation. These results do not support the hypothesis that fiscal indicators of compliance with targets and limits are positively related and indicate a lack of relation with the planned action and/or inadequacy of the goals and limits established to the fiscal reality of the municipalities.
practices have improved in recent years, the results suggest that there is still a gap in the implication of such practices in fiscal results, which are subject to control by the Courts of Accounts. The lack of effective mechanisms to monitor fiscal transparency is a disincentive for managers to make efforts to disseminate fiscal transparency instruments.
Regarding the control dimension, a positive relation was observed with variables of compliance with goals and limits. Some measurements related to the accuracy of the budget forecasts presented negative relation with the variables of accomplishment of goals and fiscal limits, contrary to what was expected, and other variables did not present any significant relation. This finding suggests that the role of the Courts of Accounts has emphasized legal compliance, since there is no reference to the fiscal trajectory in relation to the established limits. The few significant relationships that were found may derive from the limitations of the prior report of the Courts of Accounts as an instrument that reflects the control structures in the municipalities.
The assumption about the lack of integration between the pillars of fiscal management in large municipalities was corroborated by the results. The fiscal indicators did not present significant re-lationships between them and also showed little association with the other variables representative of fiscal management. It is suggested that one of the reasons is the difference between the incentives that public managers have to meet fiscal targets and limits and to meet the other pillars, which do not have clearly defined punitive mechanisms.
The analysis of the results raises some reflections, mainly regarding the variables related to the compliance of limits. One of the points refers to the reasonableness of the limits established. In the universe of large Brazilian municipalities there are few cases of use of credit operations, granting of guarantees, and anticipation of budget revenues. Consequently, municipalities have wide margins in relation to the established limits, without necessarily implying a balanced fiscal situation.
REFERENCES
AFONSO, José R. Conta e faz-de-conta. In: CÂMA-RA DOS DEPUTADOS. Responsabilidade na gestão pública: os desafios dos municípios. Brasília: Edições Câmara, 2008. p. 83-98.
ALESINA, Alberto; PEROTTI, Roberto. Fiscal discipline and the budget process. American Economic Review, v. 86, n. 2, p. 401-407, 1996.
ALESINA, Alberto et al. Budget institutions and fiscal performance in Latin America. Journal of Development Economics, v. 59, n. 2, p. 253-273, 1999.
ARANTES, Rogério B. et al. Controles democráticos sobre a administração pública no Brasil: Legislativo, tribunais de contas, Judiciário e Ministério Público. In: LOUREIRO, Maria Rita; ABRUCIO, Fernando L.; PACHECO, Regina S. Burocracia e política no Brasil: desafios para a ordem democrática no século XXI. Rio de Janeiro: FGV, 2010. p. 109-147.
ARANTES, Rogério B.; ABRUCIO, Fernando L.; TEIXEIRA, Marco Antônio C. A imagem dos tri-bunais de contas subnacionais. Revista do Serviço Público, v. 56, n. 1, p. 57-85, 2005.
ARAÚJO, Fernando C.; LOUREIRO, Maria Rita. Por uma metodologia pluridimensional de avaliação da LRF. Rev. Adm. Pública, Rio de Janeiro, v. 39, n. 6, p. 1231-52, 2005.
AZEVEDO, Ricardo. R. Imprecisão na estimação
orçamentária dos municípios brasileiros.
Disserta-tion (master degree) — Faculdade de Economia, Administração e Contabilidade de Ribeirão Preto, Universidade de São Paulo, Ribeirão Preto, 2014.
BENITO, Bernardino; BASTIDA, Francisco. Budget transparency, fiscal performance, and political tur-nout: an international approach. Public Administra-tion Review, v. 69, n. 3, p. 403-417, 2009.
BRASIL. Constituição da República Federativa do Brasil, de 05 de outubro de 1988. Available at: <www. planalto.gov.br/ccivil_03/Constituicao/Constituicao. htm>. Accessed on: 30 Aug. 2013.
BRASIL. Lei Complementar no 101, de 4 de maio de
2000. Available at: <www.planalto.gov.br/CCIVIL/ Leis/LCP/Lcp101.htm>. Accessed on: 30 Aug. 2013.
BRASIL. Lei Complementar no 131, de 27 de maio de
2009. Available at: <www.planalto.gov.br/ccivil_03/ leis/lcp/lcp131.htm>. Accessed on: 30 Aug. 2013.
BRASIL. Tribunal de Contas da União. Regimento interno do Tribunal de Contas da União. Boletim
do Tribunal de Contas da União, Brasília v. XLV,
n. 1, p. 1-93, 2012.
BRETSCHNEIDER, Stuart I. et al. Political and orga-nizational influences on the accuracy of forecasting state government revenues. International Journal of Forecasting, v. 5, n. 3, p. 307-319, 1989.
CALIFE, Flávio E. Uma classificação dos municípios no estado de São Paulo de acordo com o desem-penho fiscal. Integração (USJT), São Paulo,v. 47, p. 305-313, 2006.
CAVALCANTE, Pedro L. C. O que torna um pre-feito responsável? Uma análise comparativa dos condicionantes da gestão fiscal. In: ENCONTRO DE ADMINIS TRAÇÃO PÚBLICA DA ANPAD — ENAPG, V, 2012, Salvador. Anais... Salvador: Anpad, 2012.
CRUZ, Cláudia F.; SENHORAS, Elói M. Avaliação da responsabilidade na gestão fiscal com base nos pilares da Lei de Responsabilidade Fiscal: um estudo com municípios de Santa Catarina. Cadernos de Fi-nanças Públicas, Brasília, v. 13, n. 1, p. 69-104, 2013.
CRUZ, Cláudia F. et al. Transparência da gestão pública municipal: um estudo a partir dos portais eletrônicos dos maiores municípios brasileiros. Rev. Adm. Pública, Rio de Janeiro, v. 46, n. 1, p. 153-176, Jan./Feb. 2012.
CRUZ, Nuno F. et al. Measuring local government transparency. Public Management Review, v. 18, p. 866-893, 2015.
CRUZ, Nuno F.; MARQUES, Rui C. Structuring composite local governance indicators. Policy Stu-dies, v. 38, n. 2, 2017, p. 109-129.
DAFFLON, Bernard. Local public finance: balanced budget and debt control in European countries. Cheltenham: Edward Elgar, 2002.
DESCHAMPS, Elaine. The impact of institutional change on forecast accuracy: a case study of bud-get forecasting in Washington State. International Journal of Forecasting, v. 20, n. 4, p. 647-657, 2004.
DHOLAKIA, Archana. Measuring fiscal perfor-mance of states: an alternative approach. Economic and Political Weekly, v. 40, n. 31, p. 3421-3428, 2005.
discriminante para modelar uma congruência com o controle externo. In: SEMINÁRIO USP DE CON-TABILIDADE E CONTROLADORIA, 4., 2004, São Paulo. Anais... São Paulo: FEA/USP, 2004.
FIORAVANTE, Dea G.; PINHEIRO, Maurício M. S.; VIEIRA, Roberta S. Lei de Responsabilidade Fiscal e finanças públicas municipais: impactos sobre despesas com pessoal e endividamento. Texto para Discussão, n. 1223. Brasília: Ipea, 2006.
FMI. Fundo Monetário Internacional. Manual de transparência fiscal (2007). Available at: <www. imf.org/external/np/fad/trans/por/manualp.pdf>. Accessed on: 30 Aug. 2013.
GERIGK, Willson. O impacto da Lei de Responsabi-lidade Fiscal sobre a gestão financeira dos pequenos municípios do Paraná. Dissertation (master’s degree in accounting) — Setor de Ciências Sociais Aplica-das, Universidade Federal do Paraná, Curitiba, 2008.
GIUBERTI, Ana C. Efeitos da lei de responsabilidade fiscal sobre os gastos dos municípios brasileiros. Dissertation (master degree) — Faculdade de Economia, Administração e Contabilidade de Ribeirão Preto, Universidade de São Paulo, Ribeirão Preto, 2005.
GLEICH, Holger. Budget institutions and fiscal performance in Central and Eastern European countries. Working Paper Series, 215. European Central Bank, 2003.
GOBETTI, Sérgio W.; KLERING, Luis R. Índice de responsabilidade fiscal e qualidade de gestão: uma análise combinada baseada em indicadores de estados e municípios. Anais doXII Prêmio Tesouro Nacional. Brasília: Esaf, 2007.
GREGGIANIN, Eugenio. Lei de Responsabilidade Fiscal: aspectos críticos. In: CÂMARA DOS DE-PUTADOS. Responsabilidade na gestão pública: os desafios dos municípios. Brasília: Edições Câmara, 2008. p. 195-266.
HAGEN, Jürgen V.; HARDEN, Ian J. Budget processes and commitment to fiscal discipline.
European Economic Review, v. 39, n. 3-4, p. 771-779, 1995.
HAGEN, Terge P.; VABO, Signe I. Political cha-racteristics, institutional procedures and fiscal performance: panel data analyses of Norwegian local governments, 1991-1998. European Journal of Political Research, v. 44, n. 1, p. 43-64, 2005.
HEALD, David. Fiscal transparency: concepts, measurement and UK practice. Public Administration, v. 81, n. 4, p. 723-759, 2003.
HENDRICK, Rebecca. Assessing and measuring the fiscal heath of local governments: focus on Chicago suburban municipalities. Urban Affairs Review, v. 40, n. 1, p. 78-114, 2004.
ICERMAN, Rhoda C.; SINASON, David H. Government accountability to the public: the dynamics of accountability in the U.S. Public Fund Digest, v. 7, n. 1, p. 64-80, 1996.
ISEN, Adam. Do local government fiscal spillovers exist? Evidence from counties, municipalities, and school districts. Journal of Public Economics, v. 110, p. 57-73, 2014.
JONES, Mark P.; SANGUINETTI, Pablo; TOMMA-SI, Mariano. Politics, institutions, and fiscal per-formance in a federal system: an analysis of the Argentine provinces. Journal of Development Eco-nomics, v. 61, n. 2, p. 305-333, 2000.
KLOHA, Philip; WEISSERT, Carol S.; KLEINE, Ro-bert. Developing and testing a new composite model to predict local fiscal distress. Public Administration Review, v. 65, n. 3, p. 313-323, 2005.
KOPITS, George; CRAIG, Jon. Transparency in government operations. IMF — Occasional Paper, n. 152, p. 1-42, Feb. 1998.
LEITE, Cristiane K. S.; PERES, Úrsula D. Lei de Responsabilidade Fiscal, federalismo e políticas pú-blicas: um balanço crítico dos impactos da LRF nos municípios brasileiros. In: CUNHA, Alexandre S.; MEDEIROS, Bernardo A.; AQUINO, Luseni M. C. (Org.). Estado, instituições e democracia: república. Brasília: Ipea, 2010. v. 1, p. 213-248.
MAHER, Craig S.; DELLER, Steven C. Measuring municipal fiscal condition: do objective measures of fiscal health relate to subjective measures? Journal of Public Budgeting, Accounting & Financial Mana-gement, v. 23, n. 3, p. 455-478, 2011.
MCNICHOL, Elizabeth C. Improving state revenue forecasting: best practices for a more trusted and re-liable revenue estimate. Center on Budget and Policy Priorities — CBPP, set. 2014. Available at: <www.cbpp. org/files/8-7-14sfp.pdf>. Accessed on: 30 Aug. 2013.
corruption explaining the performance of Brazilian audit institutions. Comparative Political Studies, v. 42, n. 9, p. 1217-1244, 2009.
MOCAN, H. Naci; AZAD, Sam. Accuracy and ra-tionality of state General Fund Revenue forecasts: evidence from panel data. International Journal of Forecasting, v. 11, n. 3, p. 417-427, 1995.
O’DONNELL, Guillermo. Accountability horizontal e novas poliarquias. Lua Nova, v. 44, p. 27-54, 1998.
ORTOLANI, Fernando; CAMPELLO, Carlos Al-berto G. B.; MATIAS, AlAl-berto Borges. A relação (in)existente entre responsabilidade fiscal e res-ponsabilidade social nos municípios Paulistas. In: ENCONTRO DA ANPAD, XXVIII, 2004, Curitiba.
Anais... Curitiba: Anpad, 2004.
PEREIRA, Jeronimo R.; CORDEIRO FILHO, José B. Rejeições de prestação de contas de governos municipais: o que está acontecendo? Contabilidade, Gestão e Governança, v. 15, n. 1, p. 33-43, 2012.
POTERBA, James M. Balanced budget rules and fiscal policy: evidence from the States. National Tax Journal, v. 48, n. 3, p. 329-336, 1996.
SACRAMENTO, Ana Rita S.; PINHO, José Antônio G. Transparência na administração pública: o que mudou depois da Lei de Responsabilidade Fiscal? Um estudo exploratório em seis municípios da região metropolitana de Salvador. Revista de Contabilidade da UFBA, v. 1, n. 1, p. 1-16, 2007.
VECCHIA, Eloi D.; MONTOYA, Marco A. Or-çamento e planejamento municipal: um estudo de caso. Revista de Economia Política, v. 22, n. 86, p. 136-155, 2002.
VICENTE, Ernesto F. R.; NASCIMENTO, Leonrado S. A efetividade dos ciclos políticos nos municípios brasileiros: um enfoque contábil. Revista de Conta-bilidade e Organizações, Ribeirão Preto, v. 6, n. 14, p. 107-126, Jan./Apr. 2012.
ZHANG, Yuanyan S.; BARNETT, Steven A. Fiscal vulnerabilities and risks from local government finance in China. IMF Working Paper, n. 14/4, 2014.
ZUCCOLOTTO, Robson; TEIXEIRA, Marco Antô-nio C. As causas da transparência fiscal: evidências nos estados brasileiros. Revista Contabilidade & Finanças, v. 25, n. 66, p. 242-254, 2014.
Cláudia Ferreira da Cruz
PhD, Accounting (University of São Paulo). Associate professor at Federal University of Rio de Janeiro.
E-mail: claudiacruz@facc.ufrj.br.
Luís Eduardo Afonso
PhD, Economics (University of São Paulo). Associate professor at University of São Paulo.