EXPERIMENTAL STUDY OF THE INFLUENCE OF CONSUMERS
MOVEMENT PARALLEL TO THE FRONTAL OPENING OF MULTIDECK
DISPLAY CASE ON THE EVAPORATOR'S THERMAL PERFORMANCE
G. G. HEIDINGER
(a), S. M. NASCIMENTO
(b), P. D. GASPAR
(c), P. D. SILVA
(d)(a)(b) EletrofrioRefrigeração Ltda, r João Chede, 1599, Cidade Industrial,
Curitiba - PR, 81170-220, Brazil
+55 (41) 2105-6097, (a) [email protected]; (b) [email protected] (c) (d) University of Beira Interior, Engineering Faculty, Dept. of Electromechanical Engineering,
Covilhã, 6201-001, Portugal
+351 275 329 759, (c) [email protected]; (d) [email protected]
ABSTRACT
This paper reports the results of experimental tests performed according to ISO 23953 (climate class n° 3: 25ºC and 60%) in an open refrigerated multideck display case (ORDC) to evaluate the influence of consumers passing in front of its opening on the thermal performance of the evaporator. The consumers’ passage in front of the ORDC is simulated by a robotic mannequin: MARIA - Mannequin for Automatic Replication of the
Interference in the Air curtain. Tests are performed for MARIA velocity's ranging from 0.2 ms-1 to 0.8 ms-1,
with 0.2 ms-1 velocity steps for two conditions: mannequin moving towards or against the airflow of the test
room. All tests are performed in an ORDC with dual air curtain. The results quantify the influence of MARIA translational velocity on the frost formation in the evaporator coil and how this phenomenon affects the evaporator's airflow, inlet and outlet temperatures and sensible and latent heat loads. The analysis of experimental data provides valuable information for evaporator design taking into account usual in-store conditions.
1.
INTRODUCTION
Concerning the open vertical refrigerated display cases (VORDC), the infiltration load corresponds 67% to 81% of the total heat load (Faramarzi, 1999; ASHRAE, 2010; Gaspar et al., 2011). The infiltration load is strongly dependent of the environmental conditions of the store, in which they are placed, of the air curtain velocity, of width and thickness and rate of air curtain agitation (ASHRAE, 2010). The air curtain agitation can be caused by shoppers passing and interfering on the air curtain to achieve some product or also the existence of some external air currents from outlets of air conditioning systems, fans and pressure differences that originate airflows. Gaspar et al. (2011) quantified experimentally the total heat load of a VORDC when the external airflow changes its direction and magnitude. At the reference experiment, the air velocity was fixed at vamb = 0.2 ms-1 and the direction of the airflow was parallel to the plane of the display opening (amb =
0°). When the airflow was oblique (amb = 45°) the total heat load increased 4.6% and when the airflow was perpendicular (amb = 90°) the increase was 5.7%. When the airflow velocity was changed to vamb = 0.4 m.s-1
parallel to the plane of the display opening (amb = 0°) the total and latent heat loads increased 53.6% and 76.9% respectively.
Gaspar et al. (2010a, 2010b) simulated numerically the influence of airflow (amb = 0°, 45° and 90°) and heat transfers impact in thermal entrainment. With the increase of air infiltration into the refrigerated space, when the air movement goes from parallel to perpendicular, occurs an increase in circulating air temperatures and the condensation formation rate. Additionally, Gaspar et al. (2012a, 2012b) extended the CFD model and developed parametric studies to improve the thermal performance and the energy efficiency of VORDC. Finned-tube heat exchangers is extensively used in various industrial applications, including refrigeration. They are very compact, lightweight, and characterized by a relative low manufacturing cost (Wang et al., 2002). Compact plate fin-and-tube heat exchangers (cooper circular tubes with or without inner corrugation and aluminium-corrugated fins) are usually used in VORDC. The heat transfer occurs between the air flowing through the fins and the refrigerant flowing inside the tubes in cross flow. The fins are responsible for a large
increase in the area of external heat transfer, and still, the airside is responsible for at least 85% of the total resistance to heat transfer in this type of equipment (Wang et al., 1997, 1999). During the VORDC running, the surfaces of the heat exchanger are at temperatures below the dew point and lower than the freezing point of water, therefore, condensation of water vapour present on the airflow with subsequent freezing on the surfaces of fins and tubes is unavoidable. The frost formation between fins reduces the air passage area reducing the airflow. The significant reduction of airflow during frost formation deteriorates the air curtain that protects the refrigerated space of VORDC as shown by Nascimento et al. (2013a, 2013b, 2014a, 2014b). Thus, as the ambient air enters in the refrigerated space, the optimal storage temperature of products is affected. Hence, VORDC operation needs regular and scheduled stops to defrost the ice on the evaporator surface in order to recover the initial conditions of performance without affecting the food safety. Regarding the process of frost formation and defrost, an optimal design of a VORDC is achieved when it has the lowest frequency and time of defrosting. The type, frequency and duration of defrosting are determined through experimental homologation tests conducted by the manufacturers of VORDC that are guided by current technical standards and that are directly related to the design of the heat exchanger. This issue has been widely studied, namely the performance evaluation of finned heat exchangers under frost formation conditions (Aljuwayhel et al., 2008), the influence of environmental conditions on frost formation and defrosting on heat exchangers of VORDC (Tassou et al., 1999; Heidinger et al., 2013a, 2014a, 2014b, 2015) to the energy efficiency strategies in refrigeration systems of large supermarkets (Garcia et al., 2010).
This experimental work, aims to quantify the frost formation rate on the evaporator coil and how this phenomenon affects the distribution and magnitude of evaporator's airflow, inlet and outlet temperatures and the components of the sensible and latent heat loads under the influence of consumers’ movement.
2.
EXPERIMENTAL PROCEDURE
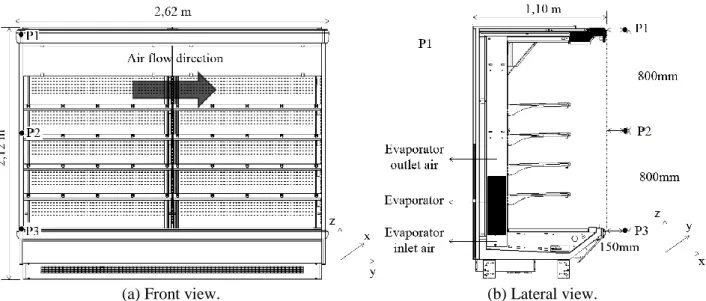
Tests were conducted in an environmental test chamber (see Figure 1) constructed according to ISO 23953 (2005), which indicates that air movement shall be provided in order to repeat field conditions. The test chamber operates on climate class n.er 3 where the ambient air has a temperature of 25°C with 60% of relative
humidity (RH). The air movement shall be horizontal and parallel to the plane of the VORDC opening with a velocity of 0.2 ms-1 when it is turned off. The cooling equipment selected for the experiments is an VORDC
(2.62m×1.10m×2.12m) with dual air curtain (see Figure 2 and Figure 3) used for displaying meat products, which temperature should be maintained between -1 °C and 5 °C (ISO 23953-2:2005 class M1). Consumers’ movement is simulated using a robotic mannequin (MARIA - Mannequin for Automatic Replication of the
Interference in the Air curtain) shown in Figure 3a that systematically passes in front of the VORDC.
Experimental tests (ET) are performed for translational velocity from 0.0 ms-1 to 0.8 ms-1 in velocity steps of
0.2 ms-1 and considering a cycle time of 150 sec (each passage in front of the VORDC) during 12 hours per
day (store open). These ET were named sequentially ET.0.x to ET.4.x corresponding to MARIA velocity steps. Additionally, MARIA movement was performed for two conditions: moving toward (T) or against (A) the airflow of the test room. These ET were respectively named ET.x.T and ET.x.A.
Figure 1. Environmental test chamber with MARIA.
(a) Front view. (b) Lateral view. Figure 2. Vertical open refrigerated display case dimensions and sensors location.
In order to simulate the supermarkets reality, each test period lasted 24 hours divided in two different periods: 12 hours with MARIA on (simulating an open store) as shown in Figure 3 a) and 12 hours with MARIA off (simulating closed store). Data acquisition related to air temperatures, relative humidity, and velocity was conducted at 1-minute intervals in order to analyse variations of these values over time. To measure physical parameters on the R22 refrigerant side and external airflow velocity, data was collected according to the recommendations provided by ISO 23953 (2005). The airflow measuring points (P1, P2 and P3) are shown in Figure 2). To measure physical quantities on the airside, sensors were positioned at 5 equidistant points from the air inlet and outlet along the length (y) of the evaporator (Figure 3 b). Thus, the evaporator was divided into 5 virtual control volumes (CV), so that air temperature, humidity and velocity in each CV are considered constants (see Figure 3 b).
The mass of water condensed during defrost was manually collected and measured during each test period. The outlet mass flow of the liquid coolant that passed through the evaporator during each operating period was monitored by a Coriolis flow monitor.
(a) MARIA. (b) Division of evaporator into virtual CVs. Figure 3. VORDC’s experimental setup details.
3.
MATHEMATICAL MODEL
The total heat load of the cooling system on the refrigerant fluid side, QTOT, is determined by calculating the difference in enthalpies between inlet, ir,i, and outlet, ir,o, and the mass flow of the liquid refrigerant, mr, as described in ISO 23953 (2005) and shown in eq. (1).
r,o r,i
r TOT m i i
Q (1)
A frequency inverter was used to maintain the compressor suction pressure constant and was not used any kind of temperature control in the VORDC, i.e., the cooling system operates without cycling.
In order to determine the total heat load and its components on the airside, the airflow rates and the condensation and freezing rates of water for each cooling cycle were determined. Considering uniform rates of outflow for each CV, and using the values for velocity, Va, and density,a, of air in the inlet and outlet areas
of the evaporator of cross section, A, obtained by experimental sampling based on the principle of conservation of mass, the mass flow of air, ma, was obtained by eq. (2).
A V ρ
ma a a (2)
Using the values of air temperature and relative humidity at the inlet and outlet areas of the evaporator, absolute humidity of the air in each of the situations was measured using psychrometric concepts, a,i and a,o,
respectively. Thus, using eq. (3), the mass flow of condensed water is determined for the period in which the refrigeration was turned on,mw,OP, and for the period in which the refrigeration was turned off, mw,DEF. The mass flow of water collected in experimental sampling during the defrosting period, mw,EXP, given by eq. (4) is the sum of the mass flow of ice formation on the evaporator during the operation period, mI, and mw,DEF. A small part of the mw,OP was drained without freezing. This mass flow, mw,DRAIN , is determined by eq.(5).
a,i a,o
a w m m (3) DEF w, I EXP w, m m m (4) I OP w, DRAIN w, m m m (5)The components of heat load can be determined according to GAS Research Institute (2000).
4.
ANALYSIS AND DISCUSSION OF RESULTS
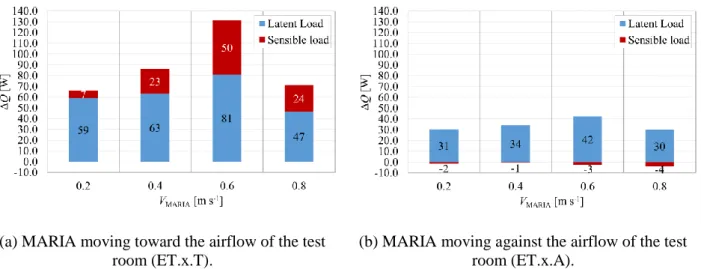
This section includes the analysis of test results for the different ETs. Figure 4 shows the heat load (sensible and latent) variation for the experimental tests depending on MARIA translational velocity. Figure 4 a) shows the experimental results for MARIA moving toward the airflow of the test room (ET.x.T) while Figure 4 b) shows the experimental results for MARIA moving against it (ET.x.A).
(a) MARIA moving toward the airflow of the test room (ET.x.T).
(b) MARIA moving against the airflow of the test room (ET.x.A).
Figure 4. Heat load (sensible and latent) variation for the experimental test depending on translational velocity.
The values variation is relative to the reference test case: ET.0.Stop, i.e., for the VORDC considering that MARIA is stopped in the test chamber. As shown in Figure 4 the latent heat load is always higher than the sensible heat load and the total heat load increases with MARIA translational velocity until 0.6 ms-1, despite
the direction of MARIA translational movement. When MARIA velocity is 0.8 ms-1, the total heat load
decreases due to the short interaction time with the air curtain, i.e., there is a relation between MARIA velocity (interaction time) and the perturbation of the air curtain of the VORDC. The perturbation of the air curtain is higher for low MARIA velocity. Thus, it is possible to assume that the critical consumers’ velocity is 0.6 ms -1. Additionally, the heat load is higher when MARIA is moving toward the test room airflow. Hence, the cold
air dragging effects are more significant on this situation. The influence of MARIA movement against the test room airflow is too low, thus the latent heat load increases and the sensible heat load is approximately constant. The increase on the total heat load relative to the reference test is 2.8% when MARIA is moving toward the test room airflow at 0.6 ms-1.The percentage of the latent heat load is between 41%-42% of the total heat load
for any configuration of MARIA movement.
Figure 5 shows the variation of frost and water masses with MARIA velocity. For increasing MARIA velocity, Figure 5 a) shows the decrease on frost formation in relation to the reference test case while Figure 5 b) shows the increase on the total condensed water mass on the evaporator fins in relation to the reference test case. Thus, less frost is formed as MARIA disturbs the air curtain but meanwhile more condensate is extracted. The critical velocities are 0.6 ms-1 and 0.8 ms-1 when MARIA moves respectively against and toward the test room
airflow. At experimental test ET.3.A, i.e., with MARIA moving against the test room airflow at a velocity of
VMARIA = 0.6 ms-1, the total condensed water mass is 56 kg and 41.9 kg of it is frosted at the evaporator. There
is 1.7% more water and 1% less frost when compared with ET.0.Stop.
(a)
Variation of frost mass.
(b)Variation of condensate water mass.
Figure 5. Variation of frost and water masses with MARIA translational velocity.
The maximum (after defrost) and minimum (before defrost) mass airflow rate at the evaporator coil was measured. Figure 6 shows the variation of these values with MARIA translational velocity.
(a) Minimum airflow (before defrost). (b) Maximum airflow (after defrost). Figure 6. Airflow variation with MARIA translational velocity.
The value of the maximum mass airflow rate for the reference test case (MARIA stopped) was 1493 kg h-1 and
the minimum was 1013 kgh-1 (m
a = 480 kgh-1). When MARIA is moving, the difference between the
maximum and minimum mass airflow rate was always more than in the reference configuration. Thus, it is possible to conclude that when there are disturbs on the air curtain there is less air circulating on the VORDC due the higher pressure drop provided by the condensed water on the evaporator.
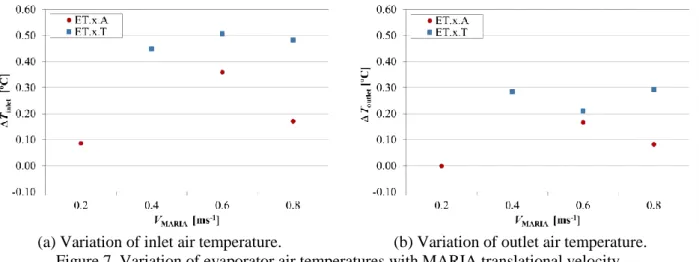
Figure 7 shows the average variations of the (a) inlet and (b) outlet evaporator air temperatures.
(a) Variation of inlet air temperature. (b) Variation of outlet air temperature. Figure 7. Variation of evaporator air temperatures with MARIA translational velocity.
The value of the inlet temperature for the reference test case (MARIA stopped) was 5.1 °C and the outlet air temperature was -3.2 °C ( = 8.3 °C). For any other configuration, the inlet, outlet and the difference between inlet and outlet temperatures was always higher than for the reference configuration. Therefore, the temperature inside the VORDC is higher when MARIA moves and, consequently, there are more condensed water and less frost formation on the evaporator. The inlet air temperature is higher when MARIA reaches 0.6 ms-1 (maximum heat load). This condition does not occurs for the outlet air temperature. When MARIA
has a velocity of 0.6 ms-1 toward the test room airflow, the inlet air temperature (5.6 °C) and the difference
between inlet and outlet temperatures are higher than others configurations ( = 8.6 °C) because there is a lower airflow circulating on the evaporator.
The main conclusion of Figures 4 to 7 are: (1) the heat load is not significant affected by MARIA. The latent heat load is always more significant affected than the sensible heat load. (2) The critical tested velocity of MARIA was 0.6 ms-1. (3) The condensed water mass increases and the frost formation decreases as MARIA
disturbs the air curtain. (4) The average air temperatures are higher than in the reference test case because MARIA disturbs the air curtain allowing the entrainment of more ambient air inside the VORDC. (5) The airflow is always lower than in the reference test case because there are always more condensed water on the evaporator when MARIA moves. (6) MARIA translational velocity toward the test room airflow enhances the drag of cold air from the VORDC when compared with the movement against the test room airflow.
5.
CONCLUSIONS
This experimental study quantifies latent and sensible heat loads, the condensed and frosted water mass, the airflow reduction and variation of evaporator air temperatures due to the air curtain interference by consumers passing in front of the VORDC. The tests were performed on a VORDC using a robotic mannequin (MARIA - Mannequin for Automatic Replication of the Interference in the Air curtain) that systematically passed in front of the VORDC, towards and against the airflow of the test room, with translational velocity from 0.2 ms -1 to 0.8 ms-1, with 0.2 ms-1 steps. The analysis of the experimental results provided the following conclusions:
(1) The heat load is not significant affected by MARIA movements (up to +2.8%). The latent heat load is more significant affected than the sensible load. (2) The time of disturbing the air curtain decreases as MARIA velocity increases, being determined a critical tested velocity of MARIA of 0.6 ms-1. (3) The condensed water
mass increases and the frost formation decreases as MARIA disturbs the air curtain because the average air temperatures are higher and the airflow is lower than in the reference test case. (4) The MARIA translational velocity toward the test room airflow causes more expressive reduction of the overall performance of the evaporator than it moves against the test room airflow due the higher thermal and mass interactions on the air
curtain. Thus, MARIA moving toward the test room airflow enhances the drag of cold air from the vertical open refrigerated display case.
These results can help manufacturers to develop evaporators that able of reducing the negative effects of consumers’ motion within the store through defrost control, new design of fins and tubes and airflow regulation. In countries where most of the equipment are still open to the ambient air this research path can represent a significant energy reduction. These results are part of a more complex evaluation of the air curtain interference by humans to be used in the development of new products on an industrial scale.
6.
REFERENCES
Aljuwayhel NF, Reindl DT, Klein SA, Nellis GF. 2008, Experimental investigation of the performance of industrial evaporator coils operating under frosting conditions, International Journal of Refrigeration 31(1):98-106.
ASHRAE. 2010, ASHRAE Handbook: Refrigeration, American Society of Heating, Refrigerating and Air Conditioning Engineers (ASHRAE), Inc.
Faramarzi R. 1999, Efficient display case refrigeration, ASHRAE Journal 4(11): 46–51.
Faramarzi R. 2000, Analyzing air curtain performance in refrigerated display case, Proc. ASHRAE Annual
Meeting.
Garcia JM, Coelho, LMR. 2010, Energy efficiency strategies in refrigeration systems of large supermarkets,
International Journal of Energy and Environment 4(3):63-70.
GAS Research Institute. 2000, Investigation of relative humidity impacts on the performance and energy use of refrigerated display cases, Final Report.
Gaspar PD, Gonçalves LC, Ge X. 2010a, CFD parametric study of ambient air velocity magnitude influence in thermal behaviour of open refrigerated display cabinets, Proc. ECCOMAS CFD 2010, Lisbon, Portugal.
Gaspar PD, Gonçalves LC, Ge X. 2010b, Influence of ambient air velocity orientation in thermal behaviour of open refrigerated display cabinets, Proc. ASME ESDA 2010, Istanbul, Turkey.
Gaspar PD, Gonçalves LC, Pitarma RA. 2011, Experimental analysis of the thermal entrainment factor of air curtains in vertical open display cabinets for different ambient air conditions, Appl Therm Eng 31(5):961-9.
Gaspar PD, Gonçalves LC, Pitarma RA. 2012a, Detailed CFD modelling of open refrigerated display cabinets,
Modelling and Simulation in Engineering, vol. 2012, Hindawi Publishing Corporation.
Gaspar PD, Gonçalves LC, Pitarma RA. 2012b, CFD parametric studies for global performance improvement of open refrigerated display cabinets, Modelling and Simulation in Engineering, vol. 2012, Hindawi Publishing Corporation.
Heidinger GG, Nascimento SM, Gaspar PD, Silva PD. 2013, Impact of environmental conditions on the performance of open multideck display case evaporators, Proc. ICCC 2013, IIR, Paris, France.
Heidinger GG, Nascimento SM, Gaspar PD, Silva PD. 2014a, Impact of external air currents on the performance of open multideck display case evaporators in laboratory conditions, Proc.
FLUIDSHEAT'14, Lisbon, Portugal.
Heidinger GG, Nascimento SM, Gaspar PD, Silva PD. 2014b, Influence of the test procedure for setting the external air movement on the thermal performance of open multideck display case, Recent Advances in
Mechanical Engineering 11:96-104.
Heidinger GG, Nascimento SM, Gaspar PD, Silva PD. 2015, Variation of the thermal performance of open multideck display case due to the procedure of setting the external air velocity, International Journal of
Energy and Environment 9, 2015:73-82..
ISO 23953-1. 2005, Refrigerated display cabinets, International Organization for Standardization (ISO). Nascimento SM, Heidinger GG, Gaspar PD, Silva PD. 2013a, Experimental evaluation and qualitative increase
of thermal load in open refrigerated display cases due to breakage of the air curtain, Proc. ICCC 2013, IIR, Paris, France.
Nascimento SM, Heidinger GG, Gaspar PD, Silva PD. 2013b, Experimental quantitative evaluation of thermal performance in refrigerated displays case with variation of the thickness of the air curtain and perforation density of the back panel, Proc. ICCC 2013, IIR, Paris, France.
Nascimento SM, Heidinger GG, Gaspar PD, Silva PD. 2014a, Performance variation of vertical open refrigerated display cases in-situ operation and testing according to ISO and ASHRAE standards, Proc.
ICCC 2014, IIR, London, United Kingdom.
Nascimento SM, Heidinger GG, Gaspar PD, Silva PD. 2014b, Experimental study of the interference in air curtains due to the parallel transfer in front of refrigerated display cases, Proc. ASME ESDA 2014, Copenhagen, Denmark.
Tassou SA, Datta D. 1999, Influence of supermarket environmental parameters on the frosting and defrosting of vertical multideck display cabinets, ASHRAE Transactions 105(1):491-496.
Wang CC, Fu WL, Chang CT. 1997, Heat transfer and friction characteristics of typical wavy fin and tube heat exchangers, Experimental Thermal Fluid Science 14(2):174–186.
Wang CC, Hwang YM, Lin YT. 2002, Empirical correlations for heat transfer and flow friction characteristics of herringbone wavy fin-and-tube heat exchangers, International Journal of Refrigeration 25(5): 673– 680.
Wang CC, Lin YT, Lee CJ, Chang YJ. 1999, Investigation of wavy fin-and-tube heat exchangers: a contribution to databank, Experimental Heat Transfer 12(1):73–89.