Joao man I!I R.5. Tau
rl!5
CRC Press/Balkema is lfll illlpriJIt (~r ffIe Taylor & Froncis GruIlP, cm informa bllsiness
© 2012 Taylor & Francis Group, London, UK
Typeset by Vikatan Publishing Solutions (P) Ltd. , Chennai, India Printed and bound by CPI Group (UK) Ltd, Croydon, CRO 4YY
Ali rights rcscrvcd. No part of this publication or the information contained herein may be reproduced , stared in a retrieval system, ar transmitted in any form ar by any means, electronic, mechanical, by photacapying, rccarding ar atherwise, withaut written prior permission from the publisher.
AIthough ali care is takcn ta ensure integrity and the quality of this publication and the information herein , no responsibi!ily is assumed by the publishers nor the author for any damage to the property or persons as a result Df operation or use of this publication and/or the information contained herein.
Published by: CRC Press/Balkema
P.O. Bo, 447, 2300 AK Leidcn, Thc Nctherlands e-mai!: [email protected]
www.crcpress.com - www.taylorandfrancis.co.uk - www.balkema.nI
ISBN: 978-0-415-68395-1 (Hbk) ISBN: 978-0-203-12818-3 (eBook)
PROCEEDINGS OF VIPIMAGE 2011 - THIRD ECCOMAS THEMATIC CONFERENCE ON COMPUTATIONAL VISION AND MEDICAL IMAGE PROCESSING, OLHÃO, ALGARVE, PORTUGAL, 12-14 OCTOBER 2011
ComputationaI Vision and MedicaI
Image Processing
VipIMAGE 2011
Editors
João Manuel R.S. Tavares & R.M. Natal Jorge
Faculdade de Engenharia da Universidade do PorIa
PorIa, Portugal
o
~Y~~F;'~~~~oup
Boca Rilton london New York LeidenComputational Vision and Medicallmage Processing - Tavares & Natal Jorge (eds)
© 2012 Taylor & Francis Group, London, ISBN 978-0-415-68395-1
Flow of Red B100d Cells through a microfluidic extensional device:
An image analysis assessment
T.
Yaginuma, A.1. Pereira &P.J.
RodriguesESTiG. IPB, eSta. Ap%llia. Bragllllçu. Portugal
R. Lima
ESTiO, IPB. C. S1a. ApoIO/lia, Bragal/ca. Porlllga!
CEFT. FEUP. R. DI: Roher/o Frias, Porto. Por/liga!
M.S.N. Oliveira
CEFT. FEUP. R DI: Roberto Fria l~ Pono. Purtugal
T.lshikawa
Del'amllell/ oI Bioellgillceril/g alld Robotk.l'. Gradullte SdlOof (~r EIIgilleerillg, Tohókll Ullil'cr.l'ify, Aoba,
Sem/ai. lapall
T. Yamaguchi
Depor/l/JelJl oJ Biolllf.'dh:al EllgiIJeerillg, Gradua/c SdlOol uI Ellgillcerillg. To/wkll Ullirel"siIy, Aoba,
Sem/ai, Jal'llll
ABSTRACT: The present study aims to assess the deformability of Red Blood Cells (RBCs) under extensionally domin<lted microOuidic nows using an image based technique. For this purpose, a micro-channel having a hypcrbolic shapcd-eontraction was used and the images \Vere capturcd by a standard high-spced microscopy system. Thc images acquircd display RBCs with various light intensity leveis and image analysis was used to quantiCy the DeCormation Index (DI) of lhe RBCs considering thcse light intcnsity diffcrcnecs. Additionally, the velocities of difTerent intensity-Ievel RBCs Oowing along the ccn-tcrline of the channel \Vere rneasured using particle tracking velocimetry. The preliminary results at two difTerent now rales rcveal a highly deformable nature of RBCs when submittcd to strong extcnsional flo\Vs. lt was a1so obscrvcd that lhe low intensity cells cxhibit a slightly highcr velocity than intermcdiate inlensily cells. which \Ve attribute to the cells being loeatcd in different planes.
INTRODUCTlON
Red B100d Cells (RBCs) are known as a highly derormable blood component that plays an importunt role in delivering oxygen to lhe tis-sues in microcireulation. According to Mokken et aI. (1992) the capacity of RBCs to deform is relatcd to three main eharacteristics: lhe viscoe-lastic properties of its mernbrane; the high surface area-to-volume ratio associated with its biconcavc diseoid shapc; and the viscosity or its intraeellu-lar solution. A variation of any of these factors can have a significant impact on RBC derorm-abiliLy leading to serious hcahh conscqucnces. In particular a deereasc in RBC deformability can result in impaired perrusion or lhe peripheral tissues. Furthermorc, it has been reported that the elastic characteristics as well as lhe shape or RBCs are important faetors to explain the etiology
217
--'-
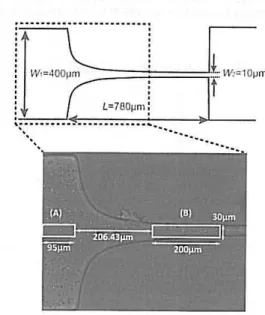
---Figure i. Gcamelry and dimensians af the PDMS hyperbaiic microchannei.
Typically, lhe irnages captured by standard microscopy systems using a high speed camera display RBCs with various light intensity leveis, but to the best 01' our knowledgc, few studies have considcrcd this difTerence in the analysis. Therefore, our investigation on RBC behavior is based on an image analysis performed considering the differ-ent RBC intensity leveIs. Thc results obtained for different flow rates indicate the highly deformable nature of RBCs under strong extensional flows.
2 MATERIALS AND METHODS
2.1 Wo/'kiJlg jluids mui f1licroclu11lnel geof1lClly
The working fluid examined was composed of Dextrao 40 (Dx40) cootaining -1 % of human RBCs (i.e .. hematocrit, Hcl- I%). The blood used was collected from a healthy aduIt volunteer, and EDTA (ethylenediaminetctraacetic acid) was added to the collected samples to prevent coagu-latioo. Thc blood samples \Vere then submitted to washing and centrifuging processes and were then stored hermetically at 4°C until the experiments were performed at a temperature of -37"C. Ali procedures were carried out in compliance with lhe guidelines of the Ethics Committee 00 ClinicaI
Tovestigation of Tohoku University.
The microchannels containing the hyperbolic contraction were produced in polydimethylsiloxaoe (PDMS) using slandard soft-lithography lechniques
using a high-resolutioo chrome mask. Thc geometry and dimensions of lhe micro-fabricated channels are shown in Fig. 1. The channel depth, 11, was constant lhraughout lhe PDMS chip and the lVidlh of the upstream aod downstream channcls was the same,
rV
I = 400 Jlm. The minimum width in thecontrae-tion region is W2 = 10 J.lm, dcfining a total Hench.)'
strain of EH = In( W,I W,) = In(40).
For the microfluidic expcriments, the channels were placed on the stage of an inverted microseope (IX71 , Olympus, Japan) and the temperalure of lhe stage was adjustcd by means 01' a thermo plate contraller (Tokai Hil, Japan) to 37"C. The now rate of the working fluids was eontrolled using a syringe pump (KD Scienlific Inc., USA), and two different flow rates \Vere examined: 9.45 JlL/min and 66.15 JlL/min. The images of the flowing RBCs were eaptured using a high speed eamera (Phantom v7.1 , Visidn Research, USA) and trans-ferred to the compute r to be analyzed. An illustra-tion of the experimental set-up is shown in Fig. 2.
2.2 llllage ana/ysis
The original data obtained from the experiments are lhe digital video sequenees captured at the frame rate of 4800 frames/s with the exposure time 01' 2 Jls. This corresponds to the frame intervals of 208 Jls. For the image analysis, firstly, the captured videos were converted to a sequence of static images (stack), with a rcsolution of 800 x 600 pixels each.
Then, in order to reduce the dust and static arti-faets in the images, an averaged background image was created from the original images and subtracted from the staek. This process eliminates alI the static objects from the images including the microehannel walls, which resulted in imagcs having only the flow-ing RBCs visible. To enhance the image quality, image
Syringe
High Speed Camera r-:-::::;".. ,..rI
Invo!rted Mlcroscope
:Iry are am Lhe ne, ac-"1' eis 'pe of lIe )\V
: a
vo
jn ag ra <S-a-,
Is'o
10 ,f d :s ,-c j c :1filtcring such as A'lediall operation with lhe mask
size cf 3 x 3 pixels and Briglu1/esslColllrllSf
adjust-menl \Vas applicd lIsing Imagel (NIH). Finally, lhe grey scale images \Vere converted lo binary images adjusting lhe Ihroshold leveI. Imagel default
Ihresh-old method based 00 Iso Data method was applied
fiest and Lhen lhe leveI was adjusted manually for lhe optimal binarizalion. For instance., lhe ImageJ
default threshold sel lhe mino value as O and lhe ma.'{.
value as 68 aUlomaLically for lhe images af now rale
9.45 J.1L/m in , but lhe max. value was slightly raised to
70 manually in order to obtain bettcr binary images
to analyze. This mcans lhe pixels with intcnsity leveis in the range of 0- 70 \Vere sei to be O (blaek) and the
pixels with intcnsity leveis grcater lhan 70 \Vere set to be 255 (white). This segrnentation process yields regions of interesl with RBCs as black circular objects (wilh or withoul holes inside) againsl a while background. More details about the intensity leveis of lhe RBCs are described in Section 3.2.
To analyze lhe deformation indcx, the cclIs were measured in two pre-defincd regians, (A) and (B) as shawn in Fig. I. Region (A) is lacatcd upstream of the hyperbolic contraction and regian (B) com-prises a narrow part of the contraction region. Both regions are located axially along lhe center-line of lhe channel.
The nowing ceUs selecled for measurement in regiDo (A) were lracked and idenlified in region (B).
In other words, lhe same cells were measured twice, once in region (A) and anolher in region (B) in order to examine the DI transition of identicaJ cells.
The AJI(I~JI=e Par/icles function in ImageJ (NIH) was used for measuring lhe ceUs dimensions. This command counts and measures objccts in binary irnages according to the pre-defined measurement seUings (e.g. centroid, width, length, etc.). Some parameters such as Area and OrclIlarity are use-fui to ignore oUI-of-interesl objecls. In lhe cur-rent work, lhe arca of lhe objects was limitcd to
17-50 ~m ' and lhe circularity to 0.5-1.0. These settings reasonably ignore lhe apparcnt deviant objects such as out-of-focus ceUs, aggregated celIs, and so on.
FinaUy, lhe RBC deformation was characterized by lhe deformation index
(DO
as (A .1/ ... - 11 ,11I/l0l')1(A .1/"jor + A Mnkl')' where A ,\fdjat and A U m,or refer to the
major (primary) and minor (secondary) axis lengths of the ellipse best fitted to the cell. These values were obtained by the measuremenls obtaincd with
Ana/y::e Pa/'tides operation.
3 RESULTS AND OISCUSSION
3. 1 Dejormatioll imle.\'
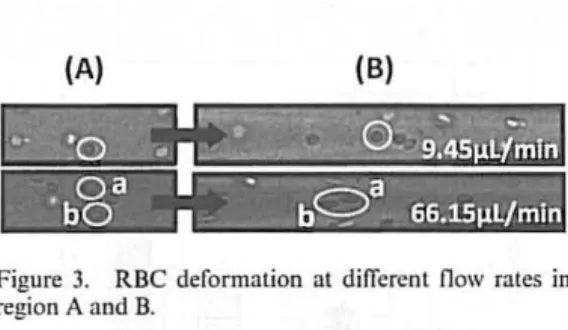
Fig. 3 shows RBCs nowing through lhe POMS hyperbolic microchannel in original imagcs at
219
(A)
(B)
Figure 3. RBC derormaLion aL dirrcrcnL now rates in region A and B.
difTcrenl now rales (9.45 ~I/min and 66.15 ~lImin)
and in two pre-defined regions, (A) and (B). In Fig. 4 lhe averagc deformation index calculated based on lhe results of image analysis are shown for each case.
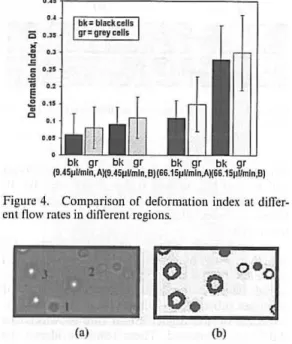
As can be seen in Fig. 4, for bOlh fiow rates, DI is highcr in lhe hyperbolic contraction region (B) where the RBCs are submitted to a strong exten-sional now. In lhe contraction region (B), DI increases substantially with the now rate as a con-sequence of the higher strain rate to which the RBCs are submitted. These results evidence lhe highly deformable nature of RBCs under strong extensional nows.
3.2 llltellsity lel'els
The images captured by a microscope with a high speed camcra display RBCs with various light intensity leveis (Fig. 5 (a». When these are con-verted to binary imagcs, they appear with rather difTerent shape/size (Fig. 5 (b»). In this study, we distinguished RBCs by three leveIs of light inten-sity, corresponding to low (black), intermediate (grey) and high intensity (white), and lhe average deformation index was calculated for each class of RBCs. However, the results in Fig. 4 show only the low and inlermediate intensity leveis RBCs, as high intensity levei cells were deemed to be oul of focus for DI to be accurate1y determincd- the dif-ferent shape af lhe white ceUs can be clearly seen in Fig. 5 (b).
In Fig. 4 it is dcar, that despi te lhe shape of lhe grey ceUs being slightly more e10ngaled than black cells. lhe dilTerenccs are not very significant.
G.U , -_ _ _ _ _ _ _ _ _ __ ---,
iS
..
o.,.~ o.)
.5 5
O.lS
~ G.2
~ G. lS
C
...
Figure 4. Comparison of deformation index at dinc r-ent now rates in difTerr-ent regions.
(a) (b)
Figure 5. (a) Original image conLaining RBCs wilh va r-ious intensities: I. low (black), 2. inLerrnediaLe (grey) and 3. high (white), and (b) Corresponding binary image.
...
lb)
x~
O 540
.... <:> ..p .. <5> ~'" $# .... .s>.f .;r"',:f ~<:>
,..<$'#
<t'"Distance in X axis (~m)
Figure 6. (a) Tracking of RBCs wilh difTcrcnt intensity leveis for velacity rneasurerncnts. (b) Axial velocity pro-files of lhe low and Ên terrnediate intensity RBCs along the ccnterline aI Q = 9.45 IlUmin.
volume iIlumination, in which the depth-of-focus is determined by the characteristics of objeclivc used . As a consequence, despite being ccnlered at lhe mid-plane of the channel where lhe ccll velocity is the highest, cells ai difTerent :-planes are also captured. In this case, we belicve lhat lhe black ceUs are not truly located at lhe mid-plane and therefore its velocity is slightly lowcr lhan lhat af lhe grey cells. Following these preliminary results, further investigation on the cell velocitics and deformation index in various regions of the microchannels under difTercnt flo\V conditions \ViII bc performed.
ACKNOWLEDGEMENTS
We thank Dr. Matsuki for help \Vith blood sample collection. Additionally, wc acknowledge the
finan-ciai support provided by 2007 GlobalCOE Program
"Global Nano-BME Education and Research Network", Japan. We are also thankful to FCT (Portugal) and COMPETE ror financiai support through projects PTDC/SAU-BEB/ I08728/2008, PTDC/SAU-BEB/105650/2008 and PTDC/EME-MFEl099I 09/2008.
REFERENCES
AbramofT. M. , Mage!haes, P. , Ram. S., 2004. Imagc processing with image. 1. Biophotonics Int. 11, 36-42. Dobbe, 1.0.0.. Hardcman, M.R., Streekstra, OJ ., Strackcc, I . Incc,
c.,
Grimbcrgen,c.A.,
2002. Analyzing red blood cell-deformabilily dislributions. Bload Cclls. Mal. Dis. 28, 373-384.Fujiwara, H., Ishikawa , T. Lima, R., Malsuk i. N., Imai, V .• Kaj i, H., Nishizawa, M. , Vamaguchi, T.,
2009. Red blood ceU molions in a high hematocrÊI bJood nowing through a stenosed micro-channcl.
J. Biomech. 42, 838-843 .
O ucguen , M. , Bidet, J.M ., Durand, F., Driss, F., JofTre, A., GeneteL, B., 1984. FilLralion pressure and red blood ccll dcfonnabilily: cvaluaLion af a new devicc: erythrometrc. Biorheology Suppl . 1, 261 -265.
Mokken, ECh., Kedaria, M., Henny, Ch.P., Hardcman. M.R., Gclb. A.\V., 1992. The clinicai importance of eryth-trocyte dcformability, a hemorrheological parameter, Ann. I-I cmalol. 64, 113- 122.
Oliveira, M.S.N., Alves, M.A., Pinho, F.T., McKin ley, G.H., 2007. Visco us now through microfabricalcd hypcrbolic contractions. Exp. Fluids. 43, 437-451.
Shelby, IP., Whitc. 1., Oanesan, K. , Rathod, P.K., Chiu, D.T., 2003. A micronuidic model for single-cell c.:apillary obstructio n by Plasmodium falciparum-infcctcd crythrocytcs. PNAS. 100, 1461 8- 14622. Shin, S., Ku, Y., Park, M.S., Suh, 1.5., 2004. Measurcment
a f red ceU defarmability and who le blood viscosity using Jaser-dilTractian Sli l rheorne ler. Korea-Australiu