M
ASTER IN
F
INANCE
M
ASTER
F
INAL
W
ORK
P
ROJECT
W
ORK
E
QUITY
R
ESEARCH
–
P
FIZER
I
NC
.
M
ARCOS
M
IGUEL
L
OURENÇO DOS
S
ANTOS
B
AIÃO
M
ASTER IN
F
INANCE
M
ASTER
F
INAL
W
ORK
P
ROJECT
W
ORK
E
QUITY
R
ESEARCH
–
P
FIZER
I
NC
.
M
ARCOS
M
IGUEL
L
OURENÇO DOS
S
ANTOS
B
AIÃO
S
UPERVISION OFM
ASTER’
ST
HESIS:
D
R.
F
ERNANDOF
ELIXC
ARDOSOABSTRACT
Pfizer Inc is a leading company in manufacture and sale of biopharmaceutical products with a global portfolio that includes medicines and vaccines as well as many of the world's best known consumer health care products. In recent years, the company has grown by mergers and acquisitions. In February 2015, Pfizer acquired Hospira, Inc., the world’s leading provider of injectable drugs and infusion technologies and a global leader in biosimilars.
The goal of this project is to determine the intrinsic value of Pfizer´s shares through a detailed analysis of the company’s operational and financial performance as well as the industry sector and macroeconomic environment. The valuation method used to determine Pfizer´s intrinsic value was the Free Cash Flow to the Firm method which, according to the literature review, is the most appropriate method given the company´s characteristics.
According to the assumptions defined, Pfizer has a terminal value of $249.380,2 million, with a present value of $223.412,6 million using, as discount rate, the weighted average cost of capital of 8,89%. Currently the company has $6.167,4 million outstanding shares which leads to a share price of $36,23. Given Pfizer’s current share price of $33,18 the share price is undervalued.
Keywords: Company Valuation, Discounted Cash Flow, Enterprise Value, Free Cash
RESUMO
A Pfizer Inc é uma empresa líder no desenvolvimento e comercialização de produtos biofarmacêuticos com um portfólio global que inclui medicamentos e vacinas, bem como diversos produtos de cuidados de saúde mundialmente conhecidos. Nos últimos anos, a empresa tem crescido essencialmente através de fusões e aquisições. Em fevereiro de 2015, a Pfizer adquiriu a Hospira, Inc., líder mundial na comercialização de medicamentos injetáveis e tecnologias de infusão, bem como no desenvolvimento de biosimilares.
O objetivo deste projeto é determinar o valor intrínseco das ações da Pfizer através de uma análise detalhada do desempenho operacional e financeiro da empresa, assim como da indústria e ambiente macroeconómico em que se insere. O método de avaliação usado para determinar o valor intrínseco da Pfizer foi o método do Free Cash Flow to the Firm, o qual, de acordo com a literatura, se apresenta como o modelo mais adequado dadas as características da empresa.
De acordo com os pressupostos assumidos, a Pfizer tem um valor final de $249.380,2 milhões que, atualizado ao custo médio ponderado do capital de 8,89%, corresponde a um valor atual de $223.412,6 milhões. Atualmente a empresa tem $6.167,4 milhões de ações disponíveis à negociação, o que leva à obtenção de um preço da ação de $36,23. Tendo em conta que o preço atual da ação da Pfizer é de $33,18, pode-se concluir que o preço da ação se encontra subvalorizado.
Palavras-Chave: Avaliação de Empresas, Cash Flow Atualizado, Valor da Empresa,
ACKNOWLEDGMENTS
To Professor Fernando Felix Cardoso, supervisor of this project, my gratitude for the availability, critical spirit and guidance throughout this work.
To my friends and co-workers for their tolerance, understanding and motivation. Last but not least, to my family, for the encouragement and unwavering support.
INDEX ABSTRACT ... I RESUMO ... II ACKNOWLEDGMENTS ... III INDEX ... IV INDEX OF FIGURES ... VI INDEX OF EQUATIONS ... VII INDEX OF TABLES ... VIII ABBREVIATIONS AND ACRONYMS ... IX
1. INTRODUCTION ... 1 1.1. Framework 1 1.2. Project Structure ... 2 2. LITERATURE REVIEW ... 2 2.1. Valuation Concept ... 2 2.2. Valuation Methods ... 3
2.2.1. Discounted Cash Flow ... 4
2.2.2. Relative Valuation ... 8
2.2.3. Contingent Claim Valuation ... 10
2.2.4. Balance Sheet Based Valuation ... 11
3. COMPANY’S PRESENTATION ... 11
3.1. Company Structure ... 12
3.2. Company´s Business ... 14
3.3. Operational and Financial Performance ... 14
3.4. Strategic Analysis ... 17
3.4.1. Porter’s Five Forces Analysis ... 17
3.4.2. SWOT Analysis ... 17
4. MACROECONOMIC ENVIRONMENT AND INDUSTRY SECTOR ... 18
4.1. Macroeconomic Environment ... 18 4.2. Industry Sector ... 20 5. VALUATION ... 26 5.1. Methodology ... 26 5.2. Assumptions ... 27 5.2.1. Net Income... 27
5.2.1.1. Sales & Services Revenue ... 27
5.2.1.2. Cost of Revenue ... 27
5.2.1.4. Non-Operating Income (Loss) ... 28
5.2.1.4.1. Net Interest Expenses ... 28
5.2.1.4.2. Other Non-Op (Income) Loss ... 28
5.2.1.5. Income Tax Expense (Benefit) ... 28
5.2.1.6. Minority Interest ... 28
5.2.2. Free Cash Flow ... 29
5.2.2.1. Depreciation & Amortization ... 29
5.2.2.2. Change in non-cash Working Capital ... 29
5.2.2.3. Capital Expenditures ... 29
5.2.3. Weighted Average Cost of Capital ... 29
5.2.3.1. Cost of Equity ... 30
5.2.3.1.1. Risk-Free Rate ... 30
5.2.3.1.2. Beta ... 30
5.2.3.1.3. Market Risk Premium ... 30
5.2.3.2. Effective Tax Rate ... 31
5.2.3.3. Cost of Debt ... 31
5.2.3.4. Capital Structure ... 31
5.2.3.5. Perpetual Growth Rate... 31
5.2.3.6. Gordon Growth Model ... 32
6. VALUATION RESULTS ... 33 7. RELATIVE VALUATION ... 34 8. SENSITIVITY ANALYSIS ... 35 9. CONCLUSION ... 36 REFERENCES ... 37 APPENDIX ... 40
Appendix 1 – Porter’s Five Forces Analysis ... 40
Appendix 2 – SWOT Analysis ... 43
Appendix 3 – Revenues ... 46
Appendix 4 – Cost of Revenues ... 46
Appendix 5 – Operating Expenses ... 46
Appendix 6 – Interest Income ... 47
Appendix 7 – Interest Expenses ... 47
Appendix 8 – Net Interest Expenses (Income) ... 48
Appendix 9 – Other Non-Op (Income) Loss ... 48
Appendix 10 – Income Tax Expense (Benefit) ... 48
Appendix 11 – Minority Interest ... 48
Appendix 12 – Depreciation & Amortization ... 49
Appendix 13 – Working capital ... 49
INDEX OF FIGURES
Figure 1 – Business Segments ... 12
Figure 2 – Geographic Segments... 13
Figure 3 - Geographic Ownership ... 13
Figure 4 – Revenues ... 14
Figure 5 – SI&A ... 15
Figure 6 – Operating Income ... 16
Figure 7 – Porter’s Five Forces ... 17
Figure 8 – SWOT Analysis ... 17
Figure 9 – Top Biotech and Pharmaceutical Companies based on Revenue ... 20
Figure 10 – Research and Development Process... 21
Figure 11 – Phases of Development ... 22
Figure 12 – Drugs Development by Sector ... 22
Figure 13 – PhRMA Member Company R&D Investment ... 23
Figure 14 – Prescription Drug Spending Growth ... 23
Figure 15 – Generic Share of Prescriptions Filled ... 24
Figure 16 – Average Generic Share of Total Use Following Launch of a Brand Medicine’s First Generic ... 24
Figure 17 – Share of Total Business R&D by Industry, 2011 ... 25
Figure 18 – R&D Expenditures per Employee by Industry ... 25
Figure 19 – US Biopharmaceutical Goods Exports... 26
INDEX OF EQUATIONS
Equation 1 – Free Cash Flow to the Firm ... 4
Equation 2 – Firm Value ... 5
Equation 3 – Weighted Average Cost of Capital ... 5
Equation 4 – Free Cash Flow to Equity ... 5
Equation 5 – Equity Value... 6
Equation 6 – Gordon Growth Model ... 6
Equation 7 – Economic Value Added ... 7
Equation 8 – Market Value Added ... 7
Equation 9 – Value of Levered Firm ... 8
Equation 10 – Capital Asset Pricing Model ... 30
Equation 11 – Cost of Debt ... 31
INDEX OF TABLES
Table I – Valuation Methods ... 3
Table II – Pfizer’s Capital Structure ... 13
Table III – Pfizer Commercial Structure ... 14
Table IV – Cost of Sales as Percentage of Revenue... 15
Table V – R&D Expenses as Percentage of Revenue ... 15
Table VI – Amortization of Intangible Assets as Percentage of Revenue ... 16
Table VII – Effective Tax Rate ... 16
Table VIII – United States GDP and Inflation Forecast ... 18
Table IX – Europe GDP and Inflation Forecast ... 18
Table X – Emerging Markets GDP and Inflation Forecast ... 19
Table XI – World GDP and Inflation Forecast... 19
Table XII – US Dollar Index Forecast... 20
Table XIII – Valuation Results ... 33
ABBREVIATIONS AND ACRONYMS
ABVTC – Accounting Book Value of Total Capital APV – Adjusted Present Value
C – Cost of Capital
CAPM – Capital Asset Pricing Model D&A – Depreciation and Amortization DCF – Discounted Cash Flow
DDM – Discount Dividend Model
EBITDA – Earnings before Interest, Taxes, Depreciation and Amortization EM – Emerging markets
EV – Enterprise Value
EVA – Economic Value Added FCFE – Free Cash Flow to Equity FCFF – Free Cash Flow to the Firm FCInv – Investment in Fixed Capital FDA – Food and Drug Administration Fed – Federal Reserve
GDP – Gross Domestic Product
GEP – Global Established Pharmaceutical GGM – Gordon Growth Model
GIP – Global Innovative Pharmaceutical segment IMF – International Monetary Fund
Int – Interest Expense
MVA – Market Value Added
MVCE – Market Value of Common Equity MVD – Market Value of Debt
NCC – Net Noncash Charges
NI – Net Income Available to Common Shareholders PBV – Price-to-Book Value
PER – Price-to-Earnings Ratio
NOPAT – Net Operating Profit After Taxes R&D – Research and Development
SI&A - Selling, Informational and Administrative
SWOT – Strengths, Weaknesses, Opportunities and Threats TC - Total capital
VOC - Global Vaccines, Oncology and Consumer Healthcare WACC – Weighted Average Cost of Capital
WCInv - Investment in Working Capital
1. INTRODUCTION 1.1. Framework
The aim of this Master’s Thesis is to find the intrinsic value of Pfizer’s Inc. (Pfizer) shares using the most adequate valuation model given the characteristics of the Pharmaceutical industry and special features of the company. Regarding asset valuation, skeptical minds can argue that the market price of an equity security perfectly reflects or represents the best available estimation of its intrinsic value. An important theoretical counter to the previous notion can be found in the Grossman-Stiglitz paradox.
“If market prices, which are essentially freely obtainable, perfectly reflect a security’s intrinsic value, then a rational investor would not incur the cost of obtaining and analyzing information to obtain a second estimate of the security’s value. If no investor obtains and analyzes information about a security, however, then how can the market price reflect the security´s intrinsic value?”
(Grossman & Stiglitz, 1980) By finding the intrinsic value we are seeking to identify mispricing, relying on price eventually converging to that value, in the attempt to achieve a positive excess risk-adjusted return or alpha.
In the particular case of pharmaceutical companies the process of valuation can become very complex for several reasons. These companies are very dependent of economic cycles and government expenses; a large share of their growth is achieved by mergers & acquisitions; the importance of patents in their revenues; and the recent regulatory changes and healthcare legislation that is an example the Affordable Care Act in United States (Obamacare).
1.2. Project Structure
This project is divided into five distinct parts:
I - In the first part of this project a literature review will be carried where several conceptually accepted valuation models will be briefly presented and become the base for further estimation of the company´s intrinsic value.
II – In the second part, Pfizer’s business model will be presented with careful consideration of its past operational and financial performance and strategies. This will be accomplished and complemented with a SWOT analysis and the Porter’s Five Forces.
III – The third part will describe and analyze the macroeconomic environment where the company operates and also gauge the industry specific characteristics and challenges.
IV – The fourth part will justify the chosen methodology and explain all the assumptions made to forecast the data necessary to achieve the purpose of this project, the company’s valuation.
V – In the last part, the chosen model will be applied and the intrinsic value reached. In order to consolidate the analysis, a different valuation model will be used, and to assess the risk the project will be finalized with a sensitivity analysis.
2. Literature Review 2.1. Valuation Concept
Valuation is the process of the determining the current worth of an asset or company. According to Pinto J. et al. (2010) the valuation process involves several equally important steps. First it’s mandatory to have a deep understanding of the company´s
business. Second, and one of the most difficult tasks, is to forecast the company’s performance. As Damodaran (2012) emphasizes, the models that we use in valuation may be quantitative, but the inputs leave plenty of room for subjective judgments. The third step consists in choose the most appropriate valuation model according to the characteristics of the company and the industry in which it operates, knowing that the most serious problem in the evaluation of companies is the existence of various valuation models, where the choice of one method over another will depend on the active features that is being evaluated, and there’s no perfect valuation models (Damodaran, 2012). Fourth step, implies converting forecasts to a valuation and lastly, applying the valuation conclusions.
2.2. Valuation Methods
In this chapter will be gathered some of the main studies and publications relating to different methods of valuation. Given there is no consensus on the existence of a single ideal model of evaluation, it’s important to distinguish them properly according to their assumptions and according to their suitability to meet the characteristics and specificities of each company.
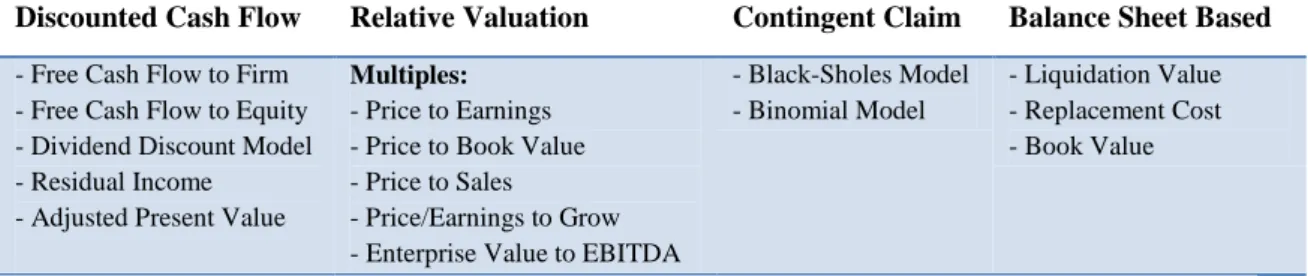
According to authors like Damodaran (2006 and 2012) and Fernández (2013), we can divide the classes of valuation between four main methods: Discounted Cash Flow Valuation, Relative Valuation, Contingent Claim Valuation and Asset Based Valuation.
Table I – Valuation Methods
Discounted Cash Flow Relative Valuation Contingent Claim Balance Sheet Based
- Free Cash Flow to Firm - Free Cash Flow to Equity - Dividend Discount Model - Residual Income - Adjusted Present Value
Multiples: - Price to Earnings - Price to Book Value - Price to Sales
- Price/Earnings to Grow - Enterprise Value to EBITDA
- Black-Sholes Model - Binomial Model
- Liquidation Value - Replacement Cost - Book Value
2.2.1. Discounted Cash Flow (DCF)
Discounted Cash Flow Models view the intrinsic value of common stock as the present value of its expected future cash flows. Although the principles behind DCF Valuation are simple, applying the theory to equity valuation can be challenging. According to Pinto J. et al. (2010) DCF analysis can be summed in four steps: choosing the class of DCF model; forecasting the cash flow; choosing the discount rate methodology; and estimating the discount rate. The DCF method remains one of the preferred models of many professional and academic (Koller et al., 2005), focusing solely on earnings within and outside the company, rather than the accounting gains that many times distort the analysis (Copeland et al., 1994). However, the method's accuracy is intrinsically dependent on the correct projection of cash flows, dividends, risk measures and assumptions made when determining the discount rate (Brealey & Myers, 1998). This review will present some of the most used DCF models.
Free Cash Flow to Firm (FCFF)
Free cash flow to the firm is the net amount of cash available to the company’s suppliers of capital after paying all operating expenses (including taxes) and make the necessary investments in working capital (e.g., inventory) and fixed capital (e.g., equipment). FCFF is the cash flow from operations minus capital expenditures. The company's capital suppliers may be common shareholders, bondholders, and sometimes, preferred stockholders (Pinto J. et al., 2010).
(1) ( )
Where, NI is the net income available to common shareholders, NCC is the net noncash charges, Int represents the interest expense, the FCInv is the investment in fixed capital and WCInv is the investment in working capital.
The FCFF valuation approach estimates the value of the firm as the present value of future FCFF discounted at the weighted average cost of capital (WACC). Because FCFF is the cash flow available to all suppliers of capital, using WACC to discount FCFF gives the total value of all of the firm’s capital.
(2) ∑
( )
The expression for WACC multiplies the weights of debt and equity in the company’s financing by, respectively, the after-tax required rates of return for the company’s debt and equity under current market conditions (Fernández, 2007):
(3) ( )
Where, MVD is the market value of debt, MVCE is the market value of common equity, rd is the required return on debt and r represents the cost of equity.
Because the company’s capital structure (the proportions of debt and equity financing) can change over time, WACC may also change over time. In addition, the company’s current capital structure may also differ substantially from what it will be in future years (Pinto J. et al., 2010).
Free Cash Flow to Equity (FCFE)
Free cash flow to equity is the net amount of cash that can be paid to the company’s holders of common equity after deducting all operating expenses, interest, and principal payments and making the necessary investments in working and fixed capital. FCFE is the cash flow from operations minus capital expenditures minus payments to (and plus receipts from) debt holders (Pinto J. et al., 2010).
(4)
Since FCFE is the remaining cash flow for equity holders after all other claims have been satisfied, discounting FCFE by r (the required rate of return on equity) the value of the firm’s equity is obtained (Steiger, 2008).
(5) ∑ ( )
The FCFE represents a more direct way to value equity than FCFF if, for instance, the company’s capital structure is relatively stable.
Dividend Discount Model (DDM)
The DDM is the oldest and simplest present value approach to valuing stock. This method highlights the fact that when an investor buy a stock, he expects to receive two types of cash flows – dividends during the period he holds the stock and the market price of the share when he sells it. One of the methods that is generally accepted to calculate the DDM is the Gordon Growth Model (GGM). The GGM, developed by Gordon & Shapiro (1956) and Gordon (1962), assumes that dividends grow indefinitely at a constant rate.
The formula can be written as follows: (6) ( )
Where, Vo is the valuation at time zero, D0 is the last paid annual dividend, r is the
required return on equity and g represents the expected dividend payable at time t. Since the model is based on indefinitely extending future dividends, the model’s required rate of return and growth rate should reflect long term expectations. A discounted dividend approach is most suitable for dividend-paying stocks in which the company has a discernible dividend policy that has an understandable relationship to the company’s profitability, and the investor has a noncontrol (minority ownership) perspective.
Residual Income Valuation
Residual income is the amount of income less a charge (deduction) for common shareholders opportunity cost in generating net income. It is the residual or remaining income after taking into account the costs of all of a company’s capital. The rational about this concept is that a company can have a positive net income but may still not be adding value for shareholders if it does not earn more than its cost of capital and to overcome this, residual income models recognize the costs of all the capital used in generating income (Pinto J. et al., 2010). Is easy to understand that, if a company is not creating enough income to cover its cost of capital, is destroying value.
Example of residual income models is the economic value added (EVA) or market value added (MVA). The formulas presents as follow:
(7) ( )
Where, NOPAT is the net operating profit after taxes, C% is the cost of capital and TC is the total capital.
(8)
Where MV is the market value of the company and ABVTC is the accounting book value of total capital.
Research on the rigor of value-added concepts to explain equity value and stock returns has reached mixed conclusions. Peterson & Peterson (1996) found that value-added measures are slightly more correlated with stock returns that are conventional measures, such as return on assets and return on equity. Bernstein & Pigler (1997) and Bernstein, Bayer & Pigler (1998) found that value - added measures are no better at predicting stock performance than are such measures as earnings growth.
Adjusted Present Value (APV)
Regarding the APV has the initial approach to determining the company's value without debt through FCFF, after considering the net effect of debt on the company's value, taking into account all the benefits and borrowing costs. According to Copeland (1994), the debt value increases as the business grows, and if a company decides to significantly change its capital structure taking on more debt, the value of the ratio debt/company will decrease due to tax benefits arising from the payment of financial charges, in which the author believes that through the WACC this effect is overvalued. Thus, in a first step is calculated the value of the unlevered company, resulting in FCFF discount to the cost of capital unlevered ( ). Later it will include the amount of tax benefits originated by the payment of interest on the current debt, with that cash flow discounted at the debt cost, and shall also be included the expected costs with bankruptcy. According to Damodaran (2012) this step only requires the estimation of the probability of bankruptcy with the additional debt also considering the costs associated with the bankruptcy of the company. The value of a levered firm is achieved by adding the net effect debt to the unlevered firm.
(9) ( )
Where, g is the growth rate of cash flows, is the unlevered cost of equity, is the value of tax benefits and represents the present value of expected bankruptcy cost.
2.2.2. Relative Valuation
The objective of relative valuation is to value assets, based upon how similar are currently priced in the market. There are two components to relative valuation. The first one is that to value assets on a relative basis, prices have to be standardized, usually by
converting prices into multiples of earnings, book values or sales. The second is to find identical companies, which is difficult to do since no two firms are similar and firms in the same business may still differ over risk, growth potential and cash flows (Damodaran, 2012). Damodaran (2007) also state that several pitfalls looms in relative valuation like the fact that multiples will reflect the market mood generating biased values. Another reason is that key variables such as risk, growth or cash flow can be potentially ignored resulting in inconsistent estimates of the company´s value. However Fernández (2001) and Steiger (2008) consider that multiples are useful in a second stage of the valuation: after carrying out the valuation using another method, a comparison with the multiples of comparable companies allow us to measure the valuation performed and identify differences between the assessed firm and the firms with which compares.
According to Pinto J. et al. (2010) relative valuation can be separated in two different groups, multiples based on the share price and multiples based on enterprise value. Any of the ratios in these groups can be valued by applying two different methods, the method of comparables that is a valuation based on multiples of similar assets or the method based on forecasted fundamentals that refers to the use of multiples that are derived from forecasted fundamentals. In summary, we can approach valuation by using multiples from two perspectives. First, we can use the method of comparables, which involves comparing an asset’s multiple to a standard of comparison. Similar assets should sell at similar prices. Second, the method based on forecasted fundamentals can be used, which involves forecasting the company’s fundamentals rather than making comparisons with other companies. The price multiple of an asset should be related to its expected future cash flows. Another type of relative valuation is the valuation
indicators we call momentum indicators that relate either price or a fundamental, such as earnings, to the time series of their own past values or, in some cases, to the expected value of fundamental. To conclude the relative valuation overview it’s possible to also averaging multiples that are normally applied by using harmonic mean or weighted harmonic mean to a group of price multiples.
2.2.3. Contingent Claim Valuation
The contingent claim valuation method uses options pricing models, like Black-Sholes or Binomial pricing model to quantify the value of assets that share option features (Damodaran, 2006). The company valuation using the valuation of options arises from the fact that in specific situations the value of the asset being valued is greater or less than the expected cash flow as a function of the probability of occurrence of a specific event to the company or business. Option valuation models, are based on the use of portfolio replication to enhance the project, based on the construction of a securities portfolio, which has the same payment as an option where by analogy the portfolio and option must have the same price, otherwise it is possible to obtain arbitrage profits (Copeland, 1994). Regarding to option valuation models, it’s important to distinguish between the Binomial pricing model and the Black Scholes model. The Binomial pricing model is based on the asset valuation process using decision trees, in that for any period can move from one to two possible prices. The Binomial model goal is to create a replicator portfolio, where the combination of the interest rate without risk and the underlying asset will enable the creation of such cash flows of the option that is being valued. However, when the price formation process is continuous, the Binomial model converges in Fisher Black and Myron Scholes model. The derivation of the Black-Scholes model is based on the creation of a portfolio with the underlying asset
and a riskless asset with the same cash flows, and thus with the same cost of the option being valued.
2.2.4. Balance Sheet Based Valuation
According to Fernández (2007), this method computes the company’s value by assessing the value of its assets. Damodaran (2012) distinguish the balance sheet based valuation in three main types: liquidation value, replacement cost and book value. Liquidation value is the combination of the estimated profits after sale the assets own by the company. Replacement cost is the estimation of what would be the cost to replace all the assets of the company. At last, book value approach uses the book value as a measure to value the company assets.
3. COMPANY’S PRESENTATION
In 1849, cousins Charles Pfizer and Charles Erhart founded Charles Pfizer & Company in Brooklyn, NY that later will become Pfizer Inc. The company started producing and selling an anti-parasitic, although it was the production of citric acid that really kick-started Pfizer's growth in the 1880s. The company´s expertises in fermentation technology were applied to the mass production of the antibiotic penicillin during World War II in response to the need of the US government to treat injured soldiers. During the 1980s and 1990s, Pfizer Corporation growth was sustained by the discovery and marketing of medicines and vaccines like Zoloft, Lipitor, Norvasc, Zithromax, Aricept, Diflucan and Viagra and today the majority of revenue come from the manufacture and sale of biopharmaceutical products.
Pfizer’s global portfolio includes medicines and vaccines as well as many of the world's best known consumer health care products. Pfizer has recently grown by mergers,
including those with Warner–Lambert (2000), Pharmacia (2003), and Wyeth (2009). On November 30, 2012, Pfizer completed the sale of the nutrition business to Nestlé and recognized a gain of approximately $4,8 billion, net of tax, and on June 24, 2013, the company completed the full disposition of their Animal Health business, Zoetis Inc, and recognized a gain of approximately $10,3 billion, net of tax. In February 2015, Pfizer and Hospira agreed that Pfizer would acquire Hospira for a deal that including debt is valued at around $17 billion. Hospira is the world’s leading provider of injectable drugs and infusion technologies and a global leader in biosimilars.
Pfizer’s majority of revenues come from the manufacture and sale of biopharmaceutical products and several factors can significantly impact the company performance, like the loss or expiration of intellectual property rights and the expiration of co-promotion and licensing rights, healthcare legislation, pipeline productivity, the regulatory environment and pricing, competition among branded products and the global economic environment.
3.1. Company Structure
Revenues from biopharmaceutical products contribute approximately to 92% of total revenues in 2014 with 10 biopharmaceutical products recording more than $1 billion in sales in 2014. The remaining revenues are obtained by alliance agreements, generics, consumer healthcare products and Pfizer CentreSource which is a leading supplier of steroid products and pharmaceutical contract manufacturer that offers a wide range of outsourcing services.
Sales (M) 45708 3446 451 BioPharmaceutical Diversified Pfizer CentreSource
Business Segments in USD (2014)
92% 7% 1% Business Segments BioPharmaceutical Diversified Pfizer CentreSource Figure 1 – Business Segments
The US represents the largest national market, comprising 38% of total revenue in 2014. In the same period Europe revenues represented 24% of total revenues, slightly above Emerging Markets with 23%.
The company´s geographic ownership is mostly focused in US with 81% of total and is owned in majority by Investment Advisors Firms.
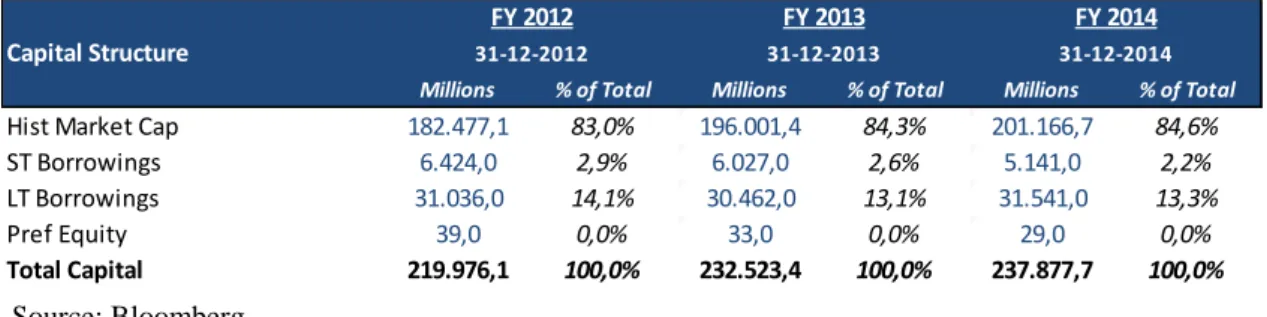
Pfizer’s market capitalization in the end
of 2014 were $201.166,7 million and represents 84,6% of total capital. Debt have kept relatively steady in the past 3 year and stood at $36.682 million in 2014 which $31.541 million in long term debt and $5.141 million in short-term debt. In the same period, total capital were $237.877,7 million representing an increase of 2,30% compared to 2013.
Table II – Pfizer’s Capital Structure
Sales (M) 19073 11719 11499 7314 Geographic Segments in USD (2014)
United States Europe Rest of World Emerging Markets 38% 24% 23% 15% Geographic Segments United States Europe Emerging Markets Rest of World Figure 2 – Geographic Segments
Source: Bloomberg
Figure 3 - Geographic Ownership
Source: Bloomberg
Millions % of Total Millions % of Total Millions % of Total
Hist Market Cap 182.477,1 83,0% 196.001,4 84,3% 201.166,7 84,6%
ST Borrowings 6.424,0 2,9% 6.027,0 2,6% 5.141,0 2,2% LT Borrowings 31.036,0 14,1% 30.462,0 13,1% 31.541,0 13,3% Pref Equity 39,0 0,0% 33,0 0,0% 29,0 0,0% Total Capital 219.976,1 100,0% 232.523,4 100,0% 237.877,7 100,0% 31-12-2014 FY 2013 FY 2014 FY 2012 Capital Structure 31-12-2012 31-12-2013 Source: Bloomberg
3.2. Company´s Business
Pfizer has a commercial structure consisting in two different businesses: Table III – Pfizer Commercial Structure
Innovative Products Business Global Innovative Pharmaceutical segment (GIP)
Global Vaccines, Oncology and Consumer Healthcare segment (VOC)
Established Products Business Global Established Pharmaceutical segment (GEP)
In the Innovative Products Business, the operating segment GIP focused on developing, registering and commercialize novel and value-creating medicines while the VOC segment focuses on the development and commercialization of vaccines and products for oncology and consumer healthcare. In the Established Product Business, the GEP segment includes the brands that have lost market exclusivity and mature patent-protected products that are expected to lose exclusivity in the near term in most major markets. Additionally, GEP includes generic pharmaceuticals, sterile injectable products and the biosimilar development portfolio.
3.3. Operational and Financial Performance Revenues
In 2014 total revenues were $49,4 billion, a decrease of 4% compared to 2013, which reflects an operational decrease of $1,1 billion, or 2%, as a result of loss of collaboration agreement and exclusivity of several
products, and unfavorable foreign exchange of $912 million, or 2%, compared to 2013.
Source: http://www.pfizer.com/
Figure 4 – Revenues (millions of dollars)
Source: Author’s Analysis
Source: Author’s Analysis
Cost of Sales
Table IV – Cost of Sales as Percentage of Revenue
Cost of sales shows a decrease in the past two years in consequence of lower revenue. As a percentage of revenue the cost of sales has been rising due to unfavorable impact of the loss of exclusivity of certain products that were offset by the favorable impact of foreign exchange.
Selling, Informational and administrative (SI&A) Expenses
SI&A expenses decreased 5% in 2013, compared to 2012 and 2% in 2014, compared to 2013, primarily due to a mix of lower marketing expenses in response to product loss of exclusivity and favorable impact of foreign exchange.
Research and Development (R&D) Expenses
As shown in the table below, R&D expenses has increased above 10% in the past two years due to costs associated with ongoing approval of products and a charge associated with the collaborative arrangement with Merck KGaA for an antibody development as a potential treatment for multiple types of cancer.
Table V – R&D Expenses as Percentage of Revenue
(millions of dollars) 2012 2013 2014
Cost of sales 9.425 9.250 9.033 As a percentage of revenues 17,24% 17,98% 18,28%
(millions of dollars) 2012 2013 2014
Research and Development Expenses 6.434 6.551 7.150 As a percentage of revenues 11,77% 12,73% 14,47%
Source: Pfizer’s Financial Reports
Figure 5 – SI&A (millions of dollars)
Source: Author’s Analysis
Source: Author’s Analysis
(millions of dollars) 2012 2013 2014
Amortization of intangible assets 5.109 4.599 4.039 As a percentage of revenues 9,35% 8,94% 8,17%
2012 2013 2014 Income Tax Expenses 2.221 4.306 3.121 Effective Tax Rate 19,76% 27,40% 25,50%
Amortization of Intangible Assets
Table VI – Amortization of Intangible Assets as Percentage of Revenue
Amortization of intangible assets decreased 12% in 2014, compared to 2013, and 10% in 2013, compared to 2012, primarily due to assets that became fully amortized at the end of their estimated useful lives.
Effective Tax Rate
Table VII – Effective Tax Rate
After an increase of the effective tax rate in 2013 compared to 2012 due to $500 million in tax benefits, related to certain audit settlements and the expiration of certain statutes of limitations in multiple jurisdictions covering various periods, in 2014 one observes a rate reduction explained, among other reasons, by several non-recurrent tax benefits and favorable impact of US R&D tax credit.
Operating income
Operating income has been decreasing due to an increase in R&D expenses and to a slump in revenue in consequence of several loss of collaboration agreement and exclusivity of
several products that weren’t offset by a reduction in the cost of sales.
Figure 6 – Operating Income (millions of dollars)
3.4. Strategic Analysis
3.4.1. Porter’s Five Forces Analysis
Porter’s five forces analysis provides a framework for analyzing the level of competition within an industry and business strategy development. Named after Michael E. Porter, this model identifies and analyzes 5 competitive forces that model every industry, and helps determine an industry's weaknesses and strengths. According
to Porter (2008), understanding that the competitive forces and the overall industry structure is crucial for effective strategic decision-making (Appendix 1).
3.4.2. SWOT Analysis
The SWOT analysis is an organized a planning method used to identify the strengths, weaknesses, opportunities and threats involved in a project or in a business venture. Strengths and weaknesses are often seen as the key internal factors to the organization, while opportunities and threats are generally related to the environment external factors to the organization. For this reason, SWOT is sometimes called Internal-External Analysis (Appendix 2).
Figure 7 – Porter’s Five Forces
Figure 8 – SWOT Analysis
Industry Competition Suppliers Bargaining Power Threat of Substitutes Buyerss Bargaining Power Threat of New Entrats
Source: Would Economic Outlook, IMF
Source: Would Economic Outlook, IMF
4. MACROECONOMIC ENVIRONMENT AND INDUSTRY SECTOR 4.1. Macroeconomic Environment
This section will analyze the macroeconomic environment from 2015 until 2020 for the main markets where Pfizer operates. The International Monetary Fund (IMF) and their World Economic Outlook Database will be the main source for statistical data. The analysis will be divided in four major areas and there will be a brief analysis regarding the foreign exchange market.
United States (US)
Table VIII – United States GDP and Inflation Forecast (%)
Macro Variable 2015 2016 2017 2018 2019 2020
GDP, constant prices 3,135 3,060 2,662 2,355 2,039 2,024
Inflation, average consumer prices 0,104 1,486 2,373 2,541 2,331 2,306
The majority of Pfizer's revenue comes from the US and represents 38,4% of the total. The US is expected to grow 3,135% this year. According to the IMF estimates, the GDP growth will decrease constantly until 2020, where it will grow 2,024%. Concerning inflation, the rate in 2015 is expected to be 0,104%, and have deep upward pressure until 2017 to 2,373% stabilizing near that rate until 2020.
Europe
Table IX – Europe GDP and Inflation Forecast (%)
Macro Variable 2015 2016 2017 2018 2019 2020
GDP, constant prices 1,847 1,949 1,907 1,876 1,877 1,852
Inflation, average consumer prices 0,029 1,185 1,451 1,618 1,753 1,854
Europe sales represent 23,6% of Pfizer’s total revenue and are expected to grow 1,847% in 2015. According to the IMF the GDP rate will be relatively constant until 2020, having is peak in 2016 with 1,949% GDP growth.
Source: Would Economic Outlook, IMF
Source: Would Economic Outlook, IMF
The inflation rate will grow considerably from 2015 (0,029%) to 2016 (1,185%) growing constantly until 2020 where will reach 1,854%.
Emerging Markets (EM)
Table X – Emerging Markets GDP and Inflation Forecast (%)
Macro Variable 2015 2016 2017 2018 2019 2020
GDP, constant prices 4,261 4,737 5,028 5,109 5,242 5,271
Inflation, average consumer prices 5,408 4,812 4,586 4,499 4,527 4,478
Emerging Markets sales represent 23,2% of Pfizer’s total revenue and the GDP projections also show a constant growth between 2015 and 2020. This year the GDP is expected to grow 4,261% reaching 5,271% in 2016. Inflation projections show a decrease in the five year forecasted, slowing from 5,408% in 2015 to 4,478% in 2020. Although it´s expected for EM countries to grow between the forecasted periods, several major emerging economies may produce a negative impact in Pfizer’s revenues due to the slower pace of GDP growth. Slowing emerging-market economies may mean delayed payments and tougher tenders for large pharmaceutical companies, which have been growing rapidly in those markets.
World
Table XI – World GDP and Inflation Forecast (%)
Macro Variable 2015 2016 2017 2018 2019 2020
GDP, constant prices 3,451 3,759 3,848 3,873 3,928 3,966
Inflation, average consumer prices 3,200 3,340 3,472 3,495 3,497 3,509
According to the IMF, both the GDP and inflation will grow constantly between 2015 and 2020. The forecast predicts 3,451% GDP growth in 2015 increasing to 3,966% in 2020 and 3,200% inflation in 2015 up to 3,966% in 2020.
Source: Bloomberg
Foreign Exchange
Table XII – US Dollar Index Forecast (dollars)
Macro Variable 2015 2016 2017 2018 2019
US Dollar Index 98,700 99,000 93,300 93,700 91,800
The US Dollar Index indicates the general international value of the dollar by averaging the exchange rates between the USD and major world currencies. According to the Bloomberg Composite that gathers forecasts from 26 banks, the value of the dollar will increase slightly until 2016, depreciating sharply until 2019. This is due to the monetary policy cycle that indicates an increase in the Fed Funds Rate in the near future.
4.2. Industry Sector Revenues
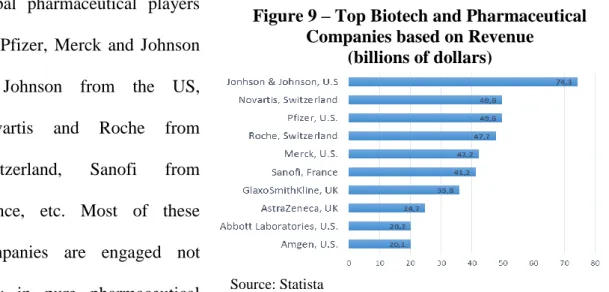
Pharmaceutical companies are well known for manufacturing pharmaceutical drugs. These drugs have the aim to diagnose, to cure, to treat, or to prevent diseases. The pharmaceutical sector represents a huge industry, as evidenced by the fact that global pharmaceutical market is worth nearly one trillion US dollars. The best known top global pharmaceutical players
are Pfizer, Merck and Johnson & Johnson from the US, Novartis and Roche from Switzerland, Sanofi from France, etc. Most of these companies are engaged not only in pure pharmaceutical
Figure 9 – Top Biotech and Pharmaceutical Companies based on Revenue
(billions of dollars)
business, but also manufacture medical technology and consumer health products, vaccines, etc.
There are both pure play biotechnology companies as well as pharmaceutical companies which among other products also manufacture biotech products within their biotechnological divisions. Most of the leading global pharmaceutical companies have biopharmaceutical divisions.
Research & Development (R&D)
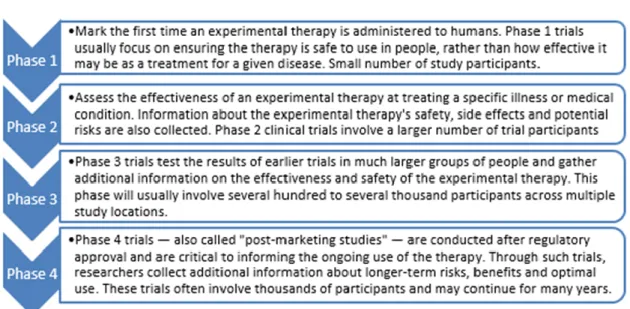
The clinical development such as the study of potential new therapies in humans is a critical part in the process of bringing new therapies to patients. Globally there are more than seven thousand medicines in development with biopharmaceutical companies investing more than $50 billion in R&D in 2014. The development of new medicines is a rigorous and long process and it has become come more complex over the last decade. It typically takes 10 to 15 years from the moment of discovery in the lab for a potential new therapy to obtain approval for use and reach patients.
Figure 10 – Research and Development Process
The most time intensive and expensive part of this continuum research and development is clinical development that accounts for approximately 45 to 75 percent of the $2,6 billion average cost of bringing a new therapy to market. Currently, less than 12% of the candidate medicines that make it into phase I clinical trials will be approved by the FDA and just 2 in 10 approved drugs are ultimately commercial successes. Recent biopharmaceutical advances would not have been possible without a system of laws, including intellectual property protections that provide the structure, stability, and opportunity for the needed
investment. While research based biopharmaceutical companies are responsible for bringing new medicines to patients, they do it in collaborations with academic institutions, government agencies, venture capital firms, nonprofit foundations and others. Recent
Figure 11 – Phases of Development
Figure 12 – Drugs Development by Sector
studies show that 91% of the drugs are developed by the private sector with no direct government role (Health Affairs, 2014).
According to the US Congressional Budget Office, the pharmaceutical industry invest as much as five times more in R&D, relative to their sale, then the average US manufacturing firm.
Spending and Costs
Prescription medicines represent a small share of national health spending. Growth in the prescription drug spending has slowed markedly over the past decade, and grew more slowly than the overall health spending, accounting today for about 10% of health care spending in America.
Hospital care (32%) and physicians and clinical services (20%) accounts for more than 50% of total health care spending in US. From the 10% overall spending in prescription,
Figure 13 – PhRMA Member Company R&D Investment
Sources: Congressional Budget Office (CBO). Pharmaceutical Research and Manufacturers of America (PhRMA).
Figure 14 – Prescription Drug Spending Growth
nearly 9 out of every 10 US prescriptions are filled with generics, a percentage that has been rising sharply in the past two decades.
When a generic version of a medicine becomes available for the first time, it captures an average of three quarters of the market within the first three months.
A small number of large purchasers dominate the US prescription drug market. According to Atlantic Information Services, Inc., the top 5 purchasers account for 68.2% of the market and the top 15% account for 95,9% of the total prescription drug market.
In the US system, health plans have powerful tools to reduce spending on medicine, such as formularies, tiered copays where are demanded higher costs to patients for
Figure 16 – Average Generic Share of Total Use Following Launch of a Brand Medicine’s First Generic
Source: Grabowski H, et al; Express Scripts
Figure 15 – Generic Share of Prescriptions Filled
brands than for generics and preferred brands, prior authorization before the medicine’s covered, concentrated purchasing power and financial incentives to physicians and pharmacies for generic prescription or preferred drugs.
Economic Impact
The biopharmaceutical sector accounts for the largest share of all US business R&D, representing 21% of all domestic R&D funded by US businesses.
Relatively to sales, the biopharmaceutical sector invests more in R&D than other manufacturing industries, investing more than six times the average for all manufacturing industries.
Figure 17 – Share of Total Business R&D by Industry, 2011
Source: National Science Foundation
Figure 18 – R&D Expenditures per Employee by Industry
In US, the industry creates more than 814,000 direct jobs and 1,022,000 indirect jobs. Biopharmaceutical exports have nearly tripled over the period between 2002 and 2014, accounting for 3,3% of all US exports by 2014.
Risk Factors
Companies operating in this industry are subject to several risks such as pricing pressures and government regulations, health care reform and/or changes in healthcare legislation, public deficit reduction actions, generic competition, dependence on key products, large amounts invested in research and development without guarantees of return, patent protection, foreign exchange and interest rate risks for the exporters, counterfeit products, environmental claims and proceedings, among others.
5. VALUATION 5.1. Methodology
The methodology used to value Pfizer was the DCF model, computing the FCFF and then retrieving the WACC rate. The choice of this method is due to the fact that the FCFF is aligned with profitability within a reasonable forecasted period. In February 2015, Pfizer announced the acquisition of Hospira Inc. (Hospira), the world's leading provider of injectable drugs and infusion technologies, and a global leader in
Figure 19 – US Biopharmaceutical Goods Exports
biosimilars. The acquisition is expected to be concluded at the end of 2015, in a transaction that will significantly enhance Pfizer’s GEP business. The following assumptions will be made based on both Pfizer and Hospira balance sheets, income statements and cash flow statements.
5.2. Assumptions 5.2.1. Net Income
5.2.1.1. Sales & Services Revenue
Estimates of revenues were accomplished by calculating Pfizer and Hospira annual growth rates over the past 5 years. Then, the average growth rate excluding the extreme values in order to rule out possible one-offs was calculated. It was then added 1% to the average growth assessing the best growth prospects of the US economy compared to the previous five years. In 2015 revenue growth was calculated based only on Pfizer’s data and in 2016, when it will be completed the Hospira acquisition, was estimate the revenue growth as an average of the historical growth of each company weighted by the revenues of each one in percentage of total revenues (Appendix 3).
5.2.1.2. Cost of Revenue
Concerning the cost of revenue, since the last five years represented a relatively constant percentage of sales, both in the case of Pfizer and Hospira, it was calculated the weighted average (recent data with more weight than the previous one) relative to sales for both companies in the last five years. The cost of revenue was then calculated by multiplying the forecasted sales by the weighted average cost of revenue in percentage of the sales of both companies (Appendix 4).
5.2.1.3. Operating Expenses
Operating expenses was computed as the simple average of operating expenses to sales in the last 5 years for both companies, given the historic period that showed a constant percentage relatively to sales. Then, the results where multiplied by the weighted average in percentage of the forecasted sales for both companies (Appendix 5).
5.2.1.4. Non-Operating Income (Loss) 5.2.1.4.1. Net Interest Expenses
Concerning the net interest expenses, it was taken into account the growth rate of the cash and debt in the past 5 years and also the cash decrease and debt increase due to Hospira acquisition that will to be paid with 2/3 in cash and 1/3 in debt.
Then, was calculated the interest income and interest expenses rates in 2014 and estimated future rates with the expectation of the Fed’s reference rate in the following 5 years (Appendix 6, 7 and 8).
5.2.1.4.2. Other Non-Op (Income) Loss
It was calculated as the average of the last 5 years excluding the extreme values to rule out one-offs (Appendix 9).
5.2.1.5. Income Tax Expense (Benefit)
Concerning the income tax expense, it was calculated to all the forecasted years by multiplying the income tax rate of 2014 (also the company’s estimate for 2015) by the pretax income estimates (Appendix 10).
5.2.1.6. Minority Interest
Minority interests was computed as the simple average of minority interest to Pfizer’s income in the last 5 years, given the historic period that showed a constant percentage
relatively to income. Then, the results where multiplied by the estimated income between 2015 and 2019 (Appendix 11).
5.2.2. Free Cash Flow
5.2.2.1. Depreciation & Amortization
D&A was computed as the simple average of D&A to sales in the last 5 years for both companies. Then, the results where multiplied by the weighted average in percentage of the forecasted sales for both companies (Appendix 12).
5.2.2.2. Change in non-cash Working Capital
Changes in working capital was calculated as the simple average of changes in working capital to revenues in the last 5 years for both companies, given the historic period that showed a constant percentage relatively to sales. Then, the results where multiplied by the weighted average in percentage of the forecasted sales for both companies (Appendix 13).
5.2.2.3. Capital Expenditures
Concerning the capital expenditures (capex), since the last five years represented a relatively constant percentage of sales, both in the case of Pfizer and Hospira, it was calculated the weighted average (recent data with more weight than the previous one) relative to sales for both companies in the last five years. The estimated capex was then calculated by multiplying the forecasted sales by the weighted average capex in percentage of the sales of both companies (Appendix 14).
5.2.3. Weighted Average Cost of Capital
Having projected the company's free cash flow for the next five years, the aim is to figure out how much these cash flows are worth today. That means coming up with an
appropriate discount rate to calculate the net present value of the cash flows. To accomplish this will be used the WACC formula (3) mentioned in point 2.2.1.
5.2.3.1. Cost of Equity
The most commonly accepted method for calculating the cost of equity is the Capital Asset Pricing Model (CAPM), a model that describes the relationship between risk and expected return and is given by equation 10:
(10) Cost of Equity (Re) = Rf + Beta (Rm-Rf)
Where Rf is the risk-free rate, Beta is a measure of the volatility or systematic risk of a security in comparison to the market as a whole and (Rm-Rf) represents the market risk premium.
5.2.3.1.1. Risk-Free Rate
The Risk Free Rate represents the interest an investor would expect from an absolutely risk-free investment over a specific period of time. The US 10 year treasury on October of 2015 was contemplated (2,058%).
5.2.3.1.2. Beta
Beta represents the measure of an asset's risk in relation to the market that is calculated using regression analysis. Adjusted Pfizer’s Beta relative to the S&P index between 2013 and 2015 is 1.073.
5.2.3.1.3. Market Risk Premium
The market risk premium is calculated by subtracting the risk-free rate from the expected market return. The expected market return in US was obtain from the Bloomberg data (9,508%). Thus, the market risk premium is equal to 7,450%.
Given the risk-free rate, beta and market risk premium, using the CAPM formula, the cost of equity computed is 10,05%.
5.2.3.2. Effective Tax Rate
For the tax rate it was assumed a constant marginal tax rate of 25,54% (tax paid in 2014) for the period in analysis.
5.2.3.3. Cost of Debt
The cost of debt is calculated multiplying the weight of short term debt and long term debt in relation to the total debt with the average rates the company is currently paying. The formula is given below:
(11)
Currently, Pfizer have a total debt of $35.123 million in which 8.394 million dollars in short term debt with an average yield of 0,62% and $26.729 million in long term debt with an average yield of 2,06%. By replacing in the above formula Pfizer’s cost of debt is 1,72%.
5.2.3.4. Capital Structure
In October 2015 Pfizer’s market capitalization is 209.196,4 million dollars and total debt is $35.123 million, given an equity weight of 85,62% and a debt weight of 14,38%. Computed the capital structure, the cost of debt and equity and the effective tax rate and replacing the results in the formula (3), the WACC is equal to 8,79%.
5.2.3.5. Perpetual Growth Rate
The perpetual growth rate accounts for the value of free cash flows that continue growing at an assumed constant rate in perpetuity. The perpetual growth rate is very important in the valuation process because it can widely influence the terminal value. Several authors defend the rate should be in line with the real growth of a mature economy. It was assumed Pfizer’s perpetual growth rate of 2%.
5.2.3.6. Gordon Growth Model
There are several ways to estimate a terminal value of cash flows being the Gordon Growth Model one of the most commonly accepted models.
The formula is given below:
(12) ( ) Computed the final projected year of cash flow, the long term cash flow growth rate and the discount rate is now possible to find Pfizer’s terminal value.
( )
6. VALUATION RESULTS
Forecasted Pfizer’s FCFF and effective tax rate and determined the discount and perpetual growth rate was possible to obtain an enterprise value of $223.412,63 million. Considering that Pfizer currently have $6.167,4 million outstanding shares, the intrinsic value obtained in the valuation was $36,23.
Table XIII – Valuation Results
Source: Author´s Calculations (millions of dollars)
' 2015 2016 2017 2018 2019
+ Net Income 7 824,7 8 311,3 9 821,2 11 380,8 11 561,6
+ Depreciation & Amortization 6 094,4 6 182,4 5 989,1 5 804,4 5 628,2
+ Chg in non-cash Working Capital 462,0 5,4 -36,6 -79,6 -123,7
Cash from Operating Activities 14 381,2 14 499,1 15 773,7 17 105,6 17 066,1
+ Capital Expenditures -1147,4 -1504,3 -1488,0 -1474,5 -1463,9
Free Cash Flow 13 233,7 12 994,8 14 285,7 15 631,1 15 602,2
Effective Tax Rate 25,50% 25,50% 25,50% 25,50% 25,50%
Free Cash Flow to Firm 14 200,0 14 155,0 15 390,4 16 682,8 16 603,4
Risk-Free Rate (Rf) 2,058%
Beta 1,073
Market Risk 9,508%
Market Risk Premium 7,45%
Cost of Equity 10,05% Perpetual Growth Rate 2,00%
Effective tax rate 25,50% Terminal Value 249380,2
Total Common Equity 209196,4 Enterprise Value 223412,63
Total Debt 35123,0 Outstanding Shares 6167,4
ST Debt 8394,0 Price Target (Dollars) 36,23
ST Debt average yield 0,62%
LT Debt 26729,0
LT Debt average yield 2,06%
Cost of Debt 1,72%
7. RELATIVE VALUATION
Among the most familiar and widely used valuation tools are price and enterprise value multiples. Price multiples are ratios of a stock’s market price to some measure of fundamental value per share. Enterprise value multiples, by contrast, relate the total market value of all sources of a company’s capital to a measure of fundamental value for the entire company (Pinto J. et al., 2010). The multiples chosen for the valuation are the price-to-earnings ratio (PER), the price to book value ratio (PBV) and the enterprise value to EBITDA (EV/EBITDA).
Table XIV – Relative Valuation
Comparable Companies Price-to-Earnings Ratio Price to Book Value Ratio Enterprise Value to EBITDA Bristol-Myers 36,05 6,62 29,91 Eli Lilly 30,99 6,47 26,88 Abbvie 15,50 16,81 23,93 Merck 28,90 3,11 13,41
Johnson & Johnson 16,14 3,70 10,64
Average 24,32 6,63 19,44
Pfizer 18,37 3,05 11,90
Source: Bloomberg
Since PER and PBV are under the industry average, it means the company may be undervalued. The EV/EBITDA looks at a firm as a potential buyer would, because it takes debt into account. The ratio is under the industry average and it may indicates that Pfizer might also be undervalued. It´s important to be aware however, that historically Pfizer multiples tends to be below the market average.
8. SENSITIVITY ANALYSIS
Given Pfizer’s valuation is based on assumption it’s important to perform a sensitivity analysis to measure the stock price change when there is variation in a key variable. Thus, proceeded to the sensitivity analysis with the variables EBIT Margin, WACC, Perpetual Growth Rate and Market Risk Premium it’s possible to observe that the variable whose minor changes largely affect the share price is WACC followed by the Market Risk Premium.
Source: Author´s Calculations (dollars)
A 1% increase in the WACC rate will move Pfizer’s shares intrinsic value to $42,54, 17,42% above the initial price. A 1% decrease will move Pfizer’s shares intrinsic value to $31,53, 12,97% below the initial price. On the contrary, variations in the EBIT Margin have a much smaller impact in the shares intrinsic value. A 4% increase in the margin, will move the intrinsic value to $39,99, 10,38% above the initial price. A 4% decrease in the margin, will move the intrinsic value to $32,46, 10,40% below the initial price.
9. CONCLUSION
The pharmaceutical sector, due to its intrinsic characteristics, with a large portion of business volume with a heavy reliance on blockbuster drugs and its patents, has grown in recent years through mergers and acquisitions off medium-sized competitors.
This project focused on determining Pfizer’s intrinsic value taking into account the recent acquisition of Hospira. Given the unpredictability in forecasting the income statement due to, among other factors, insufficient information on the possible negative impact on the loss of certain patents and the positive impact of the approval of new drugs, changes in government regulations and healthcare reforms in the US, the assumptions were generally conservative.
The company FCFF were estimated between 2015 and 2019 discounted at the WACC rate assuming a perpetuity rate of 2%. A price target of $ 36,23, 9,20% above the current price of $33,18 was obtained. It should be noted that in August 2015 the company had a price per share equal to the intrinsic value but the recent correction in the US stock market due to fears of Chinese economic slowdown and the expected rise of interest rates by the Fed penalized the stock price.
Multiples valuation indicates that Pfizer may be undervalued compared to its pairs, although historically the company has presented the analyzed ratios below the market average.
REFERENCES
Academic material – articles and books
Bernstein, R. & Pigler, C. (1997), An Analysis of EVAR, Quantitative View Point, Merrill Lynch & Co.
Bernstein, R., Bayer, K. & Pigler, C. (1998), An Analysis of EVAR - Part II, Quantitative Viewpoint, Merrill Lynch & Co.
Brealey, R. A. & Myers, S. (1998), Principles of Corporate Finance, 5th Edition, McGraw Hill Gaughan.
Copeland, T., Koller, T. & Murrin, J. (1994), Valuations: Measuring and Managing the Values of Companies, 3rd Edition, New York: John Wiley and Sons.
Damodaran, A. (2006), Valuation Approaches and Metrics: A survey of the Theory and Evidence, Stern School of Business,1–77.
Damodaran, A. (2007), Return on Capital, Return on Invested Capital and Return on Equity: Measurement and Implications, Stern School of Business.
Damodaran, A. (2012), Investment Valuation: Tools and Techniques for determining the value of any asset, 3rd Edition, Hoboken, New Jersey: John Wiley and Sons.
Fernández, P. (2001), Valuation using multiples. How do analysts reach their conclusions?, IESE Research Papers D/450: IESE Business School.
Fernández, P. (2007), Valuing Companies by Cash Flow Discounting: 10 Methods and 9 Theories, Managerial Finance, Vol. 33, N.º 11, pp. 853-876.
Fernández, P. (2013), Company Valuation Methods, Madrid: IESE Business School, University of Navarra.
Gordon, M. (1962), The Investment, Financing, and Valuation of the Corporation, The Irwin Series in Economics.
Gordon, M. & Shapiro, E. (1956), Capital Investment Analysis: the required rate of profit, Management Science, N.º 3, pp. 102-110.
Grossman, S. & Stiglitz, J. (1980), On the lmpossibility of lnformationally Efficient Markets, American Economic Review, N.º 70, pp. 393-408.
Peterson, P. & Peterson, D. (1996), Company Performance and Measures of Value Added, CFA Institute Research Foundation Publications, pp. 1-60.
Pinto, J., Henry, E., Robinson, T. & Stowe, J. (2010), Equity Asset Valuation, 2nd Edition, CFA Institute Investment Books.
Porter, M. (2008), The Five Competitive Forces that Shape Strategy, Harvard Business Review, pp.86-104.
Koller, T., Goedhart, M. & Wessels, D. (2005), Valuation: Measuring and Managing the Value of Companies, 4th Edition, New Jersey: John Wiley and Sons.
Steiger, F. (2008), The Validity of Company Valuation Using Discounted Cash Flow Methods, European Business School, pp. 1-21.
Reports
Hospira, Financial Report (2009, 2010, 2011, 2012, 2013 and 2014). Pfizer, Financial Report (2009, 2010, 2011, 2012, 2013 and 2014).
US Securities and Exchange Commission, Hospira’s Annual Report - FORM 10 K (2014).