Thematic Section: Reservoirs Ecology
Acta Limnologica Brasiliensia, 2018, vol. 30, e306 https://doi.org/10.1590/S2179-975X13717 ISSN 2179-975X on-line versionThis is an Open Access article distributed under the terms of the Creative Commons Attribution License, which permits unrestricted use, distribution, and reproduction in any medium, provided the original work is properly cited.
Is it possible to evaluate the ecological status of a reservoir using
the phytoplankton community?
É possível avaliar o Potencial Ecológico de um reservatório usando a comunidade
fitoplanctônica?
Aline Martins Vicentin1*, Eduardo Henrique Costa Rodrigues1, Viviane Moschini-Carlos1 and Marcelo Luiz Martins Pompêo2
1 Universidade Estadual Paulista – UNESP, Campus Experimental de Sorocaba, Av. Três de Março,
511, Iperó, CEP 18087-180, Sorocaba, SP, Brasil
2 Departamento de Ecologia, Instituto de Biociências – IB, Universidade de São Paulo – USP,
Rua do Matão, 321, Travessa 14, CEP 05508-900, São Paulo, SP, Brasil *e-mail: line_vicentin@hotmail.com
Cite as: Vicentin, A.M. et al. Is it possible to evaluate the ecological status of a reservoir using the phytoplankton community? Acta Limnologica Brasiliensia, 2018, vol. 30, e306
Abstract: Aim: The present study aims to evaluate the ecological status of the Broa reservoir through the application of the ecological index Evenness E2 on phytoplankton. Methods: Phytoplankton samples from surface were obtained during the dry period (June/2015) in 9 points (P1 to P9), along a longitudinal transect in the reservoir. The qualitative analysis was performed using binocular optical microscope, and the quantitative analysis was performed using the sedimentation chamber method and inverted microscope analysis. The Uniformity Index was calculated on density and richness data. The reference values used in this study were set according to the literature covering 5 classifications (High, Good, Moderate, Low and Bad) for the water quality from Evenness E2 index for phytoplankton, being 1 the maximum value. Results: The values observed ranged from 0.1142 in P1 to 0.1468 in P3, being both classified as “Bad”, since values were less than 0.21. Conclusions: The result reinforces the sanitary problem of the reservoir, the occurrence of consecutive algae blooms because the amount of nutrients in the region. A massive occurrence of Cyanobacteria was observed, with emphasis on the species Aphanizomenon gracile, which may be related to the adaptive advantages that this class presents on the community in eutrophic environments. Activities in the basin can contribute effectively to the eutrophication process of the reservoir, such as agriculture, sand mining and livestock. The water quality is compromised due to the dense presence of potentially toxic species, reflects of the eutrophication process, pointing commitments for the multiple uses of the reservoir, as well as human and ecosystem health. These processes could be corroborated by the application of the index and indication of poor water quality.
Keywords: phytoplankton; Ecological Uniformity Index; Evenness Index E2; water quality; eutrophication.
resulting in modifications that directly affect the hydro-sedimentological dynamics between river-dam (Coelho, 2008). In response to these changing conditions, the environment becomes conducive to colonization by species that are tolerant to disturbances, and that may establish a relationship of dominance with other species, making that dams act as modulators of taxa richness and abundance (Smith et al., 2017).
The maintenance of the water resource quality depends on the dynamics of the aquatic ecosystem and on the organisms that compose it, which are able to act in the nutrient cycling, gas exchange, sediment stabilization, composition and structure of the community (Lewis, 1995). This approach requires the interpretation of biotic and abiotic data to understand the existing ecological processes and, consequently, the functioning of the ecosystem and the concept of biodiversity (Lanari & Coutinho, 2010). According to the same authors, concepts related to the ecology of communities and ecosystems must be worked in an integrated way to derive the effects of species diversity on the representative parameters of the environment. Thus, biodiversity responds to the environmental condition generated by the ecosystem and determined by its ecological functioning.
The phytoplankton community is a part of the aquatic ecosystems biota and contributes actively to primary productivity and to biogeochemical cycles (Miller et al., 2012). Phytoplankton can present spatial and temporal variations, both qualitative and quantitative. These characteristics are influenced by other conditions of the system: thermal stratification, water circulation, season of the year, and others (Esteves, 2011). Due to the environmental factors and individual advantages
1. Introduction
The construction of multiple-use water reservoirs contributes significantly to the regularity of water supply, and to the development and maintenance of various economic activities (e. g. industrial, agricultural, aquiculture, navigation). However, these environments are facing different impacts involving water quality and consequently the ecological balance of these ecosystems. The main impacts affecting the water quality of the reservoirs are due to the discharge of domestic and industrial effluents, such as the surface runoff of agricultural and urban areas, which also contributes to the pollutants disposal to the interior of these environments (Cunha et al., 2013). Currently, aquatic and terrestrial ecosystems have been greatly modified by anthropic activities, direct or indirectly, leading to changes in ecosystem dynamics, including water quality, and consequently, the biological communities, which may compromise the multiple uses of the water body (Lewis, 1995; Sant’anna et al., 2008; Tundisi et al., 2015; Pompêo, 2017).
Reservoirs are considered transition ecosystems between lotic and lentic environments, depending on the characteristics of the hydrographic basin where they are inserted which presents specific operating mechanisms (Pompêo, 2017). The impact on the environment from the rupture of the hydrological continuum changes the dynamics in its totality. These changes occur because the system components are altered, including the flow regime, channel size, substrate present and biotic diversity (Bunn & Arthington, 2002).
The damming of a river means an interruption of a transportation open system by a more closed and accumulation system (Junk & Mello, 1990),
densidade e riqueza. Os valores de referência utilizados foram estabelecidos de acordo com a literatura abrangendo cinco classificações (Alto, Bom, Moderado, Baixo e Ruim) do índice Evenness E2 para fitoplâncton, sendo 1 valor máximo indicando as classificações de qualidade da água. Resultados: Os valores observados variaram entre 0,1142 em P1 a 0,1468 em P3, sendo ambos classificados como “Ruim”, visto valores inferiores a 0,21. Conclusões: O resultado reforça a problemática sanitária do reservatório, pela ocorrência de consecutivas florações algais (“blooms”), pelo aporte e concentração de nutrientes na região. Ocorrência massiva de Cianobactérias foi observada, com ênfase para a espécie
Aphanizomenon gracile, podendo estar relacionada às vantagens adaptativas que esta classe apresenta sobre a comunidade em ambientes eutrofizados. As atividades na bacia contribuem efetivamente para o processo de eutrofização do reservatório, como atividades agrícolas, de mineração de areia e pecuária. A qualidade da água está comprometida devido à densa presença de espécies potencialmente tóxicas, refletindo no processo de eutrofização, apontando comprometimento aos múltiplos usos do reservatório, além da saúde humana e ecossistêmica. Esses processos podem ser corroborados pela aplicação do índice e indicação de má qualidade da água.
of each family, or even of an organism of the community, phytoplankton can have its structure and composition rapidly changed under human effects due to the sensitivity of organisms, since planktons are profoundly sensitive to natural change they are best markers of water quality and particularly lake conditions (Parmar et al., 2016), by being well documented in the literature the use of these organisms, with greater importance given to phytoplankton, in studies of biomonitoring (using different methodologies) in aquatic environments, mainly reservoirs (Yuan et al., 2018; Santana et al., 2017; Machado et al., 2016; Hu et al., 2016; Silva & Costa, 2015; Padisák et al., 2006).
The biodiversity of the phytoplankton community is influenced and it has the capacity to influence the ecological processes of the ecosystem based on the functional characteristics of each species that make up the community (Lanari & Coutinho, 2010). This biodiversity is responsible for the intense blooms occurrence and the eutrophication process of water bodies, which may worsen the water quality and the risks associated with its composition, considering the presence of Cyanobacteria. Currently, the alterations in the reservoirs have become more common and intense, generated or accelerated by anthropic activities, assuring a greater number of water pollution forms (Straskraba & Tundisi, 2013). It becomes challenging because the degradation speed is higher than the evaluation of the damage impact, complicating the decision-making process for water recovery (Miller et al., 2017).
Although the Broa reservoir is intended for recreation and research purposes, it is inserted in the Tietê-Jacaré hydrographic basin that has potentially polluting activities, such as agriculture, sand mining, livestock, and other point and diffuse sources (Periotto & Tundisi, 2013). The activities includes the disposal of untreated residential effluent, deforestation, sand mining, tourism, intensive sport fishing (Cervi et al., 2016) and agricultural activities, also with areas under legal protection (Tundisi & Tundisi, 2016). There are also reforestation initiatives in the region, besides the natural maintenance from the vegetation cover, highlighting the mosaic vegetation acting as a buffer zone (Tundisi & Tundisi, 2016). Despite these notes, the authors Tundisi and Matsumura-Tundisi (2014) point out that the reservoir maintains its main characteristics.
This environment is considered one of the most studied reservoirs in Limnology, for at least
40 years of information and data applied to several areas of knowledge, contributing to the region development related to social, economic and environmental issues (Periotto & Tundisi, 2013). The phytoplankton community was commonly characterized by the dominance of diatoms and chlorophytes (Tundisi & Matsumura-Tundisi, 2014), except for the year 2014 that presented a pioneering bloom of cyanobacteria (Tundisi et al., 2015). Emphasizing the importance of the study of the phytoplankton community, especially of the Cyanobacteria, due to their capacity to produce toxins (Cyanotoxins) with adverse health effects. Knowing that the phytoplankton composition of the reservoir depends on the environmental variables and their interactions, and that the eutrophication process can alter the occurrence and distribution of phytoplankton (Esteves, 2011), the application of Evenness E2 was performed understand these changes.
T h e B r o a r e s e r v o i r i s c o n s i d e r e d oligo-mesotrophic (Calijuri & Tundisi, 1990; Tundisi & Matsumura-Tundisi, 2014; Tundisi et al., 2015), presenting oscillations in their trophic condition according to the period and specific site of sampling, but remaining between the bands of oligotrophic and mesotrophic (Tundisi, 1977; Luzia, 2009; Tundisi et al., 2015), with a tendency of trophic enrichment coming from the tributaries (Luzia, 2009). Considering the trophic history of the reservoir, the hypothesis is based on the dominance of Cyanobacteria along the longitudinal axis, resulting in low values for the Evenness E2 index. This index of equitability aims to express the way in which the amount of individuals is distributed among the different species, it will be used as an alternative to evaluate the water quality of the reservoir and to verify if it is corroborated by other obtained information.
2. Materials and Methods
2.1. Study area
polymictic and presenting a retention time of less than 25 days (Tundisi & Tundisi, 2016).
According to the Decree nº. 10.755/77, the Carlos Botelho reservoir is classified as class 2 (São Paulo, 1977), and is destined, according to CONAMA resolution no. 20/86, to water domestic supply (considering the conventional water treatment), to aquatic communities protection, to recreation of primary contact, to vegetable and fruit plant irrigation, to natural and intensive plantations for human consumption (Brasil, 1986). As well as the purposes that were pre-determined by law, the regulations regarding limnological variables are also clearly established in the CONAMA Resolution 357/05 (Brasil, 2005).
2.2. Sampling and analysis of samples
The single collecting of five-liter sampling consisted of water from the surface during the dry season (June/2015), at nine points distributed
along the longitudinal axis (P1 to P9). These points comprised the lotic (P1, P2 and P3), central (P4, P5 and P6) and lentic (P7, P8 and P9) region of the reservoir (Thornton et al., 1990) (Figure 1), and each one was meant for the physicochemical and biological analyzes. The collected material was stored and conditioned in thermal bags and sent to the Limnology Laboratory, University of São Paulo (USP). The GPS coordinates (UTM, Datum WGS 84), depth (m), water surface temperature (°C), dissolved oxygen (mg.L-1), electrical conductivity (µS.cm-1), pH and Secchi depth (m) of the water were measured in the field using the YSI 556 MPS multi-parameter probe (HORIBA). The euphotic zone was measured as 2.7 times the depth of Secchi (Cole, 1994). The physicochemical analyzes were performed in the laboratory, following a specific methodology: chlorophyll-a (Chlor. a) (Lorenzen, 1967), nitrite (NO2-) and nitrate (NO3-) (Mackereth et al., 1978), ammonium
(NH4+) (Koroleff, 1976), total nitrogen (T.N.), total phosphorus (T.P.) (Valderrama, 1981) and Orthophosphate (P-ortho) (Strickland & Parsons, 1960).
For the phytoplankton sampling, mesh net with 20 µm was used in horizontal trawls at the water surface (one point per zone), and fixed with formaldehyde (4%); and by direct collection in the photic zone, fixed with 1% acetic lugol, the material was subsequently identified according to current works (Sant’anna et al., 2006; Biolo et al., 2008; Dellamano-Oliveira et al., 2008; Menezes et al., 2011; Nogueira et al., 2011; Ramos et al., 2012; Rosini et al., 2013; Aquino et al., 2014; Souza & Felisberto, 2014; Alves-da-Silva & Klein, 2015), and counted according to Utermöhl (1958) methodology, in sedimentation chambers (Lund et al., 1958) and inverted microscope Zeiss (Axiovert 40C). The density of the phytoplankton community (cel.L-1) was obtained from the count of the organisms in relation to the area of the used sample container (INAG, I.P., 2009), following the Equation 1.
= A*d
N X*
a*v (1)
Where, N: number of units per volume in the sample (units.mL-1), X: average number of units per square or transept (or total number of units in the chamber), A: chamber area, v: sample volume sedimented in chamber, a: area of the counting field (grid, transept or chamber), and d: dilution factor or sample concentration, if applicable. For colonies and filaments, it was necessary to estimate the average number of cells present and to multiply by the number of times they occur.
2.3. Data analysis
The application of Principal Component Analysis (PCA) was performed by using correlation matrix to verify the environmental variability in Carlos Botelho reservoir. The use of row color/symbols, convex hulls and filled regions in order to improve the visualization of the areas
formed by the polygons, and associated with the limnological variables, using the PAST program (3.13) (Hammer, 2001).
The Trophic State Index (TSI) proposed by Lamparelli (2004) was applied, and it was determined from the weighting between values of chlorophyll-a and total phosphorus, and classified as Ultra-oligotrophic, Oligotrophic, Mesotrophic, Eutrophic, Super-eutrophic and Hyper-eutrophic. The reference values to determinate the trophic limits are shown in Table 1.
Data analysis consisted in application of Evenness E2 uniformity index, proposed by Sheldon (1969). Using software PAST (3.13) (Hammer, 2001), the following equation (Equation 2) is applied to the phytoplankton and the index values are generated.
( )
=exp H′
E2 S (2)
The reference values used for the water quality classification from the application of the index to phytoplankton were proposed by Spatharis & Tsirtsis (2010), establishing five (5) classifications (High, Good, Moderate, Low and Bad), where 1 is the maximum value (Table 2).
3. Results
3.1. Phytoplankton characterization
The qualitative analysis of the phytoplankton community from Broa Reservoir was represented by 92 species, distributed in 52 genera and 10 taxonomic classes. The percentage distribution of the community classes is represented in Figure 2. The following taxonomic classes and their respective percentage distribution were identified: Chlorophyceae (38%), Cyanophyceae (28%), Trebouxiophyceae (11%), Bacillariophyceae (8%), Coscinodiscophyceae (5%), Cryptophyceae (3%), Dinophyceae (3%), Euglenophyceae (2%), Xanthophyceae (1%) e Zygnematophyceae (1%) (Figure 2). The Chlorophyceae class presented the greatest richness, grouping 35 species in 13 genera,
Table 1. Trophic state classification for reservoirs (modified by Pompêo, 2017).
Category (Trophic State) Range P-Total – P (mg.m-3) Chlor. a (mg.m-3)
Ultraoligotrophic TSI ≤ 47 P ≤ 8 CL ≤ 1.17
Oligotrophic 47 < TSI ≤ 52 8 < P ≤ 19 1.17 < CL ≤ 3.24
Mesotrophic 52 < TSI ≤ 59 19 < P ≤ 52 3.24 < CL ≤ 11.03
Eutrophic 59 < TSI ≤ 63 52 < P ≤ 120 11.03 < CL ≤30.55
Supereutrophic 63 < TSI ≤ 67 120 < P ≤ 233 30.55 < CL ≤ 69.05
of which the genus Desmodesmus sp. included 8 different species.
The values of the phytoplankton community density are shown in Figure 3, distributed by sample point and taxonomic class, ranging from 32.2. 107 cel.L-1 in P8 to 67.6. 107 cel.L-1 in P4, following the decreasing order: Cyanophyceae, C h l o r o p h y c e a e , C o s c i n o d i s c o p h y c e a e , Tr e b o u x i o p h y c e a e , B a c i l l a r i o p h y c e a e , Cryptophyceae, Dinophyceae, Xantophyceae, Euglenophyceae and Zygnematophyceae. The cell density of Cyanobacteria corresponded to 43.6. 108 cel.L-1 in relation to 8.4. 103 cel.L-1 of Zygnematophyceae class. The Cyanophyceae class was more representative due to the large number of cells of mature colonies of Microcystis
sp. and Aphanocapsa sp. by sample, as well as of filamentous species of Dolichospermum sp. and
Aphanizomenon gracile.
3.2. Limnological characterization
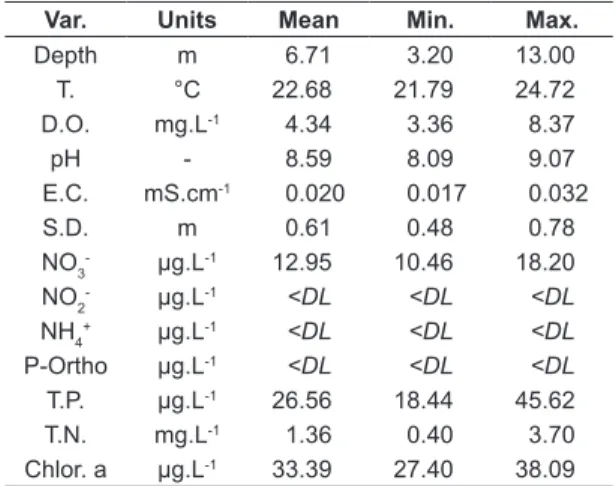
The results from the field and research laboratory analyzes of the following variables (Var.): depth, water surface temperature (T.), dissolved oxygen (D.O.), electrical conductivity (E.C.), hydrogenation potential (pH), Secchi depth (S.D.), chlorophyll-a (Chlor. α), nitrite (N02-), nitrate (NO3-), ammonium (NH
4+), total nitrogen (T.N.), total phosphorus (T.P.) and Orthophosphate (P-ortho) are shown in Table 3, with their units, mean values, minimum (min.) and maximum (max.) values.
The average depth observed in Carlos Botelho reservoir was slightly high (6.7 m), with lower depth in P1 (3.2 m) and gradually increasing towards the dam (13.0 m). The surface temperature of the water had thermal amplitude lower than 3ºC. The concentration of dissolved oxygen showed low values in all the sampled points, except for the peak in P1 (8.37 mg.L-1). The values of pH, electrical conductivity and Secchi depth were quite homogeneous along the longitudinal axis observed in the water body, presenting small
amplitude of variation, with average values of 8.59, 0.02 mS.cm-1 and 0.61 m, respectively. The inorganic nutrients analysis indicated low values of nitrate (12.95 µg.L-1) and total phosphorus (26.56 µg.L-1) in the environment. The nitrite, ammonium and orthophosphate analyzes indicated Table 2. Reference values of Evenness E2 index to
phytoplankton classifying the water quality (Spatharis & Tsirtsis, 2010).
Water quality classification Evenness E2
High 0.96-0.77
Good 0.77-0.46
Moderate 0.46-0.30
Low 0.30-0.21
Bad 0.21-0.09
Table 3. Data from physicochemical analyzes obtained in the field and posterior laboratory analysis.
Var. Units Mean Min. Max.
Depth m 6.71 3.20 13.00
T. °C 22.68 21.79 24.72
D.O. mg.L-1 4.34 3.36 8.37
pH - 8.59 8.09 9.07
E.C. mS.cm-1 0.020 0.017 0.032
S.D. m 0.61 0.48 0.78
NO3- μg.L-1 12.95 10.46 18.20
NO2- μg.L-1 <DL <DL <DL
NH4+ μg.L-1 <DL <DL <DL
P-Ortho μg.L-1 <DL <DL <DL
T.P. μg.L-1 26.56 18.44 45.62
T.N. mg.L-1 1.36 0.40 3.70
Chlor. a μg.L-1 33.39 27.40 38.09
(<DL): Values that presented concentration lower than that detectable by the analysis method.
Figure 2. Percentage distribution of the phytoplankton community classes from Broa reservoir.
values below the Detection Limit (<DL). In contrast, high values of chlorophyll-a were found, with a average value of 33.39 µg.L-1 and a maximum value in P3 (38.09 µg.L-1). In addition, the average value of total nitrogen was relatively high (1.36 mg.L-1), with peak occurring at P7 (3.70 mg.L-1), as recorded in Table 3.
3.3. Data analysis
In order to verify the environmental variability in Carlos Botelho reservoir, visualizing the distribution of the sampling points in relation to the environmental variables, with a possible delimitation of compartments, the Principal Component Analysis (PCA) was performed with the use of row color/symbols, convex hulls and filled regions (Figure 4). The axis 1 explains 33.34% and the axis 2 explains 23.34%. There was the formation of two groups, one formed by the junction of points 1, 2, 3 and 4 and the other containing points 5, 6, 7, 8 and 9, delimiting two
regions along the axis in the reservoir, establishing a positive correlation with the variables OD and T; and, Depth, pH and Chlor. a, respectively.
The trophic state of the reservoir ranged from Mesotrophic to Super-eutrophic for the points along the longitudinal axis included in the study, resulting, under weighting, in the trophic Broa system (Eutrophic). The values of chlorophyll-a influenced more drastically in relation to the index applied to total phosphorus, resulting in eutrophic values to super-eutrophic, and mesotrophic, respectively (Table 4).
The results of the Evenness E2 Equity Index for the phytoplankton community are shown in Table 5. The values presented small amplitude of variation, in which the minimum value corresponds to 0.1142 in P1 and maximum value to 0.1468 in P2, both classified as “Bad” according to the applied methodology. The other points studied in the reservoir also presented water quality framed as Bad.
4. Discussion
The Chlorophyceae and Cyanobacteria classes contribute with almost 70% of the phytoplankton algal species in Carlos Botelho reservoir (Lobo/Broa), that in term of density, the last class stands out. These classes present particular characteristics that imply advantages in attracting resources in the phytoplankton interrelationships with other aquatic communities, as the selective predation of the zooplankton community (Borges et al., 2008; Bellinger & Sigee, 2010). The Chlorophyceae present a good development even in environments with much diversified habitats, because green algae differ significantly in relation to their ecological preferences, including specialist and generalist species (Bellinger & Sigee, 2010). The-Cyanobacteria are favored in environments with high temperature and are able to associate Figure 4. Principal Component Analysis (PCA) formed by
axes 1 and 2 from correlation of limnological variables in surface waters of 9 collection points in the Broa reservoir. NO3-: nitrate concentration, T.P.: total phosphorus, Chlor. a: Chlorophyll-a, T.N.: total nitrogen, Depth, T: surface temperature, E.C.: electrical conductivity, pH: hydrogenation potential, S.D.: Secchi depth, and D.O.: dissolved oxygen.
Table 4. Classification of Broa reservoir according Trophic State Index in 9 points (P1 to P9) along a longitudinal transect.
TSI P1 P2 P3 P4 P5 P6 P7 P8 P9
Chlor. a 63.5 63.0 64.6 64.2 63.5 64.3 63.6 64.5 64.0
T.P. 52.4 55.7 57.6 56.2 53.0 53.7 53.0 52.4 52.1
Average 58.0 59.3 61.1 60.2 58.2 59.0 58.3 58.5 58.1
Classification Meso Eutro Eutro Eutro Meso Eutro Meso Meso Meso
Table 5. Water quality classification of Broa reservoir according to Evenness E2 Index in 9 points (P1 to P9) along a longitudinal transect.
P1 P2 P3 P4 P5 P6 P7 P8 P9
Evenness E2 0.1142 0.1468 0.1282 0.1451 0.1466 0.1152 0.1302 0.132 0.132
with aerobic bacteria to tolerate low N:P rates, high pH values and low CO2 concentrations (Bellinger & Sigee, 2010), and to show greater efficiency in nutrient and light uptake, favoring its dispersion (Sant’anna et al., 2008).
The main problem related to the composition of the phytoplankton community is associated with the massive presence of Cyanobacteria, since they contribute to the intense primary production, forming dense blooms and contributing to the increase of trophic level. The eutrophication process is driven by favorable environmental conditions, such as: occurrence, even if limited, of vertical stratification (thermal and chemical); relative stability of the water column (continuous circulation for most of the year) (Tundisi & Matsumura-Tundisi, 2014); high water temperatures (above 21°C) and high nutrient concentration (Paerl & Otten, 2013) from identified domestic and agricultural effluent discharges (Periotto & Tundisi, 2013), favoring this class to have greater success combined with the advantages adaptations of some of its representatives. The low residence time of water indicates an unfavorable characteristic for community establishment in general (Paerl & Otten, 2013), because there is water recycling providing less time to establish and/or optimal development of the community.
The short residence time characteristic of the reservoir is minimized during the winter season, because there is a reduction in the frequency of rainfall, favoring the increase of primary productivity and growth of blooms (Chalar, 2009), as indicated by the high average value of Chlorophyll-a (Chlor. a: ~33.39 µg.L-1). Other works previously performed in the reservoir already indicated an increase in phytoplankton biomass, with chlorophyll-a values ranging from 5.0 to 15.0 µg.L-1 in Tundisi (1977) study, compared with values ranging from 0.057 to 7.98 µg.L-1 during the dry season of 2005, representing the upstream area and near the dam of the Broa reservoir, respectively, and the predominance of the Bacillariophyceae class (Luzia, 2009).
The composition of the phytoplankton commonly documented in databases of the Broa reservoir was diatoms and chlorophyts, and the Cyanobacteria contributed minimally to the total biomass (Tundisi & Matsumura-Tundisi, 2014). According to Tundisi et al. (2015), the first bloom of Cyanobacteria observed in Carlos Botelho reservoir was in the 2014 winter, pointed out the climatic changes as starting more intense and
recurrent blooms. They based their arguments on the variations observed in the hydrological and climatic regime, in the increase of the water average temperature in the winter and lower rainfall during the summer, that combined with the increase of the retention time, due to the dam operational methods, promoted the blooms growth.
In other tropical and subtropical reservoirs, the presence and dominance of Cyanobacteria was well documented, as in the Salto Grande subtropical reservoir, especially M. aeruginosa
(Chalar, 2009); in the Itupararanga reservoir, in response to high levels of observed trophic state (Beghelli et al., 2016); and in the Billings and Guarapiranga Reservoirs, two important bodies of water for public supply, especially the presence of
M. aeruginosa for both reservoirs and C. raciborskii
for the Billings Reservoir (Carvalho et al., 2007). However, in 2016 the dominance of
Cylindrospermopsis raciborskii was also observed in the Guarapiranga reservoir (Machado et al., 2016). The dominance of Cyanobacteria was reinforced in the Billings (Taquacetuba branch) indicating hypereutrophy, with high values of total phosphorus and chlorophyll-a (Moschini-Carlos et al., 2010).
Thus, organisms with better adaptive advantages overcome in abundance and/or distribution in the water column, resulting in a very heterogeneous community (Sant’anna et al., 2008). As a consequence, other aquatic communities may be harmed by eutrophication, with the mortality of species of ichthyofauna recorded during periods of intense flowering, which may be associated with the concentration of cyanotoxins in the water body (Tundisi et al., 2015). For this reason, fish consumption is not indicated in the reservoir (Straskraba & Tundisi, 2013).
The high density of the phytoplankton community in the Broa reservoir makes it an interesting environment to carry out studies related to the identification and quantification of secondary metabolites produced by some genera of Cyanobacteria. This is because the five most abundant genera recorded have a toxic potential due to their ability to production the following toxins: Anatoxin-a/homoanatoxin-a, Beta-Methylamino-L-alanine (BMAA), Cylindrospermopsin, Aeruginosin, Microcystin and Cyanopeptolin (Paerl & Otten, 2013). The release of these substances into the water has the potential to compromise the multiple uses of the water system (Sant’anna et al., 2008; Tundisi et al., 2015; Pompêo, 2017) from the presence of the following genera:
Aphanizomenon sp., Microcystis sp., Aphanocapsa sp.,
Dolichospermum sp. and Cylindrospermopsis sp., identified in the present work.
From the comparison of the results obtained from the limnological variables with the pertinent regulatory values (Resolution CONAMA 357/05) (Brasil, 2005), some parameters were not in accordance with the legislation: dissolved oxygen, total nitrogen, concentration of chlorophyll-a and Cyanobacteria density. Other environmental variables (depth, water surface temperature, electrical conductivity, pH, nitrite, nitrate, ammonium, total phosphorus and orthophosphate) also influence directly and/or indirectly phytoplankton dynamics. The analysis of hydrobiological variables (chlorophyll-a concentration and Cyanobacteria density) evidenced a eutrophic environment, with high nutrient amount, but with diffuse discharges of effluents from the drainage basin, which may cause some episodes of Cyanobacteria blooms over time. Blooms results in the increase of algal biomass and tends to occur in a short time. This contributes to an equally fast degradation and decomposition, with dissolved oxygen consumed by organisms during the decomposition process and the nutrients reinserted in the water body (Pompêo et al., 2015).
The low concentrations of dissolved oxygen recorded in 8 of 9 sampling points indicate a degraded environment, considering the low degree of water aeration, a good indicator variable of quality (Euba Neto et al., 2012). The proportion between respiration and photosynthesis processes is higher than the ideal ratio of 1:1, indicating a deficient cycling for this variable. In reservoirs, it is expected that the concentration of dissolved oxygen reduces from the river towards the dam (Thornton et al., 1990). However, it tends to be
problematic when complemented by polluting contributions, especially in urban scenarios, as occurs in this study, with discharge of domestic effluents in the Itaqueri River coming from Itirapina city (Periotto & Tundisi, 2013).
The discard of untreated domestic effluents commonly from urban centers, such as the city of Itirapina, contributes to the considerable increase of organic material for the water body, reaching the Broa reservoir. However, if such effluents were treated in wastewater treatment stations (ETEs in Brazil), nutrient concentrations would not be fully removed, considering the treatment steps commonly applied in the country, inciting the issue of discarded effluents organic amount. Consequently, the water body is enriched, with consequent increase of its trophic level, changing from oligotrophic to eutrophic, and accumulates the necessary nutrients for the uncontrolled growth of phytoplankton biomass, culminating in the eutrophication process (Bellinger & Sigee, 2010; Pompêo, 2017). The present work indicated the high values of density in the reservoir community (32.2. 107-67.6. 107 cel.L-1), whose minimum density value of the data range is more than six times higher than the values imposed by the current Resolution (5.107 cel.L-1) (Brasil, 2005).
Among the mentioned nutrients, there is the nitrogen, one of the elements most demanded by living cells. This element is not accordance with the CONAMA resolution (Brasil, 2005) in 6 of 9 points, with a peak in P7, coinciding with the Perdizes River´s mouth. The analysis of other nutrients indicated low values of nitrate and total phosphorus, and the nitrite, ammonium and orthophosphate analyzes indicated values below the Detection limit (<DL), in contradiction to what was expected, considering the trophic history of the reservoir. The low values of nutrient concentrations registered in the reservoir, including those that were below the detection limit, are involved with the dynamics of the aquatic ecosystem itself, with the nutrient concentration mainly associated with the primary productivity, allied to additional anthropogenic content; to bio-chemical cycles, cycle stages and biological availability of their respective fractions, considering their interactions with the compartments (air, water and sediment); and to the rapid cycling of the water attributed to the short residence time of the reservoir (Tundisi & Tundisi, 2016).
input through the surface runoff, an important entry route of nutrients into the water body (Tundisi & Matsumura-Tundisi, 2014). The agricultural activities in the hydrographic basin, with the predominance of sugarcane cultivation, have their harvest period during the dry season, ensuring that fewer nutrients are carried into the reservoir in a possible precipitation event, in compared to those occurring during the summer, in which the soil is continuously being artificially enriched. Other possibilities are associated to the presence of aquatic macrophytes banks located in the sources of water bodies (Tundisi et al., 2015), and to the presence of wetlands in the Lobo and Itaqueri tributaries (Periotto & Tundisi, 2013), reducing the contribution and/or controlling the nutrient content, maintaining the water quality.
A c c o r d i n g t o t h e a u t h o r s Tu n d i s i & Matsumura-Tundisi (2014) the nutrient concentration peaks in the water body are sufficient to alter the trophic degree of the reservoir, providing a basis for them to argue that the eutrophication in the Broa Reservoir is not a result of a continuous process. According to Tundisi et al. (2015), the trophic level historically observed in the Broa reservoir corresponded to the oligomesotrophic classification; while Luzia (2009) recorded an oligomesotrophic level, with a tendency for trophic enrichment from the Itaqueri River affluent in the year 2005. The Trophic State Index applied for the results obtained in the 2015 year ranged from mesotrophic to supereutrophic. The concentration values of chlorophyll-a had a stronger influence on the results of this index, since values of the TSI (Chlorophyll-a) presented values higher than the TSI (total phosphorus), indicating a significant change in the composition of the community observed, as dominance of the Cyanobacteria. Thus, the level trophic changed from oligotrophic to eutrophic, indicating trophic enrichment of the reservoir.
The physical, chemical and biological variables and the applied indices did not indicate variation according to the theoretical delimitation of the river, center and dam zones defined by Thornton et al. (1990) for reservoirs, based on analysis of the data matrix, thus not indicating the presence of a longitudinal gradient. However, the PCA analysis indicated that the distribution of the sampling points in relation to the environmental variables presented a zonation pattern, with the possible delimitation of two large compartments composed of points 1 to 4 and 5 to 9. The suppression
of the intermediate region of the reservoir was attributed to the short residence time of the water, which makes it impossible to form a delimitation marked area of the intermediate environmental conditions between lotic and lentic environments.
Therefore, the environmental variables dissolved oxygen and temperature were positively related to the lotic zone, since it presented a characteristic of better oxygenation, and high temperatures associated to the central body, where all the samplings were taken. The second axis corresponded to the association of the variables Depth, pH and Chlorophyll-a. The depth did not constitute a significant variable when disassociated with vertical gradients, however, it established a consistent relation with the concentration of dissolved oxygen. The pH and Chlorophyll-a variables were associated, since chlorophyll-a is a metric of algal biomass, and the phytoplankton is favored in environments with high pH values, in addition to high temperatures and tolerance at low N:P rates (Bellinger & Sigee, 2010). The variable Secchi depth presented positive association with both axes, since the depth of the euphotic zone along the central body of the reservoir was very homogeneous.
The classification of the results obtained from the Evenness E2 indicated a “Bad” classification in all sample points of the reservoir, according to the TSI (eutrophic) response and to the Chlorophyll-a and Cyanobacteria concentration registered. Although the index be defined mainly by phytoplankton density, it was satisfactory, since it corroborated the influence of the community as sensitive to the physicochemical alterations of the water and as bioindicator organisms. Attention to the application of this index should be considered since it is used for comparative purposes (Sheldon, 1969). The author points out that the number of species sampled (S) is determinant to make it concise, being stable for S > 20. Since the community included 92 identified and counted species, the application result was considered valid. Borges et al. (2008) observed a scenario closed to the present work in a study of daily variation in eutrophic environment, highlighting the low equitability with occurrence and dominance of Cyanobacteria in one arm of the Rosana reservoir (Ribeirão do Corvo, Paraná, Brazil).
environmental condition variable corresponding to the total phosphorus concentration and a biological response variable (Chlorophyll-a). The trophic levels are associated with the intensity of the eutrophication process, so it can be considered a more robust index to evaluate the ecological potential of a reservoir. However, considering that Evenness E2 is an index of equitability applicable to the phytoplankton community, it is a more accurate biological indicator than a metric of abundance obtained from the quantification of photosynthetic pigments, although satisfactory. This index, individually analyzed, is able to derive a biological response and to identify ecological imbalances, but it is not robust in integrated environmental approaches, since it does not accompany any physical-chemical variables in its composition, being necessary the accomplishment of complementary analyzes.
Thus, it is possible to apply the Evenness E2 index in the evaluation of the ecological potential combined with complementary environmental analyzes, so that can robustly measure water quality. For both indexes, the knowledge of the composition of the community enriches the results, since different taxa imply different measures of flowering containment and modulate the risk with which the water quality is associated. In this study, the hypothesis of dominance of Cyanobacteria along the longitudinal axis was corroborated from indicative of the trophic degree associated with the TSI and low values for the Evenness E2 index.
5. Conclusion
The results are associated to the sanitary problem of the reservoir, giving margin to the occurrence of blooms and consequently to the presence of Cyanobacteria. Despite the diffuse sources of phosphorus and nitrogen, Cyanobacteria can develop more efficiently in environments with a higher trophic level, as observed by the massive presence of Aphanizomenon gracile in the eutrophic environment, with high concentrations of nitrogen, chlorophyll-a, Cyanobacteria density and low concentrations of dissolved oxygen.
The control of the effluents from the basin activities and other nutrient sources, mainly nitrogen and phosphorus, is determinant in the control of the eutrophication process. This process prioritizes the phosphorus concentration, since nitrogen sources can be difficult to identify, because it includes the fixation of atmospheric nitrogen by some algae. The use of biological communities and application
of Evenness E2 proved to be satisfactory when compared to limnological analysis, since it made the environmental analysis more accomplished and it also assisted in better understanding of the other results, contributing to more robust information for the decision maker.
The application of the Evenness E2 index using the phytoplankton community indicated that the water quality of the Broa reservoir is compromised by the presence of potentially toxic species. This condition may influence the multiple uses of the reservoir and bring risks to human and ecosystem health. Complementary studies should be performed to determine the toxicity that the ecosystem is subject.
Acknowledgements
The authors are grateful to CAPES, to FAPESP (Processes 2014/22581-8; 2016/17266-1), to the research group of the Limnology Laboratory, to the Institute of Biosciences (IB) of the University of São Paulo (USP), to the Environmental Sciences Program (PROPG), to the Institute of Science and Technology of the São Paulo State University “Júlio de Mesquita Filho” (UNESP), for direct and indirect collaboration in the present work. The study is part of the Dissertation Project “Assessment of the spatial heterogeneity of the Carlos Botelho Reservoir (Lobo/Broa), with emphasis on the phytoplankton community”.
References
A LV E S - D A - S I LVA, S.M. and K L E I N, I.C. Euglenophyceae na Área de Proteção Ambiental do Rio Ibirapuitã, sudoeste do Estado do Rio Grande do Sul, Brasil. 1. Cryptoglena Marin & Melkonian emend. Kosmala & Zakrýs, Monomorphina (Ehrenberg) Mereschkowsky emend. Kosmala & Zackýs e Phacus Durjardin. Hoehnea, 2015, 42(3), 471-496. http://dx.doi.org/10.1590/2236-8906-12/2015.
AQUINO, C.A.N., BUENO, N.C. and MENEZES, V.C. Desmidioflórula (Zygnemaphyceae, Desmidiales) do rio Cascavel, Oeste do Estado do Paraná, Brasil.
Hoehnea, 2014, 41(3), 365-392. http://dx.doi. org/10.1590/S2236-89062014000300005. BEGHELLI, F.G.S., FRASCARELI, D., POMPÊO,
BELLINGER, E.G. and SIGEE, D.C. Freshwater algae:
identification and use as bioindocators. Hoboken: Wiley-Blackwell, 2010, 164 p. http://dx.doi. org/10.1002/9780470689554.
BIOLO, S., SIQUEIRA, N.S., BORTOLINI, J.C. and BUENO, N.C. Desmidiaceae (exceto Cosmarium) na comunidade perifítica em um tributário do reservatório Itaipu, Paraná, Brasil. Revista Brasileira de Biociências, 2008, 6(1), 8-10.
BORGES, P.A.F., TRAIN, S. and RODRIGUES, L.C. Estrutura do fitoplâncton, em curto período de tempo, em um braço do reservatório de Rosana (ribeirão do Corvo, Paraná, Brasil). Acta Scientiarum. Biological Sciences, 2008, 30(1), 57-65. http://dx.doi. org/10.4025/actascibiolsci.v30i1.1449.
BRASIL. Conselho Nacional de Meio Ambiente. Resolução CONAMA nº 20, de 18 de junho de 1986.
Diário Oficial da União [da] República Federativa do Brasil [online], Poder Executivo, Brasília, DF, 30 jul. 1986 [viewed 2 Apr. 2016]. Available from: http://www.mma.gov.br/port/conama/res/res86/ res2086.html
BRASIL. Conselho Nacional de Meio Ambiente. Resolução nº 357, de 17 de março de 2005.Diário Oficial da União [da] República Federativa do Brasil
[online], Poder Executivo, Brasília, DF, 18 mar. 2005, pp. 58-63 [viewed 10 Oct. 2017]. Available from: http://www.mma.gov.br/port/conama/res/res05/ res35705.pdf
BUNN, S.E. and ARTHINGTON, A.H. Basic principles and ecological consequences of altered flow regimes for aquatic biodiversity. Environmental Management, 2002, 30(4), 492-507. http://dx.doi. org/10.1007/s00267-002-2737-0. PMid:12481916. CALIJURI, M.C. and TUNDISI, J.G. Limnologia
comparada das represas do Lobo (Broa) e Barra Bonita, Estado de São Paulo: mecanismos de funcionamento e bases para o gerenciamento.
Brazilian Journal of Biology = Revista Brasileira de Biologia, 1990, 50(4), 893-913.
CARVALHO, L.R., SANT’ANNA, C.L., GEMELGO, M.C.P. and AZEVEDO, M.T.P. Cyanobacterial occurrence and detection of microcystin by planar chromatography in surface water of Billings and Guarapiranga Reservoirs, SP, Brazil. Brazilian Journal of Botany, 2007, 30(1), 141-148. http://dx.doi. org/10.1590/S0100-84042007000100014. CERVI, E.C., FERNANDES, F., MIRANDA, R.B.,
MAUAD, F.F., MICHALOVICZ, L. and POLETO, C. Geochemical speciation and risk assessment of metals in sediments of the Lobo-Broa Reservoir, Brazil. Management of Environmental Quality, 2016, 28(3), 430-443. http://dx.doi.org/10.1108/MEQ-09-2015-0171.
CHALAR, G. The use of phytoplankton patterns of diversity for algal bloom management. Limnologica,
2009, 39(3), 200-208. http://dx.doi.org/10.1016/j. limno.2008.04.001.
CIRÉS, S. and BALLOT, A. A review of the phylogeny, ecology and toxin production of bloom-forming Aphanizomenon spp. and related species within the Nostocales (Cyanobacteria). Harmful Algae, 2016, 54, 21-43. http://dx.doi.org/10.1016/j. hal.2015.09.007. PMid:28073477.
COELHO, A.L.N. Geomorfologia fluvial de rios impactados por barragens. Caminhos de Geografia, 2008, 9(26), 16-32.
COLE, G.A. Textbook of limnology. Illinois: Waveland Press, 1994. 412 p.
CUNHA, D.G.F., CALIJURI, M.C. and LAMPARELLI, M.C. A trophic state index for tropical/subtropical reservoirs (TSItsr). Ecological Engineering, 2013, 60, 126-134. http://dx.doi.org/10.1016/j. ecoleng.2013.07.058.
DELLAMANO-OLIVEIRA, M.J., SANT’ANNA, C.L., TANIGUCHI, G.M. and SENNA, P.A.C. Os gêneros Staurastrum, Staurodesmus e Xanthidium
(Desmidiaceae, Zygnemaphyceae) da Lagoa do Caçó, Estado do Maranhão, Nordeste do Brasil. Hoehnea, 2008, 35(3), 333-350. http://dx.doi.org/10.1590/ S2236-89062008000300001.
ESTEVES, F. A. Fundamentos de limnologia. 3. ed. Rio de Janeiro: Interciência, 2011. 826 p.
EUBA NETO, M., SILVA, W.O., RAMEIRO, F.C., NASCIMENTO, E.S. and ALVES, A.S. Análises físicas, químicas e microbiológicas das águas do balneário Veneza na bacia hidrográfica do médio Itapecuru, MA. Arquivos do Instituto Biológico, 2012, 79(3), 397-403. http://dx.doi.org/10.1590/S1808-16572012000300010.
HAMMER, Ø.D. PAST: paleontological statistics software package for education and data analysis [online]. 2001 [viewed 20 Sep. 2016]. Available from: http://folk. uio.no/ohammer/past
HU, R., LI, Q., HAN, B.-P., NASELLI-FLORES, L., PADISAK, J. and SALMASO, N. Tracking management-related water quality alterations by phytoplankton assemblages in a tropical reservoir.
Hydrobiologia, 2016, 763(1), 109-124. http://dx.doi. org/10.1007/s10750-015-2366-2.
INSTITUTO DA ÁGUA – INAG, I.P. Manual para a avaliação da qualidade biológica da água: Protocolo de amostragem e análise para o fitoplâncton [online]. Brasília: Ministério do Ambiente, do Ordenamento do Território e do Desenvolvimento Regional, Instituto da Água, I.P., 2009 [viewed 3 July 2018]. Available from: https://www.apambiente.pt/dqa/ assets/protocolo-de-amostragem-e-an%C3%A1lise-para-o-fitopl%C3%A2ncton.pdf
Estudos Avançados, 1990, 4(8), 126-143. http:// dx.doi.org/10.1590/S0103-40141990000100010. KOROLEFF, F. Determination of nutrients. In: K.
Grasshoff (Ed.). Methods of seawater analisys. Weinhein: Verlag Chemie, 1976. p. 117-181. LAMPARELLI, M.C. Grau de trofia em corpos d’água
do estado de São Paulo: avaliação dos métodos de monitoramento [Tese de Doutorado em Ecologia Aplicada]. São Paulo: Universidade de São Paulo, 2004.
LANARI, M.O. and COUTINHO, R. Biodiversidade e Funcionamento de Ecossistemas: síntese de um paradigma e sua expansão em ambientes marinhos.
Oecologia Australis, 2010, 14(4), 959-988. http:// dx.doi.org/10.4257/oeco.2010.1404.09.
LEWIS, M.A. Use of freshwater plants for phytotoxicity testing: a review. Environmental Pollution, 1995, 87(3), 319-336. http://dx.doi.org/10.1016/0269-7491(94)P4164-J. PMid:15091582.
LORENZEN, C.J. Determination of chlorophyll and pheo-pigments: Spectrophotometric equations.
Limnology and Oceanography, 1967, 12(2), 343-346. http://dx.doi.org/10.4319/lo.1967.12.2.0343. LUND, J.W.G., KIPLING, C. and LE CREN, E.D.
The inverted microscope method of estimating algal numbers and the statistical basis of estimations by counting. Hydrobiologia, 1958, 11(1), 143-170. http://dx.doi.org/10.1007/BF00007865.
LUZIA, A.P. Estrutura organizacional do fitoplâncton nos sistemas lóticos e lênticos da bacia do Tietê-Jacaré (UGRHI Tietê-Jacaré) em relação à qualidade da água
e estado trófico [Tese de Doutorado em Ciências]. São Carlos: Universidade Federal de São Carlos, 2009. MACHADO, L.S., SANTOS, L.G., LOPEZ-DOVAL,
J.C., POMPEO, M.L.M. and MOSCHINI-CARLOS, V. Fatores ambientais relacionados à ocorrência de cianobactérias potencialmente tóxicas no reservatório de Guarapiranga. Revista Ambiente & Água, 2016, 11(4), 810-818. http://dx.doi. org/10.4136/ambi-agua.1941.
MACKERETH, F.J.H.; HERON, J. and TALLING, J.F.
Water analysis: some revised methods for limnologists. Ambleside: Freshwater Biological Association, 1978. MENEZES, V.C., BUENO, N.C., BORTOLINI,
J.C. and GODINHO, L.R. Chlorococcales sensu lato (Chlorophyceae) em um lago artificial urbano, Paraná, Brasil. Iheringia. Série Botânica, 2011, 66(2), 227-240.
MILLER, R.J., BENNETT, S., KELLER, A.A., PEASE, S. and LENIHAN, H.S. TiO2 nanoparticles are phototoxic to marine phytoplankton. PLoS One, 2012, 7(1), 1-7. http://dx.doi.org/10.1371/journal. pone.0030321. PMid:22276179.
MILLER, R.J., MULLER, E.B., COLE, B., MARTIN, T., NISBET, R., BIELMYER-FRASER, G.K.,
JARVIS, T.A., KELLER, A.A., CHERR, G. and LENIHAN, H.S. Photosynthetic efficiency predicts toxic effects of metal nanomaterials in phytoplankton.
Aquatic Toxicology (Amsterdam, Netherlands), 2017, 183, 85-93. http://dx.doi.org/10.1016/j. aquatox.2016.12.009. PMid:28039777.
MOSCHINI- CARLOS, V., FREITAS, L. and POMPÊO, M.L.M. Limnological evaluation of water in the Rio Grande and Taquacetuba branches of the Billings Complex (São Paulo, Brazil) and management implications. Revista Ambiente & Água, 2010, 5(3), 47-59. http://dx.doi.org/10.4136/ambi-agua.153.
NOGUEIRA, I.S., GAMA JÚNIOR, W.A. and D’ALESSANDRO, E.B. Cianobactérias planctônicas de um lago artificial urbano na cidade de Goiânia, GO. Brazilian Journal of Botany, 2011, 34(4), 575-592. http://dx.doi.org/10.1590/S0100-84042011000400011.
PADISÁK, J., BORICS, G., GRIGORSZKY, I. and SORÓCZKI-PINTÉR, E. Use of phytoplankton assemblages for monitoring ecological status of lakes within the Water Framework Directive: the assemblage index. Hydrobiologia, 2006, 553(1), 1-14. http://dx.doi.org/10.1007/s10750-005-1393-9. PAERL, H.W. and OT TEN, T.G. Harmful
cyanobacterial blooms: causes, consequences, and controls. Microbial Ecology, 2013, 65(4), 995-1010. http://dx.doi.org/10.1007/s00248-012-0159-y. PMid:23314096.
PARMAR, T.K., RAWTANI, D. and AGRAWAL, Y.K. Bioindicators: the natural indicator of environmental pollution. Frontiers in Life Science, 2016, 9(2), 110-118. http://dx.doi.org/10.1080/21553769.2016.1 162753.
PERIOTTO, N.A. and TUNDISI, J.G. Ecosystem services of UHE Carlos Botelho (Lobo/Broa): a new approach for management and planning of dams multiple-uses. Brazilian Journal of Biology = Revista Brasileira de Biologia, 2013, 73(3), 471-482. http:// dx.doi.org/10.1590/S1519-69842013000300003. PMid:24212686.
State, Brazil. Hoehnea, 2012, 39(3), 421-434. http:// dx.doi.org/10.1590/S2236-89062012000300006. ROSINI, E.F., SANT’ANNA, C.L. and TUCCI, A.
Scenedesmaceae (Chlorococcales, Chlorophyceae) de pesqueiros da Região Metropolitana de São Paulo, SP, Brasil: levantamento florístico. Hoehnea, 2013, 40(4), 661-678. http://dx.doi.org/10.1590/S2236-89062013000400008.
SANT’ANNA, C.L., AZEVEDO, M.T.P., WERNER, V.R., DOGO, C.R., RIOS, F.R. and CARVALHO, L.R. Review of toxic species of Cyanobacteria in Brazil. Algological Studies, 2008, 126(1), 251-265. http://dx.doi.org/10.1127/1864-1318/2008/0126-0251.
SANT’ANNA, C.L., AZEVEDO, M.T. P., AGUJARO, L.F., CARVALHO, M.C., CARVALHO, L.R. and SOUZA, R.C.R. Manual ilustrado para identificação e contagem de cianobactérias planctônicas de águas
continentais brasileiras. São Paulo: Sociedade Brasileira de Ficologia, 2006. 58 p.
S A N TA N A, L.M., C RO S S E T T I, L.O. and FERRAGUT, C. Ecological status assessment of tropical reservoirs through the assemblage index of phytoplankton functional groups. Brazilian Journal of Botany, 2017, 40(3), 695-704. http://dx.doi. org/10.1007/s40415-017-0373-4.
SÃO PAULO. Decreto no 10.755, de 22 de novembro de 1977. Dispõe sobre o enquadramento dos corpos de água receptores na classificação prevista no Decreto nº 8.468, de 8 de setembro de 1976, e dá providências correlatas. Diário Oficial do Estado de São Paulo [online], Diário do Executivo, São Paulo, SP, 1977 [viewed 30 Nov. 2017]. Available from: http:// www.sigrh.sp.gov.br/arquivos/enquadramento/ Dec_Est_10755.pdf
SHELDON, A.L. Equitability indices: dependence on species count. Ecology, 1969, 50(3), 466-467. http:// dx.doi.org/10.2307/1933900.
SILVA, A.P.C. and COSTA, I.A.S. Biomonitoring ecological status of two reservoirs of the Brazilian semi-arid using phytoplankton assemblages (Q index). Acta Limnologica Brasiliensia, 2015, 27(1), 1-14. http://dx.doi.org/10.1590/S2179-975X2014. SMITH, S.C.F., MEINERS, S.J., HASTINGS, R.P.,
THOMAS, T. and COLOMBO, R.E. Low‐ head dam impacts on habitat and the functional composition of fish communities. River Research and Applications, 2017, 33(5), 680-689. http://dx.doi. org/10.1002/rra.3128.
SOUZA, D.B.S. and FELISBERTO, S.A. Comasiella, Desmodesmus, Pectinodesmus e Scenedesmus na comunidade perifítica em ecossistema lêntico tropical, Brasil Central. Hoehnea, 2014, 41(1), 109-120. http://dx.doi.org/10.1590/S2236-89062014000100010.
SPATHARIS, S. and TSIRTSIS, G. Ecological quality scales based on phytoplankton for the implementation of Water Framework Directive in the Eastern Mediterranean. Ecological Indicators, 2010, 10(4), 840-847. http://dx.doi.org/10.1016/j. ecolind.2010.01.005.
STRASKRABA, M. and TUNDISI, J.G. Gerenciamento da qualidade da água de reservatórios específicos. In: M. STRASKRABA and J.G. TUNDISI, eds.
Gerenciamento da qualidade da água de represas. 3. ed. São Carlos: ILEC/IEE, 2013, pp. 183-193. STRICKLAND, J.D.H. and PARSONS, T.R. A manual
of sea water analysis. Bulletin - Fisheries Research Board of Canada, 1960, 25, 1-185.
THORNTON, K.W., KIMMEL, L.B. and FONEST, E.P. Reservoir limnology: ecological perspectives. New York: John Wiley, 1990.
TUNDISI, J.G. (1977). Produção primária, “Standing- stock”, fracionamento do fitoplâncton e fatores ecológicos em ecossistema lacustre artificial (Represa do broa, São Carlos) [Tese de Livre Docência]. São Paulo: Universidade de São Paulo, 1977.
TUNDISI, J.G. and MATSUMURA-TUNDISI, T. The ecology of UHE Carlos Botelho (Lobo-Broa Reservoir) and its watershed, São Paulo, Brazil.
Freshwater Reviews, 2014, 6(2), 75-91. http://dx.doi. org/10.1608/FRJ-6.2.727.
TUNDISI, J.G. and TUNDISI, T.M. Integrating ecohydrology, water management, and watershed economy: case studies from Brazil. Ecohydrology & Hydrobiology, 2016, 16(2), 83-91. http://dx.doi. org/10.1016/j.ecohyd.2016.03.006.
TUNDISI, J.G., MATSUMURA-TUNDISI, T., ARANTES JÚNIOR, J.D., TUNDISI, J.E., MANZINI, N.F. and DUCROT, R. The response of Carlos Botelho (Lobo, Broa) reservoir to the passage of cold fronts as reflected by physical, chemical, and biological variables. Brazilian Journal of Biology = Revista Brasileira de Biologia, 2004, 64(1), 177-186. http://dx.doi.org/10.1590/S1519-69842004000100020. PMid:15195377.
TUNDISI, J.G., MATSUMURA-TUNDISI, T., TUNDISI, J.E.M., BLANCO, F.P., ABE, D.S., CONTRI CAMPANELLI, L., SIDAGIS GALLI, G., SILVA, V.T. and LIMA, C.P.P. A bloom of Cyanobacteria (Cylindrospermopsis raciborskii) in UHE Carlos Botelho (Lobo/Broa) reservoir: a consequence of global change? Brazilian Journal of Biology = Revista Brasileira de Biologia, 2015, 75(2), 507-508. http://dx.doi.org/10.1590/1519-6984.24914. PMid:26132043.
VALDERRAMA, J.C. The simultaneous analysis of total nitrogen and total phosphorous in natural waters.
Marine Chemistry, 1981, 10(2), 109-122. http:// dx.doi.org/10.1016/0304-4203(81)90027-X. YUAN, Y., JIANG, M., LIU, X., YU, H., OTTE,
M.L., MA, C. and HER, Y.G. Environmental variables influencing phytoplankton communities in
hydrologically connected aquatic habitats in the Lake Xingkai basin. Ecological Indicators, 2018, 91, 1-12. http://dx.doi.org/10.1016/j.ecolind.2018.03.085.