FEDERAL UNIVERSITY OF PARÁ INSTITUTE OF TECHNOLOGY
POST GRADUATE PROGRAM IN ELECTRICAL ENGINEERING
FABRÍCIO DE SOUZA FARIAS
DESIGNING COST-EFFICIENT TRANSPORT
SOLUTIONS FOR FIXED AND MOBILE BROADBAND
ACCESS NETWORK
TD - 07/2016
UFPA / ITEC / PPGEE Campus Universitário do Guamá
FEDERAL UNIVERSITY OF PARÁ INSTITUTE OF TECHNOLOGY
POST GRADUATE PROGRAM IN ELECTRICAL ENGINEERING
FABRÍCIO DE SOUZA FARIAS
DESIGNING COST-EFFICIENT TRANSPORT
SOLUTIONS FOR FIXED AND MOBILE BROADBAND
ACCESS NETWORK
Doctoral Thesis submitted to the examining committee of the Post Graduate Program in Electrical Engineering from Federal University of Pará as a requirement to obtain the title of Doctor in Electrical Engineering.
UFPA / ITEC / PPGEE Campus Universitário do Guamá
Dados Internacionais de Catalogação-na-Publicação (CIP) Sistema de Bibliotecas da UFPA
____________________________________________________________________
Farias, Fabricio de Souza, 1988-
Designing cost-efficient transport solutions for fixed and mobile broadband access network / Fabricio de Souza Farias. - 2016.
Orientador: João Crisóstomo Weyl Albuquerque Costa.
Tese (Doutorado) - Universidade Federal do Pará, Instituto de Tecnologia, Programa de Pós-Graduação em Engenharia Elétrica, Belém, 2016.
1. Sistemas de comunicação em banda larga. 2. Telecomunicações - tráfego. I. Título.
CDD 23. ed. 621.38216
FEDERAL UNIVERSITY OF PARÁ INSTITUTE OF TECHNOLOGY
POST GRADUATE PROGRAM IN ELECTRICAL ENGINEERING
DESIGNING COST-EFFICIENT TRANSPORT
SOLUTIONS FOR FIXED AND MOBILE BROADBAND
ACCESS NETWORK
AUTHOR: FABRICIO DE SOUZA FARIAS.
DOCTORAL THESIS SUBMITTED TO THE EXAMINING COMMITTEE OF THE POST GRADUATE PROGRAM IN ELECTRICAL ENGINEERING FROM FEDERAL UNIVERSITY OF PARÁ AS A REQUIREMENT TO OBTAIN THE TITLE OF DOCTOR IN ELECTRICAL ENGINEERING.
APPROVED ON 03 / 03 / 2016
THESIS EXAMINING COMMITTEE:
______________________________________________________________________ Prof. Dr. João Crisóstomo Weyl Albuquerque Costa (SUPERVISOR – PPGEE/UFPA)
______________________________________________________________________ Prof. Dr. Paolo Monti (MEMBER - KTH/SWEDEN)
______________________________________________________________________ Prof. Dr. Nandamudi Lankalapalli Vijaykumar (MEMBER - INPE/SP)
______________________________________________________________________ Prof. Dr. Divanilson Rodrigo de Sousa Campelo (MEMBER - UFPE/PE)
______________________________________________________________________ Prof. Dr. Aldebaro Barreto da Rocha Klautau Júnior (MEMBER - PPGEE/UFPA)
______________________________________________________________________ Prof. Dr. Carlos Renato Lisboa Francês ( MEMBER - PPGEE/UFPA)
SIGNATURE:
__________________________________________________________________________ Prof. Dr. Evaldo Gonçalves Pelaes (HEAD OF THE DEPARTMENT - PPGEE/ITEC/UFPA)
ACKNOWLEDGEMENTS
viii
SUMMARY
CHAPTER I ... 26
INTRODUCTION ... 26
1.2.1 Main Research and Projects on Mobile Backhaul ... 26
1.2.2 Main Research Studies and Projects on Protection Schemes for Passive Optical Networks ... 30
1.3 PROPOSALS ... 33
1.3.1 Assessment of backhaul deployment based on Greenfield and Brownfield scenarios ... 33
1.3.2 Assessment of protection schemes for Passive optical networks ... 34
CHAPTER II ... 35
MEDIUM ACCESS TECHNOLOGIES ... 35
2.1 INTRODUCTION ... 35
2.2BASESTATIONS... 35
2.3FIBER ... 36
2.4MICROWAVE ... 38
2.5COPPER ... 40
2.6CONCLUSION ... 43
CHAPTER III ... 44
ASSESSMENT OF THE TOTAL COST OF OWNERSHIP FOR MOBILE BACKHAUL ... 44
3.1 INTRODUCTION ... 44
3.2 TRAFFICDEMAND ... 46
3.3 WIRELESSDEPLOYMENT ... 47
3.3.1 Macro + Femto Deployment ... 47
3.4BACKHAULDEPLOYMENTANDMIGRATION ... 48
3.4.1 Architecture 1: Microwave Backhaul ... 48
3.4.2 Architecture 2: Fiber-To-The-Node + Microwave Backhaul ... 50
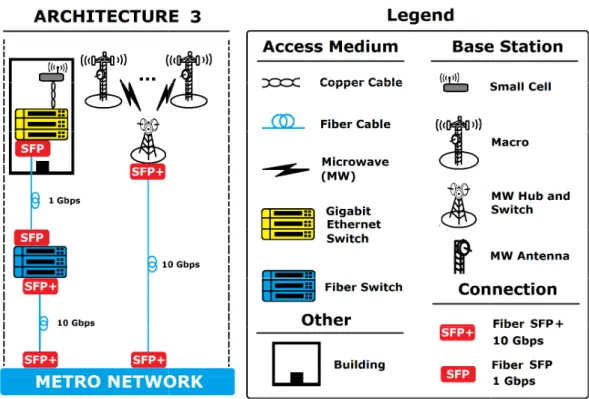
3.4.3 Architecture 3: Fiber-To-The-Building + Microwave Backhaul ... 51
3.4.4 Architecture 4: Fiber-To-The-Home + Microwave Backhaul ... 53
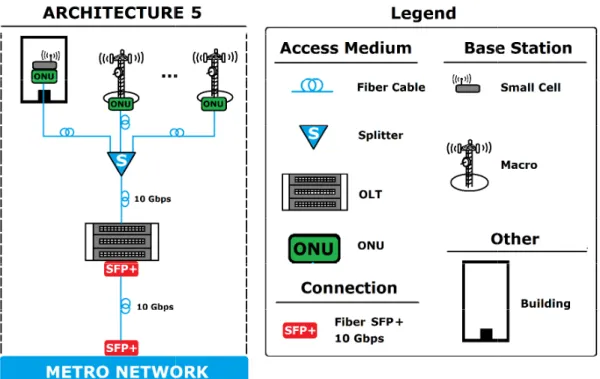
3.4.5 Architecture 5: Fiber-To-The-Home Backhaul ... 54
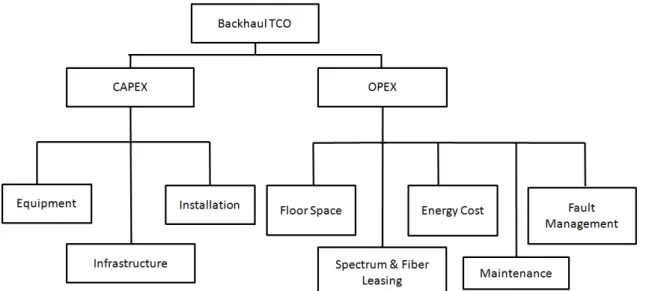
3.5TOTALCOSTOFOWNERSHIP ... 55
3.5.1 CAPEX: Equipment Costs ... 57
3.5.2 CAPEX: Infrastructure Costs ... 57
3.5.3 CAPEX: Installation Costs ... 62
3.5.4 OPEX: Energy Costs ... 62
3.5.5 OPEX: Spectrum and fiber leasing ... 62
3.5.6 OPEX: Maintenance Costs ... 63
3.5.7 OPEX: Fault Management ... 65
3.5.8 OPEX: Floor Space ... 66
3.6CASESTUDY ... 67
3.7RESULTS ... 70
3.7.1 An Analysis of the Greenfield Deployment ... 71
3.7.2 An Analysis of the Deployment ... 74
3.7.3 Sensitivity Analysis ... 76
3.8CONCLUSION ... 81
ix
ASSESSMENT OF PROTECTION SCHEMES FOR PASSIVE OPTICAL NETWORKS ... 83
4.1INTRODUCTION ... 83
4.2NETWORKDIMENSIONINGMODEL ... 84
4.3AFAILURE-ASSOCIATEDCOSTMODEL ... 88
4.4TOTALCOSTOFOWNERSHIP ... 91
4.4.1 CAPEX: Equipment Costs ... 91
4.4.2 CAPEX: Installation Costs ... 91
4.4.3 CAPEX: Infrastructure Costs ... 96
4.4.4 OPEX: Energy Costs ... 97
4.4.5 OPEX: Failure Costs ... 97
4.4.6 OPEX: Leasing Costs ... 97
4.7CASESTUDY ... 99
4.8RESULTS ... 101
4.8.1 Sensitivity Analysis ... 103
4.9CONCLUSION ... 107
CHAPTER V ... 109
CONCLUSION ... 109
x
LIST OF FIGURES
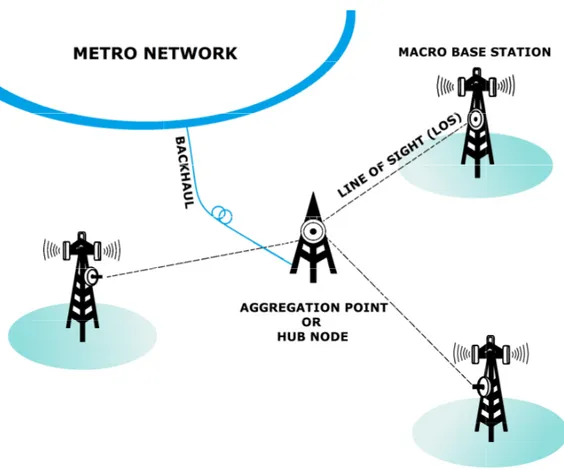
Figure 2.1: Possible HetNets deployment with relative backhaul in densely populated
urban areas. ... 36
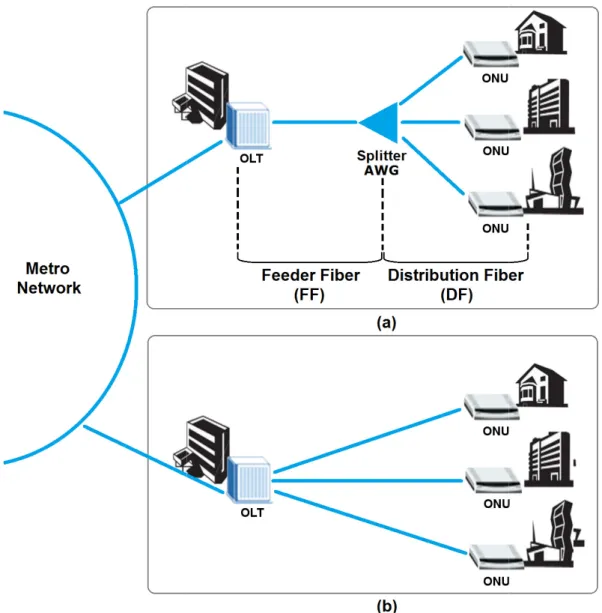
Figure 2.2: Fiber-to-the-home backhaul infrastructures. (a) Passive optical network. (b) Point-to-point fiber architecture. ... 38
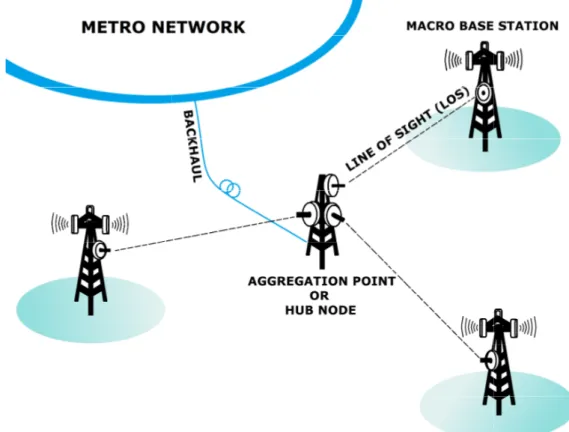
Figure 2.3: Point-to-point microwave backhaul communication. ... 39
Figure 2.4: Point-to-multipoint microwave backhaul communication. ... 40
Figure 2.5: Copper-based backhaul communication. ... 41
Figure 2.6: Beyond VDSL2: G.fast delivers fiber speeds over short copper loops …..42
Figure 3.1: Assessment methodology ...………..45
Figure 3.2: Microwave to femto and macro base stations……….…….….48
Figure 3.3: Fiber-to-the-node for the femto and microwave to the macro………...…...51
Figure 3.4: Fiber-to-the-building for the femto and microwave to the macro………....53
Figure 3.5: Fiber-to-the-home for the femto and microwave to the macro……….54
Figure 3.6: Fiber-to-the-home for the femto and macro base stations…………..….…55
Figure 3.7: Backhaul techno-economic model………...56
Figure 3.8: Schematic overview of the logical structure and parameters to obtain the trenching and installation distances ………..……….58
Figure 3.9: Logical structure for the fiber connections………...60
Figure 3.10: Greenfield deployment - Energy consumption for period T equals to 15...71
Figure 3.11: Greenfield energy consumption and total cost of ownership. (a) Energy consumption per user per year. (b) TCO assuming trenching. (c) TCO assuming leasing dark fiber………..73
Figure 3.12: Brownfield upgrade - Energy consumption for period T equals to 15…...74
Figure 3.13: Brownfield migration. (a) Energy consumption per user per year. (b) TCO assuming an upgrade based on the annual cost of equipment that leads to an increased cost of 5%. (c) TCO assuming that cost of equipment increases by 2.5%...75
Figure 3.14: Sensitivity analysis of variations in the trenching cost in a range of 70% to 130% of the market price...………...77
Figure 3.15: Sensitivity analysis of variations in the dark fiber cost within a range of 70% to 130% of the market price…..………..78
Figure 3.16: Sensitivity analysis of the antenna cost when it varies from 70% to 130% of the market price. (a) The impact when the operator trenches and owns the fiber infrastructure. (b) The impact when dark fiber is leased……….80
Figure 3.17: Sensitivity analysis of the MW spectrum cost when it varies from 70% to 130% of the market price...………..81
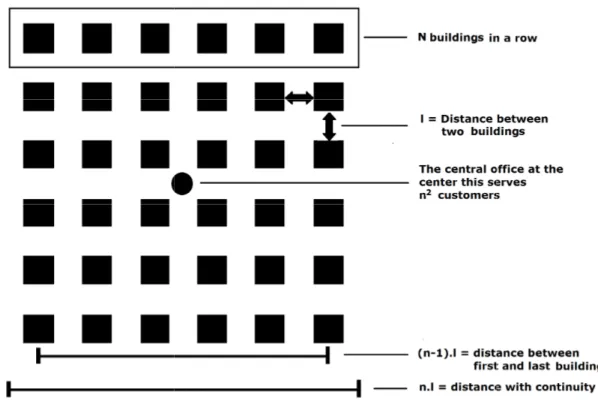
Figure 4.1: Schematic overview of the logical structure of a city with passive optical networks ………..85
Figure 4.2: Examples of a state diagram including three pieces of equipment (a) a Markov chain with equipment 1, 2 and 3. (b) a Markov chain where equipment 1 fails and is repaired before the next failure (c) a Markov chain where equipment 1 and 3 have failed………90
xi
xii
LIST OF TABLES
Table 2.1 - Base station types and characteristics ………..……....36
Table 3.1 - Inputs for power consumption and investment costs………69
Table 4.1 - Scenario parameters ……….………..100
xiii
ACRONYMS
ADSL2+ - Asymmetric Digital Subscriber Line AFR - Annualized Failure Rate
AP - Access Point
BM - Brownfield Migration CAPEX - Capital Expenditure
CDMA-IS95 - Code Division Multiple Access - Interim Standard 9 CO - Central Office
DF - Distribution Fiber DSL - Digital Subscriber Line
DSLAM - Digital Subscriber Line Access Multiplexer EARTH - Energy Aware Radio and Network Technologies FF - Feeder Fiber
FP7 - Seventh Framework Programme for Research and Development FS - Fiber Switch
FTTB - Fiber-To-The-Building FTTC - Fiber-To-The-Curb FTTH - Fiber-To-The-Home FTTN - Fiber-To-The-Node FFTX - Fiber-To-The-X GD - Greenfield Deployment GES - Gigabit Ethernet Switch
GSM - Global System for Mobile Communications HetNets - Heterogeneous Networks
ITU-T - International Telecommunications Union - Telecommunication Standardization Sector
LOS - Line of Sight
LTE - Long Term Evolution
METIS - Mobile and Wireless Communications Enablers for the Twenty-Twenty Information Society
MN - Metro Network
xiv MW - Microwave
NGOA - Next Generation Optical Access OLT - Optical Line Terminal
ONU - Optical Network Unit
OperaNet - Optimizing Power Efficiency in Mobile Radio Networks OPEX - Operational Expenditure
PC - Personal Computer PMP - Point-To-Multipoint PON - Passive Optical Network PTP - Point-To-Point
QoS - Quality of Service RAN - Radio Access Network RN - Remote Node
SFP - Small Form-Factor Pluggable SFP+ - Small Form-Factor Pluggable Plus SLA - Service Level Agreement
TCO - Total Cost of Ownership TDM - Time Division Multiplexing
UMTS - Universal Mobile Telecommunication System VDSL2 - Very-high bit rate DSL
WAN - Wide Area Network
WDM - Wavelength Division Multiplexing
xv
LIST OF SYMBOLS
- Impact Factor that Measures the Reputation Losses from the Telecommunication Operators
( ) - Average Daily Traffic Variation in Terms of Percentage of Active Users for a given Time t
- Parameter that Defines the Number of Business Clients - Minimum Capacity Provided to the End-User
- Population Density in the Area - Femto Penetration Rate
- Impact Factor that Controls the Price per Extra Gbps accordingly to the Extra Traffic Requested
– Area
- Standard Size for Cabinets - Area of a Microwave Hub
- Maintenance Cost of Cabinets
- Maintenance Cost of Central Offices
- Maximum Transmission Capacity of a Macro Base Station - Penalty Costs at State i
- Related Costs of Failed Equipment Repair at State i
! "→$% - Distance from a Building to the Remote Node
&'(→$% - Distance from a Distribution Fiber Step to the Remote Node ''(→)* - Distance from a Feeder Fiber Step to the Center of Scenario
+&'(→$% - Distance from a Protection Distribution Fiber Step to the Remote Node +''(→)* - Distance from a Protection Feeder Fiber Step to the Center of Scenario $%→)* - Distance from a Remote Node to the Center Office
, - Distance between Buildings ,!- - Distance between Buildings
.&'' – Distance to Distribute the Fiber Links to Connect the Edge-Equipment
.+/+' - Distance to Feed the Fiber Links to Connect the Splitters
,-- - Length of a Street Block
xvi
0) 1 - Fixed Cost to be Paid for Hardware Upgrade, and for Replacing Some Materials
in the Central Office
0) 1 - Cost to be Paid for Hardware Upgrade, and Replacing Some Materials in the
Cabinet
02 - Maintenance Cost of Microwave Links 3 - Number of Buildings or Houses in a Row 4 - Number of Remote Node in a Row
4 5 / - Number of Active Users that can be Served by a Macro BS
4 - Total Number of Apartments in the Area 47 /- - Number of Apartments per Floor
4 - - Number of Buildings with Femto Base Stations
4 ( - Number of Base Stations in the Area
48 - Number of Cabinets in Year j
4) - Number of Central Offices
3!- - Number of Buildings Connected in Each Local Exchange
4& - Number of Antenna Directions
4&(97 – Number of DSLAMs
3&(971 – Number of Ports per DSLAM
4$ :;< - Number of Equipment per Rack 4 < - Number of Equipment Types
4;< - Number of Pieces of Equipment of Type i
4=>?@ - Number of Pieces of Equipment located in the inside the Central-Office Racks 3-- - Number of Fiber Connections
4- 1 Number of Floors per Building
3' 1 – Number of Ports of a FS
41' – Number of FSs Aggregating Indoor Traffic
4' – Number of Uplink Connections Towards FS and MN
4A1- - Number of Business Subscribers Affected by Failure 4B1- - Number of Residential Subscribers Affected by Failures 41- ! - Number of Failed Subscriber in the Network
xvii 4-5" ;< - Average Number of Failure Equipment
4- - Number of Deployed Femto Base Stations
4- - Number of Fibers per Cable in the Location of Failure that needs to be spliced 3C;(1 - Total Number of Ports of the GES
4 - Total Number of Hubs 4 ! - Total Number of Nodes
48 ) - Number of Macro Cells with High Importance in Year j
4 - Total Number of Macro Base Stations
41 D- Total Number of Fiber Switches (FSs) Inside the Hubs
4 D
– Total Number of Uplink Connections between FS and MN
4 D - Yearly Man-Hours Required for the Maintenance of each Microwave
Antenna
4 D9 : - Number of Microwave Links Used for the Backhaul
4) - Man-Hours Required for the Maintenance of Each Central Office per Year 4) - Man-Hours per Cabinet
4 - Number of Mobile Operators in the Area 3*9/!1 - Number of OLT Cards
4*9/ - Number of OLTs in the Network
4-*%E ! - Expected Number of Failed ONUs during Analysis Time
4+ - Number of Ports to be Installed
4( :1 - Number of Local Exchanges
3( 1 - Number of Ports per Splitter
4 - Number of Technicians required to Repair a Failure F G - Power Consumption of Architecture 5
F H – Power Consumption of Architecture 4
F I - Power Consumption of Architecture 3
F J - Power Consumption of Architecture 2
F K - Power Consumption of Architecture 1
FL 1 - Business Penalty Rate Agreed in SLA F 1 / - Penalty Rate per hour
xviii F:;<- Power Consumption of the Equipment k
FL;< – Equipment Price
FL' M 9 1 - Cost to Lease one Km of Fiber
FL' - Price to Feed Fiber per Km
F1' - Power Consumption of a FS
FC;( - Power Consumption of a GES
F " O - Power Consumption of a Microwave Antenna in High Capacity Mode
F - Horizontal Position
FLC 1 - Price per Gbps Secured with the Operator
FLC 1 - Price per Extra Gbps
FL- 1 - Price to Install Fiber per Km
FL:- Price of the Failed Equipment
FL:D - kWh Price
FL) 19 1 7 < 1M - Cost Acquisition to Secure a Contract for the Next Years
FL : - Price of One Link to Communicate the Base Station with the Aggregation Node
F PO - Power Consumption of a Microwave Antenna in Low Capacity Mode
F1 D - Power Consumption of a Fiber Aggregation Switch
FL D9 : - Microwave Link Price
F ! - Power Consumption of a VDSL2 Modem
F*%E - Power Consumption of an ONU
F*9/ - Power Consumption of an OLT
Pr* / Q - Yearly Rental Fee Paid by an Operator for Outdoor Areas FL 1 - Residential Penalty Rates Agreed in SLA
F('+R - Power Consumption of a SFP+
F('+ - Power Consumption of a SFP
FL/ - Salary of a Technician per Hour
FL/ " - Price to Trench per Km
F5 - Vertical Position
Pr$ :S !/ - Yearly Rental Fee Paid by an Operator for Indoor Areas B( ) - Daily-Generated Traffic over a given Area
xix L: 5 - Hourly Average Data Rate of a Heavy User L: - Average Data Rate
L̅ - Average Data Rate Requirement per Active User U , - Crew Salary
UB - Splitting Ratio
V: - Fraction of the Subscribers Using Terminal Type k
U2 - Yearly Fee Paid for the Software Licenses - Time of Analysis in Hours
W S 1 ) 1) ;< - Cost for Installing Equipment of Copper W&- Desired Time Interval in Hours
W S 1 ) 1&'+ - Total Cost to Install Protection in the Distribution Fiber
W &'+ ) 1 - Total Cost to Trench the Protection in the Distribution Level
W /&' – Distance to Trench the Paths from the Splitters up to the ONUs
W ) 1;< - Equipment Cost
W S 1 ) 1;< - Total Cost for Installing Equipment W '1 ) 1 - Fiber Installation Cost
W ''+1 ) 1 - Cost to Install Protection in the Feeder Fiber
W ''+ ) 1 - Total Cost to Trench the Protection Fiber in the Feeder Fiber
W S 1 ) 1' - Total Cost to Feed and Distribute the Fiber Over the Area
W S 1 ) 1' ;< - Total Cost for Installing Equipment of Fiber W ' (1 - Floor Space Cost
W :D / - Yearly kWh Consumed by Equipment W ) 1 - Total Maintenance Cost
W S 1 ) 1D;< - Cost for Installing Equipment of Microwave W 9 1 ) 1+/+ - Total Leasing Cost of a PTP Infrastructure
W 9 1 ) 1+*% – Total Leasing Cost of a PON Infrastructure
W S - ) 1+/+9 1 - Total Cost for PTP Infrastructure
W S - ) 1+*%9 1 - Total Cost for PON Infrastructure
W S - ) 1/ - Total Cost for Trenching the path from the Central Office up to the
xx
W / -- ;X ! ! - Total Cost Associated with Failures that are over the Expected Average of Failures in the Network
W / -- $1 - Traffic Rent Cost
W ' / - Distance to be Trenched to Connect all Infrastructure
W ) 1- - Total Infrastructure Cost
W ) 1/ -- $ - Total Cost of Traffic Rented W ) 1/ -- ;X ! ! - Traffic Exceeded Cost
W ) 1( $ - Total Cost of Microwave Spectrum Leasing WYZℎ1 - Hourly Salary of Each in Year i
W D5 \ - Travelling Time to the Location of each Antenna WS 1 + - Total Time to Install an Equipment Port
W 1 - Time to Install
W ) 1; " – Total Energy Cost
WYZℎ - Number of Technicians per Team W1 - Time of Splicing per Fiber
WW- Troubleshooting Time
W 5 - Travelling Time to the Location of the Failure
]3 ^8 - Number And Connection Unavailability of Backhaul Link to the Macro Cell i.
_3 ^- - Fiber Unavailability per Kilometer
`*%E - Failure Rate of ONU ! 1\
5 - Travel Time to the Equipment
xxi
List of Papers
List of papers included in the thesis:
I. M. Fiorani, S. Tombaz, F. Farias, L. Wosinska, P. Monti, "Joint Design of Radio and Transport for Green Residential Access Networks", IEEE Journal on Selected Areas in Communications (JSAC), Special Issue on Energy-Efficient Techniques for 5G Wireless Communication Systems, to appear, 2016.
II. Lopes, Albert Richard Moraes; Farias, Fabricio S.; Costa, João Crisostomo Weyl Albuquerque. Evaluation of the Energy Impact on Indoor Small Cells and Backhaul. International Journal of Future Computer and Communication, v. 4, p. 152-159, 2015.
III. Lopes, Albert Richard Moraes; Farias, Fabricio S.; Costa, João Crisostomo Weyl Albuquerque. An Energy Efficiency Assessment for Indoor Small Cells Using Copper-Based Backhaul. International Journal of Future Computer and Communication, v. 4, p. 170-174, 2015.
IV. Fernandes, A. L. P.; Farias, F. S.; Santos, I. M.; Costa, J. C. W. A. Economic Analysis on Passive Optical Networks Using Markov Chain and Monte Carlo Simulation. In: XXXIII Simpósio Brasileiro de Telecomunicações, 2015, Juiz de Fora. Anais do XXXIII Simpósio Brasileiro de Telecomunicações, 2015.
V. S. Tombaz, P. Monti, F. S. Farias, M. Fiorani, L. Wosinska, J. Zander, “Is Backhaul Becoming a Bottleneck for Green Wireless Access Networks?,” In
IEEE International Conference on Communications (ICC), Sydney, vol., no.,
pp.4029,4035, 10-14 June 2014.
VI. Farias, F.S.; Monti, P.; Vastberg, A.; Nilson, M.; Costa, J.C.W.A.; Wosinska, L., "Green backhauling for heterogeneous mobile access networks: What are the challenges?," Information, Communications and Signal Processing (ICICS) 2013 9th International Conference on , vol., no., pp.1,5, 10-13 Dec. 2013.
List of related papers not included in the thesis:
I. Mate, D. M.; F. S. Farias.; Costa, J. C. W. A. Estudo da Interferência do Sistema PLC no DSL. In: XXXIII Simpósio Brasileiro de Telecomunicações, 2015, Juiz de Fora. Anais do XXXIII Simpósio Brasileiro de Telecomunicações, 2015.
II. Mate, D. M.; F. S. Farias.; J. C. W. A. Costa. Digital Television Interference on the LTE System in the 700 MHz Band. In: XXXIII Simpósio Brasileiro de Telecomunicações, 2015, Juiz de Fora. Anais do XXXIII Simpósio Brasileiro de Telecomunicações, 2015.
xxii
Adjacent Channels in the 700 MHz Band,” Journal of Information Technology & Computer Science (IJITCS), v. 13, p. 42-50, 2014.
IV. Dércio M. Mathe; Lilian C. Freitas; F. S. Farias.; J. C. W. A. Costa. “Performance Analysis of LTE under Interference of Digital Television in Adjacent Channel,” In: The 2nd Radio and Antenna Days of the Indian Ocean (RADIO), 2014, Mauritius. Radio and Antenna Days of the Indian Ocean RADIO 2014, 2014.
V. Farias, F. S.; Borges, G. S.; Monteiro, W. B.; Silva, D. L. L.; Costa, J. C. W. A.“Noise estimation in DSL systems using linear regression, ” In: 2013 International Conference on Advanced Technologies for Communications (ATC 2013), 2013, Ho Chi Minh. 2013 International Conference on Advanced Technologies for Communications (ATC 2013), 2013. p. 291.
VI. F. S. Farias, G. S. Borges, R. M. Rodrigues, A. L. Santana, J. C. W. A. Costa, "Real-time noise identification in DSL systems using computational intelligence algorithms," Advanced Technologies for Communications (ATC), 2013
xxiii
THESIS STRUCTURE
This thesis is divided in 5 chapters.
Chapter I introduces the main concepts about heterogeneous networks, transport schemes, i.e., mobile backhaul and protection schemes. Moreover, it constitutes of both related literature and hypothesis. This chapter uses information from Paper I, II, III, IV, V and VI.
Chapter II presents the main base station technologies available in market and the different options of access medium to transport next year’s traffic. This chapter used information from Paper VI.
Chapter III introduces the proposed assessment methodology, based on Greenfield or Brownfield backhaul deployment. In this chapter all math models are presented and described, e.g., traffic model, backhaul models, etc. Additionally, a case study and results are presented. In this chapter, it was used information from Paper I, V.
Chapter IV introduces the proposed passive optical network protection schemes. Furthermore, it demonstrates all the models developed to obtain the main resolutions. Finally, a case study and its results are presented. In this chapter, it was used information from Paper IV.
24
ABSTRACT
This thesis undertakes a techno-economic evaluation of transport solutions for fixed and mobile broadband access. In the case of future mobile access networks, it is proposed to make use of backhaul architectures using fiber and microwave applied to Greenfield deployments and a copper-legacy backhaul infrastructure based on Brownfield migration, i.e. finding a way of using a legacy infrastructure to its full capacity. At the same time, protection deployments based on fiber-wireless schemes are recommended for future fixed broadband. The main contribution made by this thesis is to carry out a research investigation into the total investment cost of the broadband transport infrastructure. This will be determined by employing two sets of models to assess the capital and operational expenditures, (CAPEX and OPEX respectively), of mobile and fixed broadband access network operators. First, this involves a set of models for mobile broadband that are summarized in a general methodology that aims at providing: traffic forecasting, wireless deployment, mobile backhaul deployment and total cost assessment. It was found that, fiber-based backhaul through a Greenfield deployment is the most energy-efficient option. Furthermore, Brownfield reveals that copper-based backhaul can still play a key role if used up to its full capacity and sharply reduces the investment costs in infrastructure. Additionally, there is an examination of the main differences in cost and energy values between Greenfield and Brownfield. Finally, a methodology is employed for fixed broadband based on network dimensioning, failure costs and an assessment of the total cost of ownership. The models are used to assess five architectures that represent different protection schemes for fixed broadband. This research shows the economic benefits of using a hybrid protection scheme based on fiber-wireless architecture rather than fiber-based protection options and a sensitivity analysis is conducted to show that the extra CAPEX invested to protect the infrastructure might be recovered through the OPEX after a number of years. The results obtained in the thesis should be useful for network operators to plan both their fixed and mobile broadband access network infrastructure in the future.
25
RESUMO
Esta tese se concentra na avaliação técnico econômica de soluções de transporte para acesso banda larga fixa e móvel. Para futuras redes de acesso móvel, propõem-se arquiteturas de backhaul usando fibra e microondas baseado no desenvolvimento de redes de acesso wireless verde e infraestruturas legadas de backhaul baseada em cobre para migração Brownfield, ou seja, usando infraestrutura existente até o limite de
capacidade suportada, enquanto para redes de banda larga fixa são propostas implantações de proteção baseadas em esquemas híbridos, ou seja, fiber+wireless.
As principais contribuições desta tese estão relacionadas ao campo de pesquisa do custo total de investimento em infraestrutura de transporte banda larga. Em termos de custo total de investimento, são propostos dois conjuntos de modelos para avaliar as despesas de capital e de operação, CAPEX e OPEX respectivamente, de operadoras de redes de acesso banda larga fixa e móvel. Primeiramente, para banda larga móvel, é apresentado um conjunto de modelos condensado em uma metodologia geral que visa fornecer: previsão de tráfego, implantação de rede sem fio, implantação de backhaul móvel e avaliação do custo total. É mostrado que o backhaul baseado em fibra considerando acesso sem fio verde é a opção mais eficiente em termos de energia. Além disso, Brownfield mostra que o backhaul baseado em cobre ainda pode desempenhar um
grande papel se utilizado até a exaustão de sua capacidade e reduz drasticamente os custos de investimentos em infraestrutura. Adicionalmente, são apresentadas as principais diferenças de custos e valores de energia entre redes de acesso sem fio verde e Brownfield. Finalmente, para banda larga fixa, é proposta uma metodologia baseada
em dimensionamento de rede, custos associados à falha e avaliação do custo total por assinante. Os modelos são utilizados para avaliar cinco modelos que representam diferentes esquemas de proteção para arquiteturas de banda larga fixa. Esta pesquisa revela os benefícios econômicos do uso de esquema de proteção híbrido baseado em arquitetura fiber+wireless comparado com a opção de proteção baseada totalmente em fibra e é também apresentada uma análise de sensibilidade para provar que o investimento adicional em CAPEX para proteger a infraestrutura pode ser recuperado em alguns anos através da economia em OPEX.
Os resultados obtidos na tese podem ser úteis às operadoras de rede para planejar tanto suas infraestruturas de redes de acesso fixas quanto móveis.
26
CHAPTER I
INTRODUCTION
This chapter sets out the main research challenges that transport network operators, (i.e., mobile and fixed), are facing during the period of network dimensioning. Its objective is to demonstrate to the reader the importance of finding techno-economic solutions in the telecommunication field. Finally, two hypotheses that are raised and these are validated in the following chapters.
1.2.1 Main Research Projects on Mobile Backhaul
Recently, the popularization of new Internet devices such as modern laptops, tablets and smartphones has caused an unprecedented growth in the demand for data traffic [1][2][3]. Studies have shown that this data growth has a direct impact on network dimensioning, i.e., by sharply increasing the amount of equipment, (e.g., transport or radio equipment to meet the increasing demand) [4][5][6]. The introduction of extra equipment in the network access layer increases the need for investment. This, leads to a reduction in profits on the side of the operator [7] and forces operators to introduce protection schemes to guarantee reliable services anytime and anywhere.
The reduction in revenue has forced operators to find both energy and cost-efficient alternatives to handle the upcoming traffic demand, e.g., by investing in renewable energy [8], base stations with standby technology for discontinuity [9], and Heterogeneous Networks (HetNets) [10][11]. Among all the attempts to define the access layer through reducing energy consumption and Total Cost of Ownership (TCO), HetNets have proved to be the most attractive option [11][12].
HetNets use macro base stations, which guarantee full coverage of the area, and small cells, (e.g., micro-, pico- and femto base stations), to ensure a sufficiently high capacity to meet traffic demands. Moreover, HetNets are able to reduce the energy consumption of mobile access networks by replacing a number of energy-demanding macro cells with small cells [13][14].
27 HetNets, the energy consumption and operational costs of mobile backhaul have begun to represent a significant proportion of final bill [4]. Mobile backhaul is a term used to describe the connectivity between base stations and metro aggregation node in cellular systems in a wide range of transport media, (e.g., fiber and copper) [15] and the impact undergone by the backhaul is mainly caused by the "explosion" of the number of devices (switches, digital subscriber line access multiplexers, microwave antennas, etc.) that are required to connect all the macro base stations and small base stations through the access layer to the metro aggregation node.
The increasing amount of backhaul equipment raises new challenges/questions for the operators regarding profit margins and cost efficiency and how these problems must be solved. For example, the operators might decide either to deploy a new backhaul network (Greenfield) or upgrade an existing infrastructure (Brownfield) to transmit the traffic generated in the radio access networks. In the Greenfield scenario, the infrastructure is built from scratch and is usually chosen when the operator migrates from an incompatible technology or when a new contract is secured, thus forcing a general capacity upgrade [16]. On the other hand, Brownfield scenarios involve situations when the operator exploits the opportunities created by the legacy infrastructure, e.g., based on copper that is used to its full capacity and reuses the available infrastructure as much as possible to reduce the amount required for extra investment. The Brownfield solution raises the problem of defining at what point it is energy-efficient and profitable to make use of an old infrastructure.
To the best of our knowledge, most of the projects and papers related to HetNets and mobile backhaul subjects entail energy-efficient and Greenfield deployment [10][11][17][18][19][14][20][21]. In addition, there is no overall TCO methodology for evaluating different backhaul options in terms of costs and energy which employ both Greenfield and Brownfield strategies.
28 technologies and architectures may affect the total backhaul power consumption and then applying the knowledge to devise HetNet deployment strategies for the overall broadband segment; the aim of this is to reduce the total power consumed by the mobile wireless access and backhaul segments combined. Finally, there is the project involving Mobile and Wireless Communications Enablers for the Twenty-twenty Information Society (METIS) [23], an integrated scheme that was partly funded by the European Commission under the Seventh Framework Programme for Research and Development (FP7) framework [24]. METIS was set up by leading telecommunications companies in order to address the technical challenges arising from the avalanche of increasing traffic, upsurge of connected devices, and wide range of services and information requirements for the connected society beyond 2020. The “technology components” as well as the “horizontal topics” needed to build the next generation mobile system, (“5G”), which form the main bricks of METIS, are fully investigated in this project.
29 between energy efficiency and densification with regard to the network capacity requirements. The authors propose a framework that takes account of interference, noise and backhaul power consumption. The numerical results show that deploying smaller cells significantly reduces the transmitted power at the base station, and thus shifts the key elements of energy consumption to idle and backhauling power. Additionally, paper [25] analyses the possibility of exploiting the load balancing between the base stations to improve the backhaul capacity utilization. Load balancing is performed through cell selection algorithms that take into account both the radio interface and backhaul conditions. The obtained results show that the proposed algorithm can achieve a higher rate of backhaul resource utilization than the traditional cell selection schemes while providing the same radio interface performance. Finally, in [13] the impact of backhaul energy consumption on future green HetNets was investigated at different user-equipment traffic levels and with different backhaul technologies. The results confirm that the backhaul plays a significant role in the total HetNet power consumption, and more importantly, that its role becomes more prominent when there is an increase in traffic generated by the user-equipment.
30 mobile backhaul networks, including a detailed breakdown of CAPEX and OPEX.
To the best of our knowledge, only Greenfield backhaul deployment scenarios have been considered in the literature. Greenfield scenarios do not take into account the existing legacy infrastructure in the field. Currently, most households are still connected through copper cables, e.g., using Digital Subscriber Line (DSL) technology. DSL is the most popular last-mile fixed broadband technology and about 3/4 of the FTTX (Fiber-to-the-X = node/cabinet/building) solutions rely on DSL to connect to the end-users [30][31]. Legacy DSL solutions can be used when combined with other technologies for backhauling small cells, especially those situated indoors. This solution is referred as Brownfield. In the first part of this thesis, there is an examination of both Greenfield and Brownfield scenarios with the aim of providing a TCO assessment methodology that can help mobile operators to plan and deploy their backhaul infrastructures for HetNet, particularly with regard to the traffic levels and expected costs of current and future users.
1.2.2 Main Research Studies and Projects on Protection
Schemes for Passive Optical Networks
Among the traffic and transport technologies, fiber is the best suited to meeting future traffic demands. Additionally, Passive Optical Networks (PON) is the most viable solution for deployment in the last mile segment owing to its potential very high capacity and long reach [32][33]. PON technologies are able to meet and handle the high traffic demands expected today and in the near future [34]. As a result of this increase in traffic requirements, the operators will be dealing with new customers, (e.g., business/commercial), and this will be even more demanding and costly in terms of penalties. The new customer profile has driven operators to invest in reliable solutions, e.g., protection topologies for Feeder Fiber (FF) and Distribution Fiber (DF), which will strictly comply with the Service Level Agreement (SLA), as a means of reducing failures and undesired losses in revenue [6][35][36].
Protection schemes for transport networks are an important means of avoiding service failures and improving PON reliability and survivability. The following protection schemes are specified in [37][32][38]: (i) feeder fiber protection - this
31 Optical Line Terminal (OLT) and the passive optical splitter/combiner at the remote node, and is thus attached to the feeder fiber via optical switches; (ii) OLT and
feeder fiber protection - in this scheme, an additional OLT is used to provide both OLT and feeder fiber protection; (iii) full duplication - this approach protects all the Optical
Network Units (ONUs) as well as OLT and both the feeder and distribution fibers. In the literature, the paper [39] proposed a 1:1 protection scheme designed to ensure there was a backup path between the distribution fibers of a Wavelength Division Multiplexing (WDM) PON. In this architecture, ONUs are equipped with optical switches and filters. Additionally, a bidirectional connection between each pair of ONUs is provided by using additional optical fiber links. In [40], the survivability of a WDM PON was investigated and a new survivable architecture was proposed and then experimentally examined. In the proposed optical 1:1 protected WDM PON, automatic protection switching with in-service fault location was performed by the ONUs. A 1:W shared protection scheme (using W working and 1 protecting resources) was put forward and investigated. The proposed architecture provides self-protection and automatic traffic restoration capability for the distribution of cut fiber. Although the above mentioned protection techniques provide protection for OLT and/or ONUs as well as feeder and/or distribution fibers, using full optical protection methods is cost-prohibitive for cost-sensitive access networks. In this context, paper [41] carries out a comprehensive assessment of CAPEX and OPEX to evaluate a cost-efficient protection for Time Division Multiplexing (TDM) PONs based on sharing FF ducts between OLT and Remote Node (RN) with backup fibers. The results confirm the benefits of the proposed method of providing protection, which leads to a significantly greater reduction of TCO, i.e., CAPEX and OPEX, than the unprotected case in all of the examined scenarios (rural, urban, and densely-populated urban). Paper [42] conducts a comprehensive cost analysis for fiber access networks including both CAPEX and OPEX. The results show that for business users the TCO in protection topologies may be lower than in some unprotected topologies.
32 rate) on the penalty cost: it should be noted that the fewer streets containing FF (i.e., the more concentrated the FF layout), the lower the penalty costs. Moreover, it was found that with regard to the proposed fiber layout, the increase in investment for offering protection is a low percentage of the TCO.
In contrast, papers [41], [42] and [43] based their analysis on static models and did not take account of dependencies between failures, i.e., the static models were not able to reflect the dynamism of the network because of the strong failure mode assumptions and the repairs that were necessary to allow them to be characterized.
Paper [6] assessed OPEX for PONs in terms of both expected repair costs and expected penalty costs using the Markov model with costs, which is based on a geometric model that describes the area of study. The results show that the expected penalty cost accounts for the main part of these OPEX, and sharply increases in sparse scenarios and when business clients are involved. However, in [44] the authors evaluated the CAPEX in different PON protection schemes by taking account of the design of the physical layout. The results show that protection at the feeder levels is almost mandatory to reduce the risk of large failures, while protection at the distribution level has little effect on them. In [36], the authors conducted a detailed cost analysis of PONs, that included CAPEX and the dependability-related OPEX. With regard to the failure-related OPEX, the cost of the repairs and penalty were taken into account. The results suggested that the most cost-efficient protection scheme for PONs should protect the feeder fibers as well as the OLT components.
Despite the fact that these papers mainly focused on protection schemes that only used optical fiber, there are studies that aim at providing full protection by means of hybrid fiber-wireless topologies in [45][46]. The authors in [47] and [46] proposed protection schemes for the hybrid Wireless-Optical Broadband-Access Network (WOBAN) which involved routing the signals through backup ONUs and wireless routers. The numerical results from [47] show that the proposed protection scheme is much more cost-effective than employing self-protecting PON architectures.
33 mobile backhauling. The novel architecture relies on a microwave connection which is used to protect the distribution and feeder levels. The results show that microwave backhaul can be used in protection schemes. Additionally, they demonstrate that fiber and microwave protection can provide better levels of reliability and availability than protections schemes that are entirely based on fiber. However, the study did not take into account how the usage of hybrid protection topologies affects the TCO. In the second part of this thesis, a Greenfield deployment with different protection schemes for PONs is set out with the objective of providing a TCO assessment that can help operators to plan and deploy their infrastructure for fixed broadband.
1.3 PROPOSALS
Given the challenges that transport network operators are facing to guarantee the level of data traffic that will be required by new applications and services in the future, and the attempts to address this problem found in the literature review discussed above, it is clear that the choice of a cost-efficient radio architecture is an important matter. In view of this, the hypotheses put forward in this thesis will be examined in the following subsections.
1.3.1 Assessment of backhaul deployment based on
Greenfield and Brownfield scenarios
34
1.3.2 Assessment of protection schemes for Passive optical
networks
35
CHAPTER II
MEDIUM ACCESS TECHNOLOGIES
2.1 INTRODUCTION
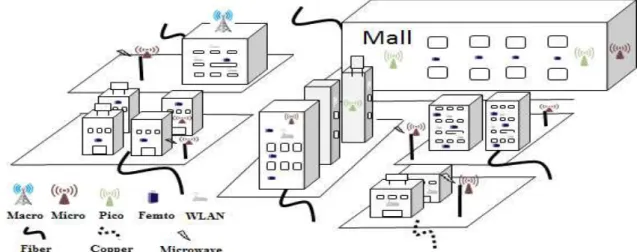
The objective of this chapter is to provide a description of the types of base station used in a HetNet deployment and also to outline the technological options available for transporting the fixed broadband and backhaul segments, (see Figure 2.1). To start with, there is a description of the various types of base station (i.e., macro, micro, pico, and femto) that usually form a part of a HetNet deployment. After this, the most popular access medium is described: Fiber, Microwave and Copper.
2.2 BASE STATIONS
Macro base stations (deployed outdoors, at over-rooftop level) are capable of
covering a vast area and supporting a very large number of users. Capital Expenditure (CAPEX) and Operational Expenditure (OPEX) are high due to their price, their site acquisition/rental costs, and their energy consumption levels. Macro base stations can provide 2G, 3G and 4G services. Legacy 2G (i.e., GSM, CDMA-IS95) sites are usually backhauled and use copper, while 3G (i.e., UMTS, CDMA-2000) and newly deployed 4G (i.e., LTE, WIMAX) base station sites use fiber and/or microwave for backhaul.
Micro base stations are also deployed outdoors, but at below-rooftop levels (e.g.,
lamp posts, or outside walls) to cover a specific area (e.g., to provide high traffic capacity in crowded streets and built-up areas). Their size, cost and effective radiated power levels are lower than those of macro base stations. They are usually backhauled via microwave [16][28].
Pico base stations have lower coverage than macro and micro and hence need a
lower transmission power. They are often deployed to remedy the coverage/capacity holes in a given area, i.e., they work as hot-spots to guarantee connectivity for special
events, such as concerts and parades, where several people are concentrated in the same area. When deployed indoors, pico base stations are usually backhauled through an
Fiber-to-the-36 Home/Curb combined with Ethernet), while pico base stations deployed outdoors are
mostly backhauled via microwave.
Figure 2.1: Possible HetNets deployment with relative backhaul in densely populated urban areas.
Table 2.1 - Base station types and characteristics.
Type Coverage Radiated Power [W]
Outdoors Indoors
Macro < 35Km 5-40 -
Micro < 2Km 0.5-2 -
Pico < 200m 0.25-2 0.1
Femto 10-15m - < 0.1
Femto base stations are the cheapest and most energy-efficient equipment.
However, they have the worst performance and coverage. Unlike the other base station types, Femto is not an industrial grade system, but it is made for end-user connection
and improving indoor traffic capacity. Their role is similar to pico base stations, i.e., to
provide extra capacity where needed, but their power consumption is lower due to their proximity to the user and their short coverage range (i.e., limited to a few tens of meters). They are usually backhauled by a fixed broadband infrastructure, which means mainly legacy copper and fiber, i.e. Digital Subscriber Line (DSL), Ethernet, Fiber-to-the-Building and Fiber-to-the-Home. Additionally, Table 2.1 summarizes the main characteristics of the different base stations.
2.3 FIBER
37 comes today at a relatively high deployment cost, i.e., CAPEX. However, a high investment in cost and time to deploy, backhaul based on fiber can support any unexpected increase in future capacity requirements, especially in dense urban areas. Regardless of the fact that fiber is an alternative, the time to either deploy or upgrade this technology can be too long, while the backhaul traffic is already a serious problem. For this reason, alternative kinds of backhaul technology, i.e. microwave and copper, also play key roles.
Figure 2.2: Fiber-to-the-ho
2.4 MICROWAV
Microwave is the m regions [51][52][53]. The m the short time and low CAP attractive in terms of short deployment [51]. On the ot pay for a very high OPEX d backhauling can be divided Point-To-Multipoint (PMP leasing costs [29].
ome backhaul infrastructures. (a) Passive optic Point-to-point fiber architecture.
AVE
e most widespread backhaul technology in u main reason for the success of microwave can APEX for deploying. Moreover, microwave-ba rt time-to-market, low investment in infrastruc other hand, this backhaul technology compels
due to high costs of energy and spectrum leas ed into two main categories: Microwave PTP
P), each of which incurs a different energy
38 tical network. (b)
The first is Microw
requires a dedicated link Network (RAN) site to metro/aggregation segment Line of Sight (LoS) connec
Figure 2.3: Poi
The Microwave Poi
one Access Point (AP) in t thus reducing the number and OPEX savings in term respectively.
rowave Point-To-Point (PTP), depicted in F
k (in the 2-30 GHz range) to connect each to a hub node that is sequentially con nt. If the RAN site is too far from the hub, o ectivity, the backhaul may include multiple hop
oint-to-point microwave backhaul communicat
oint-to-Multipoint (PMP) links, depicted in Fi
n the hub be connected simultaneously to mul r of required dedicated links. This provides o rms of radio equipment and fewer dedicated m
39 Figure 2.3. PTP
ch Radio Access onnected to the , or if there is no ops [29].
ation.
Figure 2.4:
Point-2.5 COPPER
Digital Subscriber L existing copper infrastruc infrastructure makes use of Digital Subscriber Line Acc to establish Internet conne illustrated in Fig. 2.5, which
Copper is the lega decades to provide fixed b Line 2 (ADSL2+) standard [56], Very-High-Bit-Rate D [57], etc.). Copper has also mobile services (i.e., 2G an
-to-multipoint microwave backhaul communic
r Lines (DSLs) might be still appealing in the ucture, bearing in mind their limited capa of fiber transmission links from the CO to the
ccess Multiplexers (DSLAM) are stored in the nection over twisted-pair copper cables with ich can be referred to as hybrid fiber-copper [55
gacy technology that has been most widely broadband connectivity (i.e., Asymmetric Di ard International Telecommunication Union ( Digital Subscriber Line 2 (VDSL2) standard lso been used to backhaul traffic in the early and 3G).
40 nication.
the presence of an pacity [54]. The he local exchange. the local exchange the end-user, as [55].
Figure 2.
It is known that cop there are approximately 1.3 remains an attractive opti especially in the short term, on fiber or microwave) are backhaul and to cater for lo The-Cabinet (FTTC) or Fib still benefit from making especially to backhaul sm aggregated bandwidth is n drawback which is its inabi Among the copper maximum capacity of 24Mb the band from 26.075 kHz while 138 kHz – 1104 kHz in use is the VDSL2, which extends the performance of
2.5: Copper-based backhaul communication.
opper is the most widespread broadband tech 1.3 billion copper phone lines all over the wo ption for a number of backhauling indoor m, while more capacity efficient backhaul solu are being deployed to both enhance the existin
longer term traffic requirements. For example iber-To-The-Building (FTTB) scenario, mobil g use of an already deployed copper-based mall base stations (i.e., Pico and Femto) tra not huge. On the other hand, this technolog bility to provide a high capacity over long dista er-based transport technologies, the ADSL2 Mbps for users [59][56]. Additionally, the ADS z to 137.825 kHz, and is used for upstream z is used for downstream communication. Ano ich is a DSL variant that provides hundred Mb of existing applications in Internet access, vid
41 chnology and that world [30]. It also r scenarios [58], lutions (i.e., based ting copper-based ple, in a Fiber-To-bile operators may sed infrastructure, traffic, where the ogy has a serious stances.
42 and provision of digital video [59]. VDSL2 is an extension of the existing ADSL technology, and generally operates within the frequency band of 25 kHz up to 30 MHz; however, the higher bit rates provision can only be carried out over shorter distances [57], in fact, it only has the capacity to perform with a good speed of up to 300 meters. Finally, G.fast access to subscriber terminals (G.fast) is a new standard from ITU-T that is aimed at providing up to 1 Gbps over short links, i.e., up to 100 meters (as illustrated in Figure 2.6), using a frequency range of up to 212MHz [60][61]. In other words, new G.fast technology is able to provide fiber-like speeds over the last mile and this reduce capital expenditure. Additionally, G.fast allows network operators to offer a high speed service with no need to enter and rewire homes, offices and buildings.
Figure 2.6: Beyond VDSL2: G.fast delivers fiber speeds over short copper loops [65].
The high capacity of G.fast cannot be maintained over long distances, so the best approach is to use a combination of two technologies, i.e., G.fast and VDSL2 vectoring when G.fast is out of range. G.fast is ideal for applications that bring fiber closer to the home and uses very short copper loops to cover the last few meters, e.g., distributed transport and antenna systems [62][63][64], while VDSL2 vectoring remains the best technology for longer distances, i.e., up to 400 meters [65].
43
2.6 CONCLUSION
44
CHAPTER III
ASSESSMENT OF THE TOTAL COST OF OWNERSHIP
FOR MOBILE BACKHAUL
3.1 INTRODUCTION
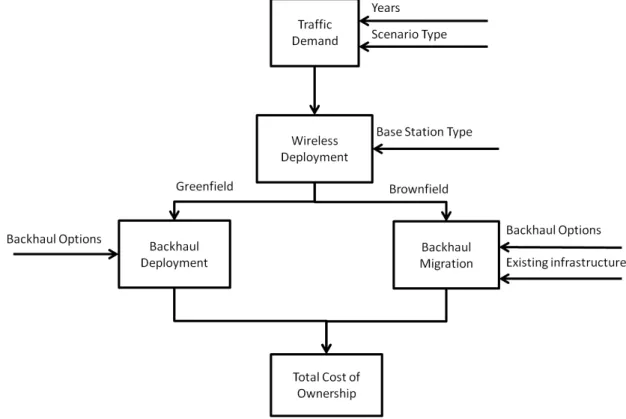
This chapter introduces a methodology for assessing the Total Cost of Ownership for mobile backhaul, which is divided into five phases. Figure 3.1 summarizes the phases. The proposed methodology is used to determine the most suitable backhaul and relies on two key factors: Greenfield, i.e., deployment of a new transport network infrastructure to serve mobile clients in a certain area, or Brownfield, i.e., legacy backhaul usage to transport network infrastructure up to its full capacity and also serve mobile end-users. In the Brownfield, the migration to a new transport network technology, e.g., fiber and microwave, is carried out by reusing the previous infrastructure, e.g., ducts and trench.
The demand estimation of traffic is used to compute the expected traffic requirements in the area for a given year. It uses as inputs, the expected data for network and service usage, such as population density, number of active mobile subscribers, user profile (e.g., heavy or ordinary), number of mobile operators in the area, variation in daily traffic volume and penetration rate of mobile terminals (e.g., tablets, smartphones and laptops). Following this, with the aid of a long-term traffic model, it estimates the average user demand and the traffic demand in an average area.
The wireless deployment phase is used to determine the number of base stations in the area. In this case, the number of buildings and apartments in the area are taken as input, together with the type and capacity of macro and small base stations, and the penetration rate of the small base station. Accordingly, it is possible to obtain the number of macro and small base stations required to cover the area and satisfy the average traffic requirements in a given year.
45 infrastructure can also be taken as input. The output of this phase is to calculate the number of devices (e.g., microwave antennas, fiber cables, and modems) that need to be installed.
Finally, in the last phase, i.e., the evaluation of the total cost of ownership, the overall TCO is calculated in accordance with the models examined in Section 3.5. The inputs of this phase are the backhaul design (e.g., deployment or migration), cost of equipment and available services (e.g., energy consumption, fiber trenching and spectrum leasing). The CAPEX and OPEX of the backhaul architectures are calculated on the basis of the inputs and a tailor-made TCO model.
It is should be noted that the methodology employed was validated during the research project called GreenHaul [22], which was a cooperative venture between wireless@KTH, TeliaSonera and Transmode.
In the following sections, there is a description of the math models adopted during the assessment methodology. First, there is a detailed account of the traffic estimation model; then, the proposed wireless and backhaul architectures; and finally, the TCO model.
46
3.2 TRAFFIC DEMAND
When predicting the traffic demand, i.e., traffic forecast for the next T years, the
first stage is to define the type of scenario among urban, suburban and rural sectors. In this case, a model is designed for the urban scenario. The main inputs are: area (in cdJ), population, number of mobile subscribers, user types, (i.e., defined as heavy or
ordinary), and the penetration rate of the different devices, e.g., tablets, smartphones and laptops. The following outputs can be obtained from this: population density, user demand, and traffic demand.
a) A Long-Term Large-Scale Traffic Model
This study involves, a densely-populated urban scenario and a referenced traffic model, (as shown in [66]), to estimate the area traffic demand. Since data volumes per subscriber do not depend on a specific deployment scenario, the daily-generated traffic B( ) over a given area can be defined by Eq. (3.1):
B( ) = 4 f L( ) :
:
V:, [0 iV/cdJ] (3.1)
where represents the population density in the area. ( ) represents the average daily traffic variation in terms of percentage of active users for a given time t. The term k
indicates the terminal type (i.e., laptop, tablet or smartphone). 4 represents the
number of mobile operators in the area. Finally, L: and V: represent the average data rate and the fraction of the subscribers using terminal type k, respectively. The daily
peak traffic is used to represent the broadband request.
As in [66], three different terminal types are included: Personal Computer (PC), tablet and smartphone. On average, it is assumed that a PC user will generate two and eight times more data traffic than a tablet and a smartphone user, respectively [66]. The users are divided into two groups (i.e., heavy and ordinary users) where the capacity requirements of an ordinary user are 1/8 of those of a heavy user [66]. Based on the assumption that h% of the subscribers are classified as heavy users, the average daily
rate of demand for data for terminal kcan be defined as Eq.(3.2).
L:= kℎL:
5 + (100 − ℎ)L
: ! p
47 where L: 5 [MB/hour] and L: ! [MB/hour] represent the hourly average data rate of a heavy and an ordinary user, respectively.
Using Eq. (3.1) in combination with the forecasted values of h, the fraction of
the subscribers using the three terminal types (i.e., V , V , V1. ), and the average data rate requirements for a heavy user L: 5 [1][66], it is possible to calculate the peak area traffic demand at the busy hour as t[Mbps/ km2] = d u (B( )), which corresponds to the case of ( ) = X [66].
3.3 WIRELESS DEPLOYMENT
On the basis of the traffic demand, it is possible to determine the most suitable wireless deployment for indoor and outdoor environments. Here, an attempt is made to define which type of base station is more suitable for each scenario and the required traffic demand. There are alternative base stations (i.e., macro, micro, pico and femto) that are usually a part of the HetNet deployment. In this thesis, a deployment scenario is designed with outdoor macro and indoor femto base stations.
3.3.1 Macro + Femto Deployment
In the case of wireless network dimensioning, it is assumed that the mobile operator deploys the macro base stations on the rooftops. In contrast, the femto base stations are randomly deployed by the end-users in their apartments. The number of deployed femto base stations (4- ) is given as a function of the femto penetration rate ( ) and the total number of apartments (4 ) in the area: 4- = 4 . It is assumed that the apartments are uniformly distributed in 4 buildings. Since the macro-cellular network must serve the remaining active users (i.e., those which are not served by the femto base stations), the required number of macro base stations can be computed by Eq. (3.3):
4 = Α (1 − ) 4 X
5 / (3.3)
where A is given in [cdJ] and represents the area under consideration Additionally,
4 5 / denotes the number of active users that can be served by a macro base
where and L̅ repre station and the average data
3.4 BACKHAUL
In this Section, th dimensioning along with its
3.4.1 Architectu
The first backhaul a star topology [11]. Am Microwave (MW) based efficiency and cost savings to setup, the MW technol provides high capacity in th
Figure 3.2: The outdoor macro
4 5 / = L̅
present the maximum transmission capacity o ata rate requirement per active user, respectivel
L DEPLOYMENT AND MIGRA
there is a detailed account of the backha its power consumption models, which will late
cture 1: Microwave Backhaul
l architecture is shown in Fig. 3.2, and is base mong different Microwave-based backhau d on Point-To-Point (PTP) highlights in te gs [29]. Moreover, due to the low time to deplo
ology became the main outdoor backhaul a the order of Gbps for macro, micro and Picoce
Microwave to femto and macro base stations cro base stations backhauled by MW are
48 (3.4)
of a macro base ely.
ATION
haul architecture ter be evaluated.
sed on microwave aul architectures, terms of energy loy and low effort l architecture that
cells [28].
ns.
49 microwave antennas, which are directly connected to a hub using a dedicated microwave link. At the same time, the femto base stations inside a building are connected to a Gigabit Ethernet Switch (GES) using copper cables (e.g., CAT 5/6/7). The GES aggregates the traffic from the femto base stations inside a building and provides connectivity to a microwave antenna placed on the rooftop. The antenna is in turn connected to a hub using a dedicated microwave link. The microwave links can operate, for instance, in a range of between 5 and 80 GHz, which is most suited to dense urban areas [3]. The hubs are equipped with switches that are responsible for aggregating the traffic from the microwave antennas and connecting them to the Metro Network (MN). The transmission within the MN occurs though optical point-to-point links and Small Form-Factor Pluggable Plus (SFP+) transceivers which are used for transmitting and receiving the optical signal. The power consumption of the architecture, i.e., F K, can be expressed as:
F K = w4 -+ 4 xF PO + 4 -FC;(+ 4 F " O
+ 24 DF
('+R+ 41 DF1 D
(3.5)
where 4 -, 4 , 4 , 41 Dand 4 D are the number of buildings with femto base stations, macro base stations, hubs, total number of Fiber Switches (FSs) inside the hubs and total number of uplink connections between FS and MN, respectively. On the other hand, F PO and F " O represent the power consumption of a microwave antenna in low and high capacity mode, respectively (according to the power model described in [11]). Finally, FC;(, F('+R, F1 D show the power consumption of a GES, SFP+ and fiber aggregation switch, respectively. It can be observed that 4 is a function of the maximum number of links supported by a hub (3 D :X ), i.e., 4 = a%z{R%|}~•@
|}€
•‚ƒ\„… b. Finally, 4 D depends on the total aggregate traffic collected at the FSs, i.e., †† , and the maximum transmission rate per uplink interface (0 u/ 1/9 :). 4 D can be computed as follows: 4 D= d u ‡ˆ4
50
3.4.2 Architecture 2: Fiber-To-The-Node + Microwave
Backhaul
The Fiber-To-The-Node (FTTN) architecture provides the end-user with high capacity through existing copper pairs. Depending on the copper technology in use, it can theoretically achieve a maximum capacity of 1Gbps up to 100 meters, 100Mbps up to 300 meters or 24Mbps up to 1 kilometer using G.fast, VDSL2 or ADSL2+, respectively [65][67][68]. In FTTN, data is backhauled to the metro aggregation through a hybrid topology, where dedicated fiber is provided from a fiber switch located at the CO to a DSLAM in a local exchange, (usually a cabinet placed on the street corner, close to the end-users). Copper-based technologies are used from the DSLAM to the user-modem.
The FTTN+Microwave, is shown in Fig. 3.3, and includes a hybrid architecture that employs both fiber and copper for indoor femto cells and microwave for outdoor macro base stations. Here, the femto base stations are backhauled by means of VDSL2 links, which have a frequency range of up to 30 MHz and provide a maximum downlink capacity over copper cables of 100Mbps up to 300 meters. Each femto base station is connected to a VDSL2 modem that is in turn connected to a DSLAM using a high speed connection through copper. The DSLAM is located at a remote node usually placed inside a street cabinet close to the user’s premises. The DSLAMs are connected to a number of FSs using point-to-point optical links. Small Form-Factor Pluggable (SFP) transceivers are used for transmitting and receiving the optical signal from the DSLAM to the FS. In contrast, the macro base stations are connected to the FSs using microwave links (already described for Architecture 1). The FSs aggregate the traffic coming from the wireless network before sending it towards the MN via optical links and SFP+ modules. The power consumption of the second architecture, i.e., F J, is obtained through the following formula:
F J = 4- F ! + (F&(97 + 2F('+)4&(97
+ 41'F
1'+ 4 F PO + 4 F " O + 41 DF1 D
+ 2F('+R(4'+4 D)
(3.6)
![Figure 2.6: Beyond VDSL2: G.fast delivers fiber speeds over short copper loops [65].](https://thumb-eu.123doks.com/thumbv2/123dok_br/16251836.714579/41.892.237.670.432.770/figure-vdsl-delivers-fiber-speeds-short-copper-loops.webp)