Correlation between transverse and vertical
measurements in Brazilian growing patients,
evaluated by Ricketts-Faltin frontal analysis
Regina Helena Lourenço Belluzzo1, Kurt Faltin Jr2, Cristina Ortolani2, Adolpho Chelotti3
How to cite this article: Belluzzo RHL, Faltin Jr K, Ortolani C, Chelotti A. Correlation between transverse and vertical measurements in Brazilian growing patients, evaluated by Ricketts-Faltin frontal analysis. Dental Press J Orthod. 2013 Jan-Feb;18(1):50-4.
» The authors report no commercial, proprietary or inancial interest in the prod-ucts or companies described in this article.
Regina Helena Lourenço Belluzzo E-mail: [email protected]
Introduction: Currently in orthodontic diagnosis, besides the lateral cephalometric analysis which evaluates the antero-posterior and vertical direction, the frontal analysis may be added, leading us to another important dimension in space: the transverse dimension. Objective: Few longitudinal samples with the frontal radiograph were published, so this cephalomet-ric study was designed to correlate the transversal and vertical measures by Ricketts-Faltin frontal analysis into two radio-graphic times. Methods: The sample consisted of 45 Brazilian children, 25 girls and 20 boys, all presenting mixed dentition, with balanced facial aesthetics and no previous orthodontic/orthopedic treatment. The initial average age (T1) was 7.7 years and the inal (T2) 13.3 years. The measurements evaluated were: FTD, MxTD, NTD, LITD, MdTD (transversal), OVD and TVD (vertical). Results: All transversal measures were positively correlated with a medium or high correlation with each other and the vertical measurements; only LITD presented a low correlation with these measurements. Conclusion:
It was concluded that the face has interdependent regions and that this feature remains with growth.
Keywords: Frontal teleradiograph. Longitudinal study. Correlation.
1 Associate Professor, Department of Orthodontics and Facial Orthopedics,
UNIP.
2 Full Professor, Department of Orthodontics and Facial Orthopedics, UNIP. 3 Private Practice.
Submitted:April24, 2009 - Revised and accepted: June 20, 2011
Introdução:atualmente no diagnóstico ortodôntico, além da análise cefalométrica lateral — que avalia os sentidos anteroposterior e vertical —, deve-se acrescentar a análise no sentido frontal, a qual propicia outra dimensão impor-tante no espaço, a transversal. Objetivo: poucas são as amostras longitudinais publicadas utilizando telerradiograias frontais; portanto, o presente estudo cefalométrico teve o intuito de correlacionar as medidas transversais e verticais por meio da análise frontal de Ricketts-Faltin, em dois tempos radiográicos. Métodos: a amostra constou de 45 crianças brasileiras, sendo 25 meninas e 20 meninos, todos apresentando dentição mista, com peril harmonioso e sem nunca terem sido tratadas ortodonticamente e/ou ortopedicamente. A idade média inicial (T1) foi de 7,7 anos e a inal (T2) de 13,3 anos. As medidas avaliadas foram: DTF, DTMx, DTN, DTII e DTMd (transversais); DVO e DVT (verticais). Resultados: todas as medidas transversais estavam correlacionadas positivamente, em grau médio ou forte, entre si e com as medidas verticais; somente DTII estava correlacionada em grau fraco com essas medidas. Conclusão:
concluiu-se que a face possui regiões interdependentes, e assim mantém-se mesmo com o crescimento.
INTRODUCTION
The study of human skulls took place since ancient times through craniometric measurements carried out on dried skulls. With the discovery of the X-rays in 1895 and its regulations in 1931, it became possible to evalu-ate growth changes and development of the same patient along the years with or without orthodontic treatment.3,8
From this moment onwards, interest on lateral ceph-alometric diagnosis started to expand. On the other hand, PA cephalometric radiographs remained stagnant over the years and currently there is still a great reluc-tance regarding its use. This lack of interest added to the diiculty to satisfactorily position the head on the cephalostat resulted in the small progress of the PA analysis.4,6,15,17,19,20,25 However, the need to use frontal cephalometry for a complete orthodontic diagnosis was reinforced with the development of orthodontic tech-niques such as palatal expansion, facial orthopedics, mandibular posture, changes in the transverse dimen-sion through the use of braces and even with regards to the relationship between respiration and growth.9,14,21,24
Patients are three-dimensional and not two-di-mensional, therefore it is no longer acceptable that orthodontic diagnosis is made solely by considering two dimensions of space: The anteroposterior and lat-eral planes obtained in latlat-eral teleradiographs.11,13,18 The great importance of expanding the vision in more than one plane of space for a complete diagnosis and orth-odontic treatment was published in the book that re-fers to orthodontic diagnosis, speciically in the section “Three-Dimensional Cephalometric Analysis” by Lan-glade, where PA analysis developed by Ricketts was de-scribed, reporting its implementation, clinical standards and their respective clinical deviations.12
It is essential to remember the importance of keep-ing the PA cephalometric radiograph analysis associated with the lateral analysis. This is to obtain a more accu-rate and complete diagnosis so to increase the vision of the transverse dimension of the face, maxilla and man-dible; tooth position in the lateral direction; evaluation of maxillary expansion, condylar position; functional deviations of the mandible, among many others.1,7,10,13,16
There are few longitudinal studies on posteroante-rior radiographs,2,22 so the aim of this study is to broaden the understanding of the PA radiograph by directing the diagnosis to another important dimension in space: The transverse dimension.
MATERIAL, METHODS AND STATISTICAL ANALYSIS
The selected sample for this study consisted of 45 Brazilian children from São Paulo city, 25 fe-male and 20 fe-males attending the Children’s Clinic of Paulista University, UNIP. All children initially presented in the mixed dentition, harmonic profile, satisfactory occlusion without any tooth loss and/or extensive restorations in the posterior teeth, and no previous orthodontic or orthopedic treatment. At the time when the first radiographs were taken pa-tients had a mean age of 7 years and 7 months (T1), at the second, 13 years and 3 months (T2), with a mean interval of 5 years and 8 months between the two radiographs.
All PA radiographs were taken using the same X-ray equipment. The tracings were made on a light box in a dark room, on a specific 0.003-in tracing paper and were measured twice by the same examiner, within an interval of at least 1 week to eliminate measurement inaccuracies. The cepha-lometric PA analysis used was the one proposed by Ricketts19 and Faltin.11
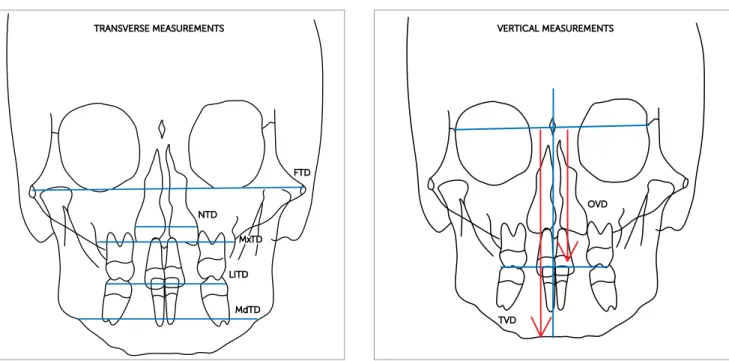
The analyzed transverse Ricketts measurements19 were: FTD (Facial Transverse Dimension), NTD (Nasal Transverse Dimension), MxTD (Maxil-lary Transverse Dimension), MdTD (Mandibular Transverse Dimension) and LITD (Lower Intermo-lar Transverse Dimension) (Fig 1).
The Faltin11 vertical measures were: OVD (Oc-clusal Vertical Dimension) and TVD (Total Vertical Dimension) (Fig 2).
The objective of this study was to determine the correlations of these seven orthodontic measure-ments carried out in two different times (T1 and T2) and also to consider whether or not they were main-tained with growth (T1 x T2).
RESULTS
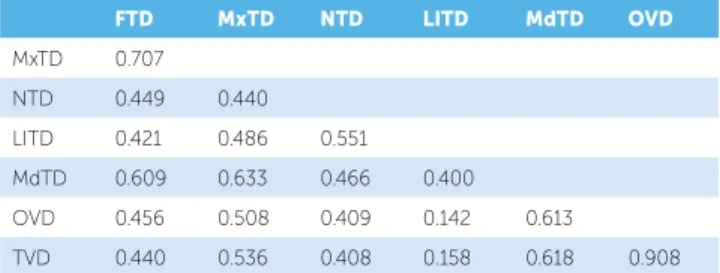
The Pearson’s correlation coeicients are shown in Tables 1 and 2, and Table 1 shows the Person’s lin-ear Correlation indices for the T1 measurements and Table 2 the indices for T2. Analysis of both tables shows that positive values can be observed, indicating positive correlations, i.e., when the value of a measurement in-creases, the other also increases. It was also noted that many values are near zero, indicating no linear correla-tion between the measurements.
To evaluate the correlations between the variables at T1 and T2 the following correlation degrees are consid-ered (absolute values for the correlations):
• Strong correlations: Index over 0.8;
• Average correlations: Index between 0.5 and
0.799;
• Weak correlations: Index between 0.3 and 0.499; • Very weak correlations: Index under 0.299;
To better illustrate these correlations, Figure 3 was developed with a two by two scatter plot between variables, for T1 and T2, where the behavior of the measurements can be observed, for example, it shows that OVD and TVD have good positive correlation in both times (the points describe an ascending straight line), as well as with OVD and MdTD, although in this case the data are slightly more scattered.
To verify whether the correlation coeicients would change between the two times, tests were carried out to compare the linear correlation coeicients between Time 1 and 2, which results are shown in Table 3.
DISCUSSION
The first studies using frontal and lateral cepha-lometric radiographs were only possible in 1931, af-ter the simultaneous publication in Germany and the U.S.A., time when the cephalometric radiography was standardized.3,8
Figure 1 - Transverse measurements proposed by Ricketts.
Figure 3 - Scatter plot between measurements for T1 (blue) and for T2 (red).
T1 FTD
MxTD
NTD
LITD
MdTD
OVD
TVD
T1
Figure 2 -Vertical measurements proposed by Faltin.
FTD
TRANSVERSE MEASUREMENTS VERTICAL MEASUREMENTS
OVD
TVD NTD
LITD
Table 1 - Pearson’s Linear Correlation for the measurements at T1.
Table 3 - Correlation indexes, which were altered signiicantly between the
two times.
Table 2 - Pearson’s Linear Correlation for the measurements at T2.
FTD MxTD NTD LITD MdTD OVD
MxTD 0.640
NTD 0.429 0.494
LITD 0.284 0.445 0.414
MdTD 0.703 0.684 0.495 0.320
OVD 0.470 0.387 0.320 0.180 0.434
TVD 0.427 0.407 0.374 0.349 0.512 0.786
FTD MxTD NTD LITD MdTD OVD
MxTD 0.707
NTD 0.449 0.440
LITD 0.421 0.486 0.551
MdTD 0.609 0.633 0.466 0.400
OVD 0.456 0.508 0.409 0.142 0.613
TVD 0.440 0.536 0.408 0.158 0.618 0.908
Time 1 Time 2 Correlation
TVD x OVD 0.786 0.908 Increased
Several cephalometric PA analysis were developed, but the most commonly used was the one proposed by Ricketts.19 Since this analysis was based on a sample of Caucasian North American patients, other authors had interest in verifying the applicability of the refer-ence values of the Ricketts’ PA analysis in other popu-lations, such as Chinese, Japanese, Brazilian and Aus-trian.5,14,20,21,23
However, when searching for longitudinal studies related to the PA radiograph, it appears that only few studies were carried out.2,22
In this study seven measures of cephalometric PA analysis proposed by Ricketts19 andFaltin11 in two ra-diographic times (T1 and T2) were correlated. It was also evaluated whether these correlations have changed during the follow-up period of this study, mean time 5 years and 8 months.
FTD is related to facial width in the lateral direc-tion, confirming that other measurements, which also represent the transverse direction were positively correlated at a significant level of 95% in an average degree. This was also positive for MxTD, MdTD, both in T1 and T2, except LITD where there was no significant correlation, probably because this was the only dental measurement. When FTD was correlat-ed with the vertical measurements, OVD and TVD, both were also positively correlated, at a significant level of 95%, but in a weaker degree.
MxTD is related to the width of maxillary bone, confirming that only MdTD had an average positive
correlation in T1 and T2. Vertically, OVD and TVD, were positively correlated, increasing from weak in T1 to average degree in T2. This shows that with growth the correlation among these measurements became stronger.
NTD is related to the nasal width and consequently to the patient’s respiratory capacity. The maxillary atre-sia is strongly correlated with the respiratory capacity of the upper airways, where the lack of airlow through the nose and thus the opening of the mouth and the lowering of the tongue reduce the stimulation of trans-verse maxillary growth. The diagnosis of the maxillary width is extremely important to establish a potential prognosis. A weak positive correlation in all transverse and vertical measurements was found. These correla-tions increased in T2, showing that in this sample this measurement has an independent characteristic, prob-ably because the patients presented with no transverse maxillary deiciency.
LITD is the only dental measurement in this study. The LITD analysis is very important as it gives the value of the width of the lower arch. This variable had a weak or very weak signiicant correlation with the variables studied. These relations were maintained with growth. This is probably due to their characteris-tic behavior during the development of the occlusion, as this measurement decreases during growth through the lingual inclination of the molars, which compen-sates in width the mandibular growth.
MxTD, and with the vertical OVD and TVD. These correlations remained in T2.
OVD represents the height of the average face in ver-tical direction, and as seen previously, this variable has a weak or medium positive correlation with all transverse and vertical studied measures, both in T1 and T2, except with LITD, which presented a very weak positive cor-relation. However, there was a strong correlation, the largest found in this study, with the variable TVD, in-creasing with growth.
TVD provides the total height of the face in the ver-tical direction. This variable has an average positive cor-relation with all transverse and vertical studied measure-ments presenting a strong positive correlation with the variable OVD, except with LITD, which proved to be weakly positive correlated.
This indicates that the transverse measurements of the face are interrelated and this interrelationship be-tween them is maintained or increases with growth. LITD is a dental measurement, which showed to be-have independently from bone measurements. OVD and TVD were measurements that had the highest cor-relation in this study, showing that the face, further than the transverse growth, has an important dimension to be considered, the vertical one.
CONCLUSION
In view of the obtained results from the studied sam-ple, we may conclude that the face retains interdepen-dent regions that correlate positively with each other, both transversely and vertically, and these relationships are maintained or strengthened with growth.
1. Araujo TM, Wilhelm RS, Almeida MA. Skeletal and dental arch assymmetries in Class II division 1 subdivision malocclusions. J Clin Pediatr Dent. 1994;18(3):181-5.
2. Athanasiou AE, Droschl H, Bosch C. Data and patterns of transverse dentofacial structure of 6- to 15-year-old children: A posteroanterior cephalometric study. Am J Orthod Dentofacial Orthop. 1992;101(5):465-71. 3. Broadbent BH. A new x-ray technique and its application to orthodontia.
Angle Orthod. 1931;1(2):45-66.
4. Broadbent BH. Bolton standards and technique in orthodontic practice. Angle Orthod. 1937;4(7):209-33.
5. Engel G, Spolter BM. Cephalometric and visual norms for a Japanese population. Am J Orthod. 1981;80(1):48-60.
6. Ghafari J, Cater PE, Shofer FS. Standardizing ilm distance on cephalometric measurements. Am J Orthod Dentofacial Orthop. 1995;108(1):30-7.
7. Grummons DC, Van de Coppello K. A frontal assymmetry analysis. J Clin Orthod. 1987;21(7):448-65.
8. Hofrath H. Die bedeutung der rontgenfern und abstrandsaufnahme fur die diagnostik der kieferanomalien. Fortschritte der
Orthodontik.1931;1:232-58.
9. Huertas D, Ghafari J. New posteroanterior cephalometric norms: A comparison with craniofacial measures of children treated with palatal expansion. Angle Orthod. 2001;71(4):285-92.
10. Janson GR, Metaxas A, Woodside DG, de Freitas MR, Pinzan A. Three-dimensional evaluation of skeletal and dental asymmetries in Class II subdivision malocclusions. Am J Orthod Dentofacial Orthop. 2001;119(4):406-18.
11. Faltin Jr K. Diagnóstico Ortodôntico - Aula: análise cefalométrica frontal de Ricketts-Faltin. Comunicação pessoal. Universidade Paulista, Instituto de Ciências e Saúde, Faculdade de Odontologia; 1999.
12. Langlade M. Diagnóstico ortodôntico. São Paulo: Ed. Santos; 1993. p. 193-204.
REFERENCES
13. Lundstr MA. Some assymmetries of the dental arches, jaws, and skull, and their etiological signiicance. Am J Orthod. 1961;47(2):81-106.
14. Michelon D. Estudo de grandezas cefalométricas em telerradiograias em norma frontal [tese]. Piracicaba (SP): Universidade Estadual de Campinas; 1999.
15. Mulick JF. Clinical use of the frontal headilm. Angle Orthod. 1965;35(4):299-304.
16. Peck S, Peck L, Kataja M. Skeletal assymmetry in esthetically pleasing faces. Angle Orthod. 1991;61(1):43-8.
17. Richardson ME. The reproducibility of measurements on depressed posteroanterior cephalometric radiographs. Angle Orthod. 1967;37(1):48-51. 18. Ricketts RM. Perspectives in the clinical application of cephalometrics - The
irst ifty years. Angle Orthod. 1981;51(2):115-50.
19. Ricketts RM. Orthodontic diagnosis and planning cephalometric systems. St. Louis: Rocky Mountain; 1982.
20. Sato K. Estudo cefalométrico radiográico de padrões crânio-faciais, em normas lateral e frontal, em adolescentes brasileiros, leucodermas, com oclusão dentária normal [tese]. São Paulo (SP): Universidade de São Paulo; 1982.
21. Silva JJ, Oliveira MG. Estudo cefalométrico computadorizado, em norma frontal, de dimensões lineares e angulares em indivíduos da raça negra. Rev Fac Odontol Porto Alegre. 1997;38(1):7-11.
22. Snodell SF, Nanda RS, Currier GF. A longitudinal cephalometric study of transverse and vertical craniofacial growth. Am J Orthod Dentofacial Orthop. 1993;104(5):471-83.
23. Vasconcellos FAF. Avaliação das assimetrias faciais em traçados cefalométricos obtidos por meio de telerradiograias em norma frontal de pacientes leucodermas brasileiros com oclusão normal [dissertação]. São Paulo (SP): Universidade de São Paulo; 2001.
24. Wei SHY. Craniofacial width dimensions. Angle Orthod. 1970;40(2):141-9. 25. Yoon YJ, Kim DH, Yu PS, Kim HJ, Choi EH, Kim KW. Efect of head rotation on