Evolution of TiO
2Nanotubular Morphology Obtained in Ethylene Glycol/Glycerol Mixture
and its Photoelectrochemical Performance
Alexander Berviana, Eliane Cosera,b*, Sherdil Khana, Sidnei Antonio Pianarob, Cesar Aguzzolic,
Jossano Saldanha Marcuzzod, Mauricio Ribeiro Baldand, Célia de Fraga Malfattia
Received: November 25, 2016; Revised: April 13, 2017; Accepted: April 21, 2017.
The evolution of TiO2 nanotubular morphology, synthesized in a mixture of luorinated ethylene glycol and glycerol electrolyte, was studied as a function of the anodization time. The samples were characterized by FEG-SEM, XRD, XPS, UV-Vis and EIS. The formation of single-or double-walled TiO2 nanotube structure can be eiciently controlled by the anodization time. For anodization times less than 30 minutes, a compact oxide layer is formed, followed by double-walled nanotube formation up to 120 minutes and single-walled nanotubes up to 240 minutes. XPS analyses show that the samples obtained with short anodization time have a high carbon content and oxygenated surface species compared to the longer-time anodized sample; however, binding energy peaks for Ti 2p remained invariant. The performances of TiO2 nanotubular photoelectrodes were evaluated in photoelectrochemical water splitting where TiO2 nanotubes anodized for 120 minutes presented the best performance that was related to their optimal morphology and charge transportation.
Keywords: Titanium dioxide nanotubes, TiO2 , Anodization, photoelectrochemical
* e-mail: [email protected]
1. Introduction
Nano-architectured TiO2 semiconductors have been
extensively studied in the last few decades mainly due to their advantageous properties such as high adsorption ability,
excellent photoelectrochemical activities and large speciic
surface area1-3. TiO
2-based materials are widely applied in
sensors4-9, pollutant degradation10, hydrogen generation11,
bio-applications12,13, and photocatalysis14-18. Owing to their
one-dimensional nature, TiO2 nanotubes ofer a high surface area (1000 m2 g-1) with electron difusion higher than that of
similar systems based on nanoparticles19. Electrochemical
anodization in luorinated electrolytes is one of the most promising and efective methods employed to obtain highly
ordered nanotube arrays of TiO2 and many other materials with controllable morphologies20-22.Optimizing anodic ilm
topography and its properties are some of the main interests for smart material application23.
By controlling parameters such as anodization potential24-26
anodization time27,28, temperature22,29, as well as the electrolyte
composition30 and its pH value31, diferent nanotubular
structures can be obtained. The irst and second generations
of electrolytes were based on aqueous electrolytes containing
hydroluoric acid and luoride salts, respectively32,33. In the
third generation, non-aqueous, organic solvents containing
luoride ions were used; this allowed controllable TiO2
nanotubes to be obtained due to the high viscosity of organic electrolytes34. The use of viscous electrolytes allows wall
smoothness by damping local spikes in the lux of reaction species by locally diferent pH values within the tubes.
However, viscous electrolytes result in to lower current
density, local acidiication and amount of competing chemical
dissolution35.
The main studied organic electrolytes consist of ethylene glycol28,34,36 and glycerol35-37. The latter is used due to its high
viscosity that inluences the difusion of ionic species, the
kinetics of nanotube formation and its morphology; therefore
it does not show current luctuations during anodization.
However, the chemical dissolution of TiO2 in glycerol is slow35,37.
Roman et al.36 studied the inluence of the applied
potential and anodization time on the nanotube diameter and length. They found that the diameter tends to increase with the water content increasing in glycerol-based electrolytes36.
a Laboratório de Pesquisa em Corrosão - LAPEC, Programa de Pós-Graduação em Engenharia de
Minas, Metalúrgica e de Materiais - PPGE3M, Universidade Federal do Rio Grande do Sul - UFRGS, Av. Bento Gonçalves, 9500, Prédio 43427, Sala 232, 91501-970, Porto Alegre, RS, Brazil. b Laboratório Interdisciplinar de Materiais Cerâmicos - LIMAC, Universidade Estadual de Ponta
Grossa - UEPG, Ponta Grossa, Av. Carlos Cavalcanti, 4748, PR, Brazil.
c Programa de Pós-Graduação em Engenharia e Ciência dos Materiais - PGMAT, Universidade de
Caxias do Sul - UCS, Rua Francisco Getúlio Vargas, 1130 - Caxias do Sul, RS, Brazil. d Instituto Nacional de Pesquisas Espaciais - INPE, Av. dos Astronautas, 1.758 - Jardim da Granja, São
An ethylene-glycol-based electrolyte presented a higher viscosity than that of a glycerol-based one (13.1 and 11.8 cP, respectively)35. High viscosity solvents decrease the
mobility of ionic species; thereby, decreasing the growth rate. However, anodization in these solvents helps decreasing the
current luctuations; therefore, smoother nanotube walls are
formed. In case of less viscous electrolytes, the growth rate is high, but higher chemical dissolution rate of TiO2 causes the formation of ripples on the tube walls35,39. These results
warrant to use ethylene-glycol/glycerol mixture (where one contributes to increase the growth rate while other to obtain
smooth walled nanotubes) and to investigate their efect on
the evolution of nanotubular morphology. Nischk et al.35
showed that for the same anodization potential and time, the walls of TiO2 nanotubes obtained in a glycerol-based electrolyte are rough; those obtained in ethylene-glycol-based electrolyte are smooth. Additionally, in glycerol-ethylene-glycol-based electrolytes, the outer diameter was wider and the length of the nanotubes was shorter than that of the nanotubes obtained in the ethylene-glycol-based electrolyte.
Albu et al.38 demonstrated the formation of double-walled
TiO2 nanotubes in ethylene glycol electrolyte at a voltage
of 120 V, showing the well-deined inner and outer walls in
the tubular morphology. Macak et al.39 reviewed diferent
anodization processes for Ti-based nano-architectured morphologies. However, the focus of these studies lay on the synthesis of nanotubes rather than their photoelectrochemical performance. Despite the fact that TiO2 nanotubes are broadly synthesized by anodization in glycerol or ethylene glycol, few studies report TiO2 nanotubes obtained by anodization in glycerol mixed with ethylene glycol36. Therefore, in order to
obtain an optimized nanotubular morphology, it is interesting to study the evolution of TiO2 nanotubes in glycerol mixed with ethylene glycol solution, and to optimize them for improved photoelectrochemical applications.
The aim of this study is to identify the nano-structures
formed during the anodization procedure. The efects of
anodization time on the morphology, crystal structure and surface properties of the prepared nanotubes were investigated
with the inal aim of applying them in photoelectrochemical
water splitting.
2. Experimental
Nanotubes were grown on Ti foil grade 2 - ASTM-F6740
(99.8 - purity: wt. %, 0.7 mm thickness, Realum), with dimensions of 1 cm × 5 cm. This foil was cleaned by ultrasonication for 15 min in degreased and deionized water (DI) in sequence, and then dried under cold air. The Ti foil was used as the working electrode and a platinum foil as the counter electrode. The distance between these electrodes was about 2 cm27. The anodization was performed at 60 V at
a potential ramp of 1 V s-1, in organic electrolyte consisting
a mixture of glycerol (Synth 99.5%) and ethylene glycol
(Synth - purity: 99.0%) in 2:1 (v/v) ratio, containing 0.25 wt%
ammonium luoride (Synth - purity: 98.0%) dissolved in 2
wt% of distilled water. The pH of the solution was pH 4.5-5.0 and the anodization time was varied up to (a) 5 minutes, (b) 15 minutes, (c) 30 minutes, (d) 60 minutes, (e) 120 minutes, (f) 180 minutes and (g) 240 minutes. The current transient (I-t) curves for the anodization were obtained by system acquisition (Multimeter Inimipa ET-2076A) of data recorded from the source meter connected to the software TCXX. After anodization, the samples were annealed in a
mule Furnace at 450 °C for 3 h with a heating ramp of
10 ºC/minto crystallize the TiO2 nanotubes34.
3. Characterization
The morphology was studied with a Field Emission Gun Scanning Electron Microscope (FEG-SEM) equipment MIRA3 by TESCAN operated at 10 and 15 kV. The crystal structure
was determined by X-ray difraction (XRD) using XRD 6000
by SHIMADZU, equipped with a graphite mono-chromator and rotating copper anode operated at 40 kV and 30 mA. The X-ray source consisted of Cu radiation (1.54184 Å) selected
with a Ni ilter. The measurements were performed with a step of 0.04° and a counting time of 0.60 s per step. The
optical properties of the TiO2 nanotubes were investigated
by UV-Vis difuse relectance spectroscopy using the Carry
5000 spectrophotometer. The spectra were recorded in the wavelength range of 200-800 nm and contributions from scattering were removed using Kubelka-Munk function41,42.
The X-ray photoelectron spectrometer (XPS) was conducted using a XPS AXIS ULTRA from Krator. The measurement carried out with Al Kα radiation (1486.6 eV). Survey spectra
were determined by 160 eV pass energy and the speciic element pass energy was ixed at 40 eV. The element energy
position was corrected using Ag energy, as a reference, obtained from a pure Ag sample.
The photoelectrochemical measurements were performed using an Autolab potentiostat (PGSTAT 100N). The experiments were performed in a quartz cell using a three-electrode setup employing TiO2 nanotubes as the working electrode, a Pt wire as the counter electrode and an Ag/AgCl/3.5M KCl electrode as reference electrode. The Ag/AgCl reference electrode was placed in a Lugging capillary to avoid a possible contamination of the working solution by the chloride coming from the reference compartment. The electrical contacts for all of the samples were made using copper wires in a
homemade airtight Telon reactor. Before each experiment,
the reference electrode was properly washed with deionized water to avoid contamination of the electrolyte with chloride ions. The linear sweep voltammetry was performed at a scan rate of 10 mV/s in the dark and under illumination. A solar simulator (Newport) incorporated with xenon lamp (Oriel) was used as a radiation source and the radiation was
calibrated by a photodiode with a known responsivity to 100 mW/cm2 (i.e. 1 sun illumination). These electrodes were
thermally treated at 450 °C which contributes to avoid organic
contamination. Prior to each measurement, the photoanodes were cleaned by 3 successive cyclic voltammetry scans, applying potentials from 1 V to -1 V vs Ag/AgCl with a scan rate of 50 mV/s43,44,45. Prior to Electrochemical impedance
spectroscopy (EIS) measurements, 3 successive CV runs were carried out. The EIS experiments were performed in the same experimental setup with equal areas shown to the electrolyte for all samples. The frequency range was 100 kHz - 100 mHz with a signal amplitude of 10 mV (peak to peak). The data was acquired under 1 Sun illumination at open circuit potential (OCP) for the respective electrodes. The waiting time to stabilize the system for OCP under 1 Sun illumination was 2 min and these values were ranged from -0.75 to 0.80 V vs Ag/AgCl. For TiO2 the stable Voc values are obtained within less than 10 sec. of illumination. Since even 10 sec illumination is enough for the open circuit potential (Voc) stability; however, we followed experimental protocol of giving more time to stabilize the Voc under illumination before performing the EIS experiments43,44,45
4. Results and Discussion
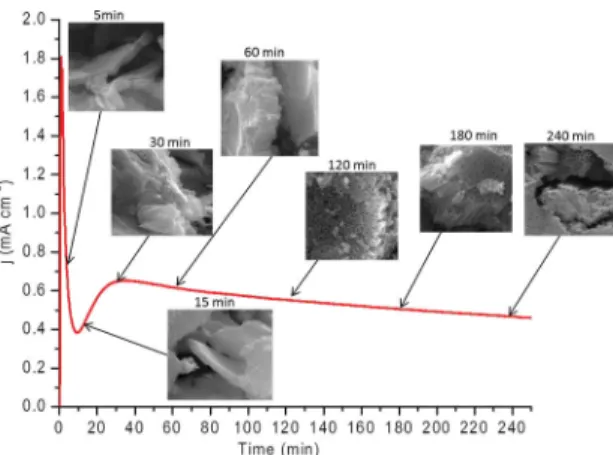
Figure 1 shows the current transient (I-t) curve obtained during the maximum time period of the anodization process. At the beginning of the anodization process, up to ~5 minutes, the anodizing current density increases abruptly to a value of ca. 1.8 mA, followed by a rapid decrease. During this anodization time, the oxidation of Ti to Ti4+ occurs due to the hydrolysis
reaction resulting in the formation of an initial oxide barrier46,47.
In addition, during this stage, the curve essentially follows
the luoride-free case48, and if samples are removed from the
electrolyte, a compact oxide layer will be formed46. After the
negatively-charged cation vacancies result from dissolution in the oxide, the latter migrates to the metal/oxide barrier due to the potential gradient at the interface49.
Figure 1. Current density-time behavior for titanium anodized at 60 V in 0.25 g NH4F and 2 g H2O for 240 minutes.
Meanwhile, the oxidation of Ti creates vacancies as well, hence facilitating the hopping of cations into the Ti vacancies46. This event slightly increases the current for a
short time, resulting32, in the pitting of the oxide layer due
to ield-assisted dissolution. In Figure 1 from 15-30 minutes,
a minor increase in the current density can be clearly seen, which is related to the pitting event. Thus, irregular nanoscale pores are expected to be formed initially, which penetrate the initial compact oxide. Subsequently, a steady-state current over time can be observed after 60 minutes of anodization time. After that, the anodization current was approximately maintained at a steady value until 240 minutes (Figure 1). Compared to the literature, the current density and the time to
achieve the steady state current density are slightly diferent
to those observed in glycerol or ethylene glycol electrolytes. This is due to the fact that we have used a mixture of both of them; ethylene glycol because of its higher viscosity and higher current density, and glycerol to avoid current density
luctuations during the anodization process. We expect that the combined efect of both may be advantageous for easy
growth of TiO2 nanotubes37. According to Albu et al.38 and
Macak et al.39 the synthesis of diferent morphologies of TiO 2
has been shown utilizing either ethylene glycol or glycerol-based electrolytes. We have used a mixture of these (viz. ethylene glycol and glycerol with a low concentration of
luoride) with the aim of investigating the evolution of tubular
morphology and its applications in photoelectrochemical water splitting.
To investigate the evolution of nanotubular morphology, we conducted a series of experiments via the removal of samples after (a) 5 minutes, (b) 15 minutes, (c) 30 minutes, (d) 60 minutes, (e) 120 minutes, (f) 180 minutes and (g) 240 minutes from the anodization bath. Figure 2 shows
the FEG-SEM images of the TiO2 nanotubes prepared at
diferent anodization times. After 5 minutes (Figure 2 (a))
of anodization, a thin oxide layer (105 nm) was formed on the surface. By increasing the anodization time to 15 and 30 minutes (Figure 2 (b) and (c), respectively), the thickness
of the oxide ilms was increased to 218 nm and 850 nm,
respectively. For the sample prepared at 30 minutes, the formation of slightly regular pits can be observed compared to those obtained at shorter time. However, tubular morphology could not be yet obtained. This may be ascribed to the fact that in these three samples, the surface barrier layer formed on the substrate surface of Ti foil is not dissolved during the anodization process, thus leading to the formation of the compact oxide layer. In addition, the I-t curve of Figure 1 clearly shows that up to ~15 minutes, the current density still decreases, and from 15 minutes to 30 minutes, a hump can be seen; yet steady current is not achieved. Thus, these conditions are not suitable for the formation of a tubular morphology.
Figure 2. FEG-SEM images of TiO2 nanotubes anodized for (a) 5 minutes, (b) 15 minutes, (c) 30 minutes, (d) 60 minutes, (e) 120 minutes, (f) 180 minutes and (g) 240 minutes. Insets show the top-view images, (h) schematic diagram showing the formation of double-walled and single-walled TiO2 nanotubes.
becomes steady46. Figures 2(d)-(g) show the morphology
of TiO2 nanotubes after anodization times of 60 minutes, 120 minutes, 180 minutes and 240 minutes, respectively. In Figure 1, the current density during these anodization times remained steady, indicating that the dissolution rate is in equilibrium with the oxidation rate, and hence the formation of nanotubular morphology can be inferred46. These igures
clearly conirm the formation of a nanotubular morphology;
however, it is clear that the top layers of these samples do
not show a well-deined tubular structure. It is known that
during initial stage of anodization, the compact oxide, i.e., the random pore layer or the initiation layer often remains as remnants on the tube tops called nanograss and is frequently observed previously in the literature39,50. Eforts have been
directed toward removing these layers50-52. Therefore, we
have tried the methodology reported elsewhere to remove that layer53,54.
Interestingly, after removal of the surface nanograss in Figures 2(d) and 2(e), a double-walled feature is revealed. The top-view images clearly show that these nanotubes are comprised of inner and outer shells. These features have been observed earlier in the literature54. It was found that the inner
shell presented a large amount of F and C species; hence, the
formation of the double-walled feature was suggested to be related to the residual amount of the trapped electrolyte species55.
Albu et al.38 explained the thickness of nanotubes in
the form of an outer and inner shell, with a variation of
thickness along the tube. Additionally, a luoride-rich layer
between the bottom of the nanotubes and the Ti substrate
was observed, which was attributed to high-ield migration of electrolyte anions, in particular small luoride species that
compete with O2- migration39,55,56 through the amorphous
tube bottom during the tube growth. On the other hand, the double-walled features disappeared for the samples prepared at 180 and 240 minutes (Figures 2(f) and (g)) of anodization time. Therefore, single-walled or double-walled TiO2 nanotubes can controllably be obtained by the optimizing the anodization time. In Figure 2 (e) in the bottom of the nanotubes obtained after 120 min of anodization, the
formation of double-walled nanotubes can be conirmed.
However, after 180 minutes of anodization (Figure (f & g)) the formation of double-wall was not observed and the outer diameter of these nanotubes is smaller than those prepared for shorter time durations; suggesting that the chemical etching occurred to dissolve the outer-wall of
nanotubes and controlling the nanotubular morphology via anodization time57.
Figure 3 compares the cross-sectional images of the TiO2 nanotubes obtained at 60 minutes, 120 minutes, 180 minutes, and 240 minutes of anodization times. It can be seen that the tube length increases with increasing time.
The geometrical parameters as a function of anodization time obtained from the FEG-SEM analyses are displayed in Figure 4. The length of the nanotubes increases from ~650 nm to ~6 µm, and the average length growth rate was found to be ~25 nm/min. Furthermore, the outer diameter and the inner diameter vary from 210 to 170 nm and 100 to 88 nm, respectively. This indicates that the nanotubes’ diameter is extremely dependent on the anodization time51.
The decrease in the diameters for larger anodization times can be related to the formation of single-walled nanotubes. When compared to a similar work in electrolyte without the addition of glycerol for similar anodization conditions, the nanotubes obtained here are found to be shorter; however, the outer diameter increased26,34. These results suggest that the
addition of glycerol to the electrolyte results in decreasing the growth rate of TiO2 nanotubes; yet it increases the diameter (Figure 4).
The as-anodized nanotubes are generally amorphous; therefore, thermal treatment is required to crystallize them58.
Figure 5shows the XRD patterns of the samples annealed at
450 °C for 3 h. The characteristic peak related to the anatase
phase of TiO2 appears at 2θ = 25.2°. The peaks at 38.3º, 40.4°
and 53.4° correspond to Ti substrate KOH30,34,58. It should
be noted that for short anodization times such as from 5-30 minutes, the characteristic anatase peak is hardly visible. On the other hand, its relative intensity compared to the Ti peaks increases with anodization time. These results are in line with the observed oxide thickness, as for long time of anodization, a thicker nanotubular layer is formed (Figure 4). The crystalline properties and optical absorption are two important factors for the photoelectrochemical performance of TiO2 nanotubular photoanodes. Subsequently TiO2 nanotubes with a better optical absorption and higher crystallinity will result in a better photoelectrochemical activity.
UV-Vis absorption spectra were obtained to assess the optical absorption of the TiO2 nanotubes obtained at diferent anodizing times. For the sake of simplicity, UV-Vis spectra of only a few samples are shown in Figure 6. The optical bandgap energy was found to be ~3.1-3.2 eV for all samples, and is in line with the reported value for TiO259,60. It can
be seen that the absorption from the sample prepared for
Figure 4. Diagram of nanotube inner diameter (a), external diameter (b) and length (c).
Figure 5. XRD patterns of TiO2 samples annealed at 450 °C during 3 h with a heating and cooling rate of 10 °C min-1.
Figure 6. UV-Vis difuse relectance spectra of TiO2 nanotubes obtained at diferent anodization times
240 minutes is higher than that prepared for shorter times of anodization. This is due to the fact that the nanotube obtained for longer times of anodization is longer (Figure 3), therefore exhibiting high absorption59.
The XPS spectra of the TiO2 nanotubes obtained at 5 and 120 minutes of anodization are presented in Figure 7. These spectra are obtained from the as-anodized and thermally treated samples. The survey spectra (Figure 7a) show that the dominant signals are from Ti, O and C, and the relative intensities of C1s for 5 min samples are higher than those of the samples prepared for 120 minutes. The exposure of the samples to air, as well as the anodization solution itself, can be reasons for the carbon content. However, for the
anodic thin ilm obtained at 5 minutes, the higher carbon content might be related to the high carbon difusion at the
thin oxide/metal barrier. For the Ti 2p spectra (Figure 7b), the core lines for 2p1/2 and 2p3/2 are centered at 464 eV and oxide 455.8 eV respectively, related to Ti4+61. For all the
samples, the Ti 2p spectra do not difer in binding energies,
indicating the formation of TiO2 for the applied anodization conditions. Additionally, the deconvoluted O ls spectra (Figure 7c) present two peaks. The peak at ~531 eV corresponds to the oxide ions of the TiO2, and another peak related to the oxygenated species at higher binding energy side centered at ~532.7 eV corresponds to the oxidized hydrocarbons. However, for the sample prepared for 5 min higher energy peak present larger area as compared to the oxide ion peak of TiO2 (~531 eV). It may be due to the fact that for 5 min of anodization time the porous oxidized layer is thin and non-uniform; helping to incorporate higher concentration of oxygenated species from the solution to the substrate.
Subsequently, the samples obtained were tested for photoelectrochemical water splitting in 1 M KOH (aq) electrolyte under AM 1.5 G (1 sun illumination) conditions. The linear sweep voltammetry (LSV) curves are presented in Figure 8. The best photoelectrochemical performance is acquired from the sample obtained at 120 min of anodization time. Comparing its optical properties with samples prepared at longer times of anodization against their photoelectrochemical performance, it is clear that better optical absorption properties (Figure 6) and improved photoelectrochemical performance cannot be achieved simultaneously. Moreover, the photoelectrochemical performance of the sample prepared at 60 min is also better than that of samples prepared at 180 and 240 min (Figure 8). In accordance with the Beer-Lembert law, more photons will be harvested by the longer nanotubes. On the other hand, these nanotubes will have more recombination centers and higher series resistance, which result in a decreasing photoelectrochemical performance.
Thus, to ensure eicient electron collection, there should be
Figure 7. XPS spectra of as-anodized and thermally treated TiO2 nanotubes; (a) survey spectra (b) Ti 2p region and (c) O 1s region.
Figure 8. Linear sweep voltammetry curves of TiO2 nanotubes
obtained at diferent anodization times.
TiO2 nanotubes. Furthermore, the lower photoelectrochemical performance of the samples prepared at shorter anodization
times (≤ 30 min) can be rationalized on the basis of their
compact morphology, resulting in a lower surface area as well as lower optical absorption abilities. Therefore, the 1D nature of TiO2 nanotubes and their optimal light absorption are important factors in improving the photoelectrochemical performance.
To obtain further insight into the photoelectrochemical properties of TiO2 nanotubes as a function of anodization time, the semiconductor/electrolyte interfacial charge transportation properties were investigated by electrochemical impedance
spectroscopy (EIS). Figure 9 displays the Nyquist plots obtained from the TiO2 nanotubes under AM 1.5G (1 sun illumination) conditions at open circuit potential. It can be seen that all of the samples present an incomplete semicircle, which is the characteristic of a capacitive system exhibiting non-ideal behavior. One time constant corresponding to the
native passive anodic ilm was observed; hence, EIS data were itted to an equivalent circuit (Figure 9) consisting
of a series resistance Rs and single constant phase element (CPE) parallel with polarization resistance Rp. Based on the nanotubular morphology, i.e. porous structure, adding CPE
Z
Y j
1
CPE n
0
~
=
R
W
for the TiO2 nanotubes-electrolyte interface is physically true20. The impedance of the CPE is given by:
Where Y0 is the admittance of an ideal capacitance, ω is the signal frequency and n is an empirical constant, ranging from 0-162-64. Fitting the Nyquist plots into the proposed
equivalent circuit, the values of the circuit elements have been deduced and are displayed in Table 1.
Figure 9. (a) Nyquist plots of TiO2 nanotubes obtained at diferent anodization times, where the symbols represent the experimental data
and the solid lines represent circuit itting; and (b) values of Rp and Y0 obtained from the circuit itting as a function of anodization time.
Table 1. EIS parameters for the samples.
Anodization time Rs(Ω) Rp(KΩ) Y0/µMho n
5 min 5.61 2.32 86 0.92
15 min 5.63 1.96 95 0.93
30 min 6.12 1.74 120 0.96
60 min 6.20 0.95 152 0.93
120 min 6.59 0.76 398 0.93
180 min 6.19 1.11 455 0.96
240 min 5.80 1.19 740 0.93
to the fact that longer nanotubes ofer large area for the
electrolyte; hence, capacitance increases with time. These results corroborate the formation of a thick anodic
ilm when the anodization time is increased; the increase
in the relative intensity of the XRD peak of anatase TiO2 (Figure 5) and an increase in the length of nanotubes from
the FEG-SEM images (Figure 3) have clearly conirmed
that. Furthermore, the charge transfer resistance (Rp) decreases from 5 minutes up to 120 minutes of anodization time, and then slightly increases upon any further increase in anodization time. These results are in line with the photoelectrochemical performance of these samples, as the best performance was obtained for the sample anodized for 120 minutes (Figure 8). On the other hand, the sample prepared for 5 min of anodization time had the highest charge transfer resistance as well as the lowest photocurrent response. Additionally, the samples prepared at 240 and 180 minutes had lower charge transfer resistance compared
to those prepared at shorter times (≤ 30 minutes), mainly
due to their large absorption as well as nanotubular nature. Hence, for improved photoelectrochemical performance, the optimal charge transportation strongly depends on the tubular morphology as well as the optical properties of the
TiO2 nanotubes. Based on the LSV curves and Nyquist
plots, the sample prepared for 120 minutes of anodization
time had the best photoelectrochemical properties, and has the potential to be used for technical applications.
5. Conclusions
In this work, the evolution of the tubular morphology of TiO2 nanotubes was studied by varying anodization time in
glycerol mixed ethylene glycol electrolyte-based luorinated
electrolyte. The tubular morphology was formed after 60 minutes of anodization time; before that, a compact oxide layer was observed. The diameter of the nanotubes slightly increases after 120 minutes due to the formation of single-walled nanotubes. However, their length increases linearly with anodization time. The formation of the single- or double-walled nanotubular morphology of TiO2 is eiciently controlled by the anodization time. For improved photoelectrochemical performance from the TiO2 nanotubes, the tube length should be suiciently long to harvest most of the photons, yet short enough to decrease the recombination carriers. The performance of TiO2 nanotube photoanodes evaluated in photoelectrochemical water splitting demonstrated that TiO2 nanotubes anodized for 120 minutes presented the best performance. Also, Y0 increased with the anodization time, showing that the interfacial capacitance increased with anodization time.
6. Acknowledgments
Thanks are due to CAPES / UDELAR (047/2013) and
FAPERGS PqG (2235-2551 / 14-4) for the inancial support.
We also thank C-LABMU, UEPG, for carrying out the FEG-SEM analysis and LCMicro-UCS and INPE for their contribution in this work.
1. Shankar K, Bandara J, Paulose M, Wietasch H, Varghese OK,
Mor GK, et al. Highly Eicient Solar Cells using TiO2 Nanotube
Arrays Sensitized with a Donor-Antenna Dye. Nano Letters. 2008;8(6):1654-1659.
2. Wang H, Bai Y, Zhang H, Zhang Z, Li J, Guo L. CdS Quantum Dots-Sensitized TiO2 Nanorod Array on Transparent Conductive Glass Photoelectrodes. The Journal of Physical Chemistry C. 2010;114(39):16451-16455. DOI: 10.1021/jp104208z
3. Wang H, Bai Y, Wu Q, Zhou W, Zhang H, Li J, et al. Rutile TiO2
nano-branched arrays on FTO for dye-sensitized solar cells. Physical Chemistry Chemical Physics. 2011;13(15):7008-7013. DOI: 10.1039/C1CP20351G
4. Du X, Wang Y, Mu Y, Gui L, Wang P, Tang Y. A New Highly Selective H2 Sensor Based on TiO2/PtO−Pt Dual-Layer Films. Chemistry of Materials. 2002;14(9):3953-3957. DOI: 10.1021/ cm0201293
5. Al-Homoudi IA, Thakur JS, Naik R, Auner GW, Newaz G. Anatase TiO2 ilms based CO gas sensor: Film thickness,
substrate and temperature efects. Applied Surface Science. 2007;253(21):8607-8614. DOI: 10.1016/j.apsusc.2007.04.068
6. Li J, Zhang JZ. Optical properties and applications of hybrid semiconductor nanomaterials. Coordination Chemistry Reviews. 2009;253(23-24):3015-3041. DOI: 10.1016/j.ccr.2009.07.017
7. Zhao R, Xu M, Wang J, Chen G. A pH sensor based on the TiO2 nanotube array modiied Ti electrode. Electrochimica Acta. 2010;55(20):5647-5651. DOI: 10.1016/j.electacta.2010.04.102
8. Mun KS, Alvarez SD, Choi WY, Sailor MJ. A Stable, Label-free Optical Interferometric Biosensor Based on TiO2 Nanotube Arrays. ACS Nano. 2010;4(4):2070-2076. DOI: 10.1021/nn901312f
9. Lou Z, Li F, Deng J, Wang L, Zhang T. Branch-like Hierarchical
Heterostructure (α-Fe2O3/TiO2): A Novel Sensing Material
for Trimethylamine Gas Sensor. ACS Applied Materials & Interfaces. 2013;5(23):12310-12316. DOI: 10.1021/am402532v
10. Macak JM, Zlamal M, Krysa J, Schmuki P. Self-Organized TiO2 Nanotube Layers as Highly Eicient Photocatalysts. Small. 2007;3(2):300-304. DOI: 10.1002/smll.200600426
11. Paulose M, Mor GK, Varghese OK, Shankar K, Grimes CA. Erratum to “Visible light photoelectrochemical and water-photoelectrolysis properties of titania nanotube arrays” [J. Photochem. Photobiol. A: Chem. 178 (2006) 8-15]. Journal of Photochemistry and Photobiology A: Chemistry. 2010;215(2-3):229. DOI: 10.1016/j.jphotochem.2010.08.012
12. Chen D, Zhang H, Li X, Li J. Biofunctional Titania Nanotubes for Visible-Light-Activated Photoelectrochemical Biosensing. Analytical Chemistry. 2010;82(6):2253-2261. DOI: 10.1021/ ac9021055
13. Wang D, Liu L. Continuous Fabrication of Free-Standing TiO2
Nanotube Array Membranes with Controllable Morphology for Depositing Interdigitated Heterojunctions. Chemistry of Materials. 2010;22(24):6656-6664. DOI: 10.1021/cm102622x
14. Ding Z, Lu GQ, Greenield PF. Role of the Crystallite Phase of
TiO2 in Heterogeneous Photocatalysis for Phenol Oxidation in Water. The Journal of Physical Chemistry B. 2000;104(19):4815-4820. DOI: 10.1021/jp993819b
15. Kočí K, Matějů K, Obalová L, Krejčíková S, Lacný Z, Plachá D, et al. Efect of silver doping on the TiO2 for photocatalytic
reduction of CO2. Applied Catalysis B: Environmental. 2010;96(3-4):239-244. DOI: 10.1016/j.apcatb.2010.02.030
16. Dongliang Y, Song Y, Zhu X, Yang R, Han A. Morphological evolution of TiO2 nanotube arrays with lotus-root-shaped nanostructure. Applied Surface Science. 2013;276:711-716. DOI: 10.1016/j.apsusc.2013.03.158
17. Roy SC, Varghese OK, Paulose M, Grimes CA. Toward Solar Fuels: Photocatalytic Conversion of Carbon Dioxide to Hydrocarbons. ACS Nano. 2010;4(3):1259-1278. DOI: 10.1021/nn9015423
18. Dong J, Han J, Liu Y, Nakajima A, Matsushita S, Wei S, et al. Defective Black TiO2 Synthesized via Anodization for Visible-Light Photocatalysis. ACS Applied Materials & Interfaces. 2014;6(3):1385-1388. DOI: 10.1021/am405549p
19. Lynch RP, Ghicov A, Schmuki P. A Photo-Electrochemical Investigation of Self-Organized TiO2 Nanotubes. Journal of The Electrochemical Socitey. 2010;157(3):G76-G84. DOI: 10.1149/1.3276455
20. Khan S, Teixeira SR, Santos MJL. Controlled thermal nitridation resulting in improved structural and photoelectrochemical properties from Ta3N5 nanotubular photoanodes. RSC Advances. 2015;5(125):103284-103291. DOI: 10.1039/C5RA17227F
21. Gonçalves RV, Wender H, Migowski P, Feil AF, Eberhardt D, Boita J, et al. Photochemical Hydrogen Production of Ta2O5
Nanotubes Decorated with NiO Nanoparticles by Modiied
Sputtering Deposition. The Journal of Physical Chemistry C. 2017;121(11):5855-5863. DOI: 10.1021/acs.jpcc.6b10540
22. Xie ZB, Blackwood DJ. Efects of anodization parameters on the
formation of titania nanotubes in ethylene glycol. Electrochimica Acta. 2010;56(2):905-912. DOI: 10.1016/j.electacta.2010.10.004
23. Zhou X, Nguyen NT, Özkan S, Schmuki P. Anodic TiO2 nanotube
layers: Why does self-organized growth occur—A mini review. Electrochemistry Communications. 2014;46:157-162. DOI: 10.1016/j.elecom.2014.06.021
24. Luan X, Guan D, Wang Y. Facile Synthesis and Morphology Control of Bamboo-Type TiO2 Nanotube Arrays for High-Eiciency Dye-Sensitized Solar Cells. The Journal of Physical Chemistry C. 2012;116(27):14257-14263. DOI: 10.1021/jp305280q
25. Chanmanee W, Watcharenwong A, Chenthamarakshan CR, Kajitvichyanukul P, de Tacconi NR, Rajeshwar K. Formation and Characterization of Self-Organized TiO2 Nanotube Arrays by Pulse Anodization. Journal of The American Chemical Society. 2008;130(3):965-974. DOI: 10.1021/ja076092a
26. Paulose M, Shankar K, Yoriya S, Prakasam HE, Varghese OK, Mor GK, et al. Anodic Growth of Highly Ordered TiO2 Nanotube
Arrays to 134 μm in Length. The Journal of Physical Chemistry B. 2006;110(33):16179-16184. DOI: 10.1021/jp064020k
28. Paulose M, Prakasam HE, Varghese OK, Peng L, Popat KC, Mor GK, et al. TiO2 Nanotube Arrays of 1000 μm Length
by Anodization of Titanium Foil: Phenol Red Difusion. The Journal of Physical Chemistry C. 2007;111(41):14992-14997. DOI: 10.1021/jp075258r
29. Wang C, Wang M, Xie K, Wu Q, Sun L, Lin Z, et al. Room
temperature one-step synthesis of microarrays of N-doped
lower-like anatase TiO2 composed of well-deined multilayer nanolakes by Ti anodization. Nanotechnology. 2011;22(30):305607. DOI: 10.1088/0957-4484/22/30/305607
30. Indira K, Ningshen S, Mudali UK, Rajendran N. Efect of
Anodization Temperature on the Surface Morphology of Anodized Titanium. In: Jayakumar S, Kannan MD, Balasundaraprabhu R, Prassana S, eds. Thin Films and Nanomaterials. Noida: Macmillan India; 2011. p. 63-66.
31. Sreekantan S, Lockman Z, Hazan R, Tasbihi M, Tong LK,
Mohamed AR. Inluence of electrolyte pH on TiO2 nanotube
formation by Ti anodization. Journal of Alloys and Compounds. 2009;485(1-2):478-483. DOI: 10.1016/j.jallcom.2009.05.152
32. Roy P, Berger S, Schmuki P. TiO2 Nanotubes: Synthesis and
Applications. Angewandte Chemie. 2011;50(13):2904-2939. DOI: 10.1002/anie.201001374
33. Altomare M, Pozzi M, Allieta M, Bettini LG, Selli E. H2 and O2
photocatalytic production on TiO2 nanotube arrays: Efect of the anodization time on structural features and photoactivity, Applied Catalysis B: Environmental. 2013;136-137:81-88. DOI: 10.1016/j.apcatb.2013.01.054
34. Wang C, Chen D, Ping G, Liu S, Huang X, Huang Y, et al. Controllable synthesis of well-ordered TiO2 nanotubes in a
mixed organic electrolyte for high-eiciency photocatalysis.
Science China Chemistry. 2012;55(11):2373-2380. DOI: 10.1007/s11426-012-4680-0
35. Nischk M, Mazierski P, Gazda M, Zaleska A. Ordered TiO2
nanotubes: The effect of preparation parameters on the
photocatalytic activity in air puriication process. Applied Catalysis B: Environmental. 2014;144:674-685. DOI: 10.1016/j. apcatb.2013.07.041
36. Roman I, Trusca RD, Soare ML, Fratila C, Krasicka-Cydzik E,
Stan MS, et al. Titanium dioxide nanotube ilms: Preparation,
characterization and electrochemical biosensitivity towards alkaline phosphatase. Materials Science and Engineering: C. 2014;37:374-382. DOI: 10.1016/j.msec.2014.01.036
37. Macak JM, Schmuki P. Anodic growth of self-organized anodic TiO2 nanotubes in viscous electrolytes. Electrochimica Acta. 2006;52(3):1258-1264. DOI: 10.1016/j.electacta.2006.07.021
38. Albu SP, Ghicov A, Aldabergenova S, Drechsel P, LeClere D, Thompson GE, et al. Formation of Double-Walled TiO2 Nanotubes and Robust Anatase Membranes. Advanced Materials. 2008;20(21):4135-4139. DOI: 10.1002/adma.200801189
39. Macak JM, Tsuchiya H, Ghicov A, Yasuda K, Hahn R, Bauer S, et al. TiO2 nanotubes: Self-organized electrochemical formation, properties and applications. Current Opinion in Solid State and Materials Science. 2007;11(1-2):3-18. DOI: 10.1016/j. cossms.2007.08.004
40. ASTM International. ASTM F67-13 - Standard Speciication for Unalloyed Titanium, for Surgical Implant Applications (UNS R50250, UNS R50400, UNS R50550, UNS R50700). West Conshohocken: ASTM International; 2013.
41. Kubelka P. New Contributions to the Optics of Intensely Light-Scattering Materials. Part II: Nonhomogeneous Layers. Journal of the Optical Society of America. 1954;44(4):330-335 DOI: 10.1364/JOSA.44.000330
42. Murphy AB. Band-gap determination from difuse relectance measurements of semiconductor ilms, and application to
photoelectrochemical water-splitting. Solar Energy Materials and Solar Cells. 2007;91(14):1326-1337. DOI: 10.1016/j. solmat.2007.05.005
43. Chen Z, Dinh H, Miller E, eds. Photoelectrochemical Water Splitting Standards, Experimental Methods, and Protocols. New York: Springer; 2013.
44. Khan S, Santos MJL, Malfatti CF, Dupont J, Teixeira SR. Pristine Ta3N5 Nanotubes: Trap-Driven High External Biasing Perspective in Semiconductor/Electrolyte Interfaces. Chemistry A European Journal. 2016;22(51):18501-18511. DOI: 10.1002/ chem.201603246
45. Khan S, Zapata MJM, Baptista DL, Gonçalves RV, Fernandes
JA, J. Dupont J, et al. Efect of Oxygen Content on the
Photoelectrochemical Activity of Crystallographically Preferred Oriented Porous Ta3N5 Nanotubes. The Journal of Physical
Chemistry C. 2015;119(34):19906-19914. DOI: 10.1021/acs. jpcc.5b05475
46. Smith YR, Ray RS, Carlson K, Sarma B, Misra M. Self-Ordered Titanium Dioxide Nanotube Arrays: Anodic Synthesis and Their Photo/Electro-Catalytic Applications. Materials. 2013;6(7):2892-2957. DOI: 10.3390/ma6072892
47. Munirathinam B, Pydimukkala H, Ramaswamy N. Neelakantan
L. Inluence of crystallite size and surface morphology on
electrochemical properties of annealed TiO2 nanotubes. Applied Surface Science. 2015;355:1245-1253. DOI: 10.1016/j. apsusc.2015.08.017
48. Grimes CA, Mor KK. TiO2 Nanotube Arrays. New York:
Springer; 2009.
49. Macak JM, Hildebrand H, Marten-Jahns U, Schmuki P. Mechanistic aspects and growth of large diameter self-organized TiO2 nanotubes. Journal of Electroanalytical Chemistry. 2008;621(2):254-266. DOI: 10.1016/j.jelechem.2008.01.005
50. Kim D, Ghicov A, Schmuki P. TiO2 Nanotube arrays: Elimination of
disordered top layers (“nanograss”) for improved photoconversion
eiciency in dye-sensitized solar cells. Electrochemistry Communications. 2008;10(12):1835-1838. DOI: 10.1016/j. elecom.2008.09.029
51. Song YY, Lynch R, Kim D, Roy P, Schmuki P. TiO2 Nanotubes: Eicient Suppression of Top Etching during Anodic Growth:
Key to Improved High Aspect Ratio Geometries Corrosion, Passivation, and Anodic Films. Electrochemical and Solid-State Letters. 2009;12(7):C17-C20.
52. Albu SP, Schmuki P. Highly deined and ordered top-openings
53. Liao Y, Zhang D, Wang Q, Wen T, Jia L, Zhong Z, et al. Open-top TiO2 nanotube arrays with enhanced photovoltaic and photochemical performances via a micromechanical cleavage approach. Journal of Materials Chemistry A. 2015;3(27):14279-14283. DOI: 10.1039/c5ta02799c
54. Vaenas N, Stergiopoulos T, Kontos AG, Likodimos V, Boukos N, Falaras P. Sensitizer activated solar cells based on self-organized TiO2 nanotubes. Microelectronic Engineering. 2012;90:62-65. DOI: 10.1016/j.mee.2011.03.002
55. So S, Hwang I, Schmuki P. Hierarchical DSSC structures based on “single walled” TiO2 nanotube arrays reach a back-side
illumination solar light conversion eiciency of 8%. Energy & Environmental Science. 2015;8(3):849-854. DOI: 10.1039/ C4EE03729D
56. Yasuda K, Macak JM, Berger S, Ghicov A, Schmuki P. Mechanistic Aspects of the Self-Organization Process for Oxide Nanotube Formation on Valve Metals. Journal of The Electrochemical Society. 2007;154(9):C472-C478. DOI: 10.1149/1.2749091
57. Habazaki H, Fushimi K, Shimizu K, Skeldon P, Thompson GE.
Fast migration of luoride ions in growing anodic titanium oxide.
Electrochemistry Communications. 2007;9(5):1222-1227. DOI: 10.1016/j.elecom.2006.12.023
58. Beranek R, Tsuchiya H, Sugishima T, Macak JM, Taveira L, Fujimoto S, et al. Enhancement and limits of the photoelectrochemical
response from anodic TiO2 nanotubes. Applied Physics Letters.
2005;87(24):243114. DOI: 10.1063/1.2140085
59. Zhang Z, Wang P. Optimization of photoelectrochemical water splitting performance on hierarchical TiO2 nanotube arrays. Energy & Environmental Science. 2012;5(4):6506-6512. DOI: 10.1039/c2ee03461a
60. Choudhury B, Bayan S, Choudhury A, Chakraborty P. Narrowing
of band gap and efective charge carrier separation in oxygen deicient TiO2 nanotubes with improved visible light photocatalytic
activity. Journal of Colloid and Interface Science. 2016;465:1-10. DOI: 2016;465:1-10.1016/j.jcis.2015.11.050
61. Fu Y, Du H, Zhang S, Huang W. XPS characterization of surface
and interfacial structure of sputtered TiNi ilms on Si substrate.
Materials Science and Engineering: A. 2005;403(1-2):25-31. DOI: 10.1016/j.msea.2005.04.036
62. Barsoukov E, Macdonald JR, eds. Impedance Spectroscopy: Theory, Experiment and Applications. 2nd Ed. Hoboken: John
Wiley & Sons; 2005.
63. Lvovich VF. Impedance Spectroscopy - Applications to Electrochemical and Dielectric Phenomena. Hoboken: John Wiley & Sons; 2012. 368 p.