Study of size effect using digital image correlation
Estudo do efeito de escala utilizando correlação de
imagem digital
a Departamento de Engenhenharia de Estruturas, Escola de Engenharia da Universidade Federal de Minas Gerais, , UFMG, Belo Horizonte, MG.
Abstract
Resumo
Size effect is an important issue in concrete structures bearing in mind that it can inluence many aspects of analysis such as strength, brittleness and structural ductility, fracture toughness and fracture energy, among others. Further this, ever more new methods are being developed to evalu
-ate displacement ields in structures. In this paper an experimental evaluation of the size effect is performed applying Digital Image Correlation (DIC) technique to measure displacements on the surface of beams. Three point bending tests were performed on three different size concrete beams with a notch at the midspan. The results allow a better understanding of the size effect and demonstrate the eficiency of Digital Image
Correlation to obtain measures of displacements.
Keywords: size effect, digital image correlation, experimental analysis.
O efeito de escala é uma questão relevante em estruturas de concreto, uma vez que inluencia vários aspectos de análise, principalmente
aspectos correlacionados com a resistência, fragilidade e ductilidade estrutural, energia e tenacidade à fratura, dentre outros. Além disto, cada
vez mais, novas metodologias estão sendo desenvolvidas para avaliar campos de deslocamentos em estruturas. Neste trabalho uma avaliação experimental do efeito de escala é realizada, utilizando como ferramenta de medida a correlação de imagem digital (CID). Vigas de concreto, com três tamanhos distintos e com entalhes no meio do vão, foram ensaiadas por meio do esquema de lexão em três pontos. Os resultados encontrados permitem um melhor entendimento do efeito de escala e demonstram a eiciência da correlação de imagem digital na obtenção de
medidas de deslocamentos.
Palavras-chave: efeito de escala, correlação de imagem digital, análise experimental.
A. H. A. SANTOS a
R. L. S. PITANGUEIRA a
G. O. RIBEIRO a
R. B. CALDAS a
1. Introduction
The size effect is an aspect that should be considered in any physi
-cal theory, which is why this subject has been the focus of many engineering problems. This matter is so ancient that it was noted by Leonardo da Vinci in the 1500s, when he performed experimen
-tal studies with iron wires of equal diameters and different lengths and observed that tensile strength decreased as the wire length
increased.
The study of the size effect was advanced greatly with the cre
-ation of fracture mechanics in the work by GRIFFITH [1], where the variation of the elastic energy of solids caused by the presence of faults was investigated, which was linked to the statistical concepts of Mariotte’s ideas. This effect is without a doubt, the strongest ar
-gument in favor of the use of fracture mechanics to study concrete structures because it inluences many aspects of analysis, particu
-larly those correlated to resistance, structural brittleness and ductil
-ity, fracture energy, fracture toughness, etc.
Until the early 1980s, there were few studies regarding size ef
-fect, which included those performed by KAPLAN [2], KANI [3] and GLUCKLICH [4] in the experimental ield and by HILLERBORG et al. [5] in the theoretical ield. These studies evidenced a strong dependency between the nature of a concrete fracture and the size effect and indicated the need to relate it to the energy necessary for the propagation of issures (BAZANT; CEDOLIN [6] and OZ
-BOLT et al. [7]).
Currently, the size effect has been analyzed by tests in symmetri
-cal beams subjected to lexural bending at three points, where the
span/height ratio is maintained constant and the height is changed
according to the speciication by RILEM 89-FMT [8]. In these tests, load versus CMOD (crack mouth opening displacement) curves or load versus vertical displacement curves are obtained.
Various techniques can be used to obtain the displacements of such beams, such as digital image correlation (DIC). This tech
-ield on the sample’s surface. With DIC, the monitoring points are deined in the area of analysis, and then the relative displacements between these points along the entire ield are calculated (NGUY
-EN et al.[9], RÉTHORÉ et al.[10], ALAM[11]).
In this study, the size effect is evaluated using digital image corre
-lation as a measurement tool. The results allow better observation
and understanding of the phenomenon.
2. Digital image correlation technique
Digital image correlation (DIC) is an optical method to visualize displacement ields by successive post-processing of captured im
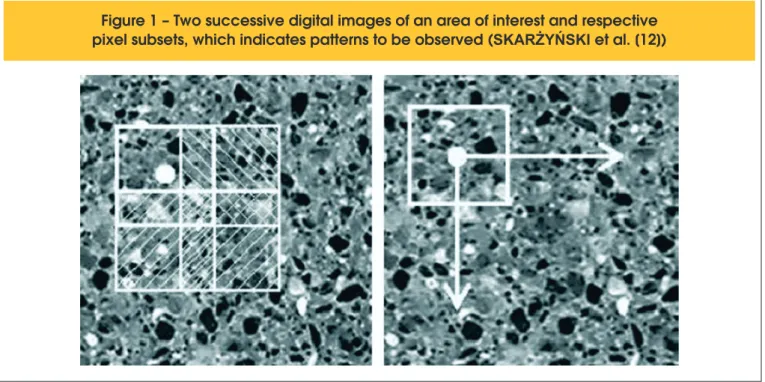
-ages at a constant frequency, as explained by SKARŻYŃSKI et al. [12].
This technique uses textural patterns, natural or artiicial, as in
-formation carriers. Displacement patterns can be obtained by
combining the captured image surfaces before and after the
de-formation or displacement using a function of adequate correlation (SUTTON et al. [13]).
The images are captured by high-precision digital cameras with sensors. The sensors of these cameras are composed of small, photo-sensitive elements, called pixels. When an image is cap
-tured, each pixel represents three numbers (color components Y, Cb, and Cr) at the proportion of the amount of light relected by the object being photographed. The Y, Cb, and Cr indexes represent luminosity or brightness, blue tonality, and red tonality, respective
-ly. The digital image correlation system should be able to interpret different light intensities and record grayscale patterns for each pixel such that each point is unique.
To use the digital image correlation technique, the system should have at least three functions, as indicated by SKARŻYŃSKI et al. [12], which are (i) image intensity ield, (ii) correlation function, and
(iii) interpolation function.
The image intensity ield attributes a scalar value to each point of the image plane that represents the light intensity (Y component) of the corresponding point in the physical space. The image intensity ield also indicates the shades of grey that represent the point, which can vary numerically between 0 (black) and 255 (white) for
an 8-bit image.
In the digital image, the area of interest should be selected, and
small subsets, called patterns, should be chosen. In Figure [1], four patterns are selected in the irst image, and the irst pattern is observed in the second image. If the displacements of these pat
-terns between two sequential images are too small, their Cartesian positions are considered to have been maintained. The strain pat
-tern is detected by comparing two consecutive images, which are
captured by a digital camera that is maintained at a ixed position with its axis oriented perpendicular to the beam’s surface plane, as indicated by PAN et al. [14] (Figure [2]).
A local displacement vector is obtained for each pattern (Figure [1]) using a correlation function between two consecutive light intensity distributions (Y component) in two digital images. The
function calculates possible displacements and correlates all
grey values from the irst image with all of the grey values from the second image. This displacement vector is adjusted using an
interpolation function.
In digital cameras, charged coupled devices operate in the Y-Cb-Cr color space as opposed to the R-G-B color space (R is red, G is green, B is blue). Image storage is preceded by conversion of the
Figure 2 – Digital image capture system (modified) (Pan et al. [14])
R-G-B to the Y-Cb-Cr color space according to Norm ISO/TC42N 4378:1998 [15], as indicated in Equation [1].
(1)
.
0.081312
0.418688
0.5
128
0.5
0.331264
0.168736
128
0.1145
0.5866
0.2989
B
G
R
+
=
C
B;
+
G
R
=
C
B;
+
G
+
R
=
Y
r b
-The precision of the digital image correlation technique is strongly dependent on the size of the pattern selected and on its quality. The pattern spot should contain 4 to 10 pixels on the surface of the specimen, as indicated by SKARŻYŃSKI et al. [12].
3. Experimental program
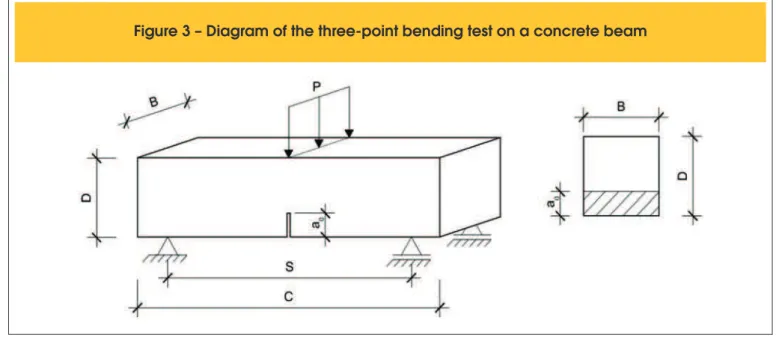
The experimental program consisted of laboratory tests using beams subjected to lexural bending at three points performed in concrete specimens of three different sizes. Table [1] presents the
nominal dimensions of the tested beams according to the scheme
represented in Figure [3].
The specimens were composed of a rectangular cross-section (B
x D) with a ixed width of 80 mm and an effective span (S) equal to
four times the section height D. The notch at the mid-section of the
span (a0) was maintained at 40% of the beam height. The notch
on the underside of each specimen was wet-cut using a diamond cutting disk with a thickness of approximately 2 mm.
The concrete used was made from a Portland CPII-E32 cement mixture; the ine aggregates had a ineness modulus equal to 2.25
mm, and the coarse aggregates had a maximum diameter of 12.5
mm. Figure [4] presents the grain size curves of the aggregates. To determine the mechanical parameters of the compressive
strength, tensile strength, and static elastic modulus of
con-crete, an EMIC PC 200 servo-hydraulic machine was used fol
-lowing the recommendations of norms NBR 5739:2007 [16], NBR 8522:2008 [17], and NBR 7222:2011 [18], respectively. The cylindrical specimens measured 10 cm in diameter and 20
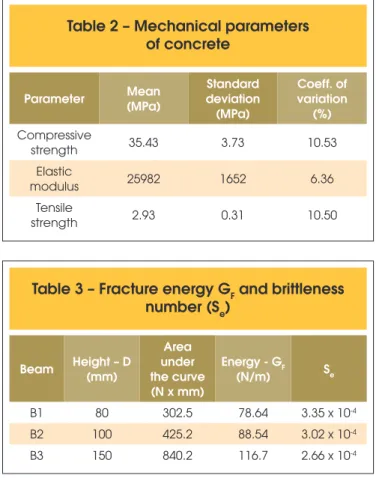
cm in length. Table [2] presents the values of these mechanical
parameters.
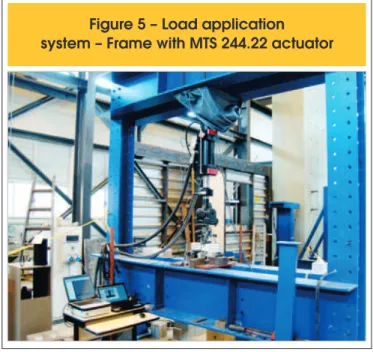
To apply the load, a plane frame with an MTS 244.22 actuator with a 100-kN load capacity was used. A 50-kN load cell was coupled
to this actuator for compliance of the load-displacement results in
the data acquisition system (Figure [5]). The beam displacement control was induced by a vertical displacement “v” imposed on the half span of the beam at a rate of 0.01 mm/min.
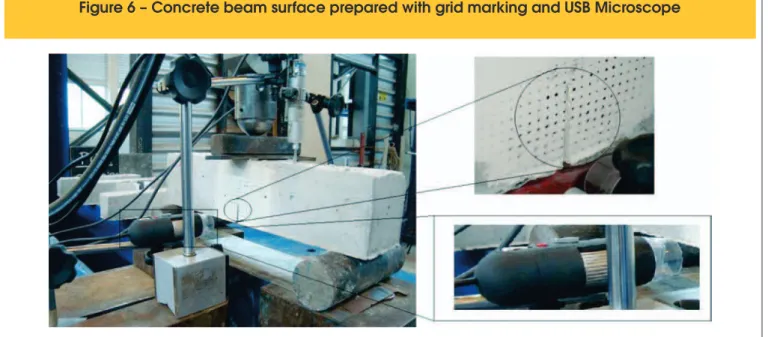
Before the test, the surfaces of the concrete beams were polished and then grid-marked for better monitoring of the standards. The images were captured by a high-resolution USB microscope with a 2.0 megapixel image sensor and video resolution capture of 1280 x 960, as presented in Figure [6]. The image capture rate was set at 5 frames per second, which was recorded in an AVI format, and the light was generated by LED lamps from the micro
-scope itself. This equipment along with the digital image process
-Figure 4 – Grain size curves (a) of aggregated fines (b) of aggregated coarse material
A
B
ing software developed in a LabView platform, which was provided by the Graduation Program in Structural Engineering (Programa de Pós-Graduação de Engenharia de Estruturas – PROPEEs) of the Federal University of Minas Gerais (Universidade Federal de Minas Gerais - UFMG), was used to analyze the translation and rotation movements of the monitoring standards; thus, the relative displacements could be determined. The captured images were synchronized with the measurements of the test machine. Next,
the results are presented and discussed.
4. Results and discussion
For each beam size presented in Table [1], three specimens were tested.
The load versus vertical displacement curves in the mid-span for the three tested sizes are grouped in Figure [7]. The vertical dis
-placement was measured at the underside of the beam. To observe the inluence of size on the beams’ structural properties, Figure [7] shows the experimental spectra obtained with the corresponding mean curve.
For B2 class beams, during the test performance period, the labo
-ratory went through a layout restructure that required moving the load application system, which created movement in the hoses
and a pressure difference in the actuator. Consequently, at the end of the softening of these curves, control was impossible because
of the disturbance that occurred in the loading rate due to the pres-sure relief in the actuator.
Figure 6 – Concrete beam surface prepared with grid marking and USB Microscope
Table 1 – Beam dimensions
Beam Total span – C
(mm)
Effective span – S (mm)
Thickness – B (mm)
Height – D (mm)
Notch – a0
(mm)
B1 380 320 80 80 32
B2 450 400 80 100 40
B3 700 600 80 150 60
4.1 Size effect on structural ductility
After calculating the areas under the load-displacement curves presented in Figure [7], the values of the work were obtained, which were equal to 302.5 Nmm, 425.2 Nmm, and 840.2 Nmm for beam sizes B1, B2, and B3, respectively. Using these values and Equation [2], the respective GF fracture energies were obtained,
as presented in Table [3]. An increase in the fracture energy with increases in the specimen size was observed. This fact was also observed by Nallathambi et al. [19] and Karihaloo [20], Gettu et al. [21], and Hillerborg [22] after performing more than 700 three-point lexural tests in beams. The fracture energy values found using DIC varied between 78 and 116 N/m. These results are extreme
-ly similar to those found by Nallathambi et al. [19] andKarihaloo [20], who determined using conventional methods that GF varies
between 40 and 130 N/m for samples with spans, heights, and notches equivalent to those presented in this study.
The reason why GF varies with specimen size is due to the hy
-pothesis proposed in Equation [2], where all work performed by the external load is completely reversed to the stable propagation of the crack. Figure [8] shows the variation in GF with the height of
the specimens (D); this representation is also in accordance with the results presented by Nallathambi et al. [19] andKarihaloo [20].
(2)
)
a
(D
B
=
Energy
0
curve
nt
displaceme
-load
under
Area
-×
posed by Carpinteri [23] and given by Equation [3].
(3)
D
f
S
t e
=
G
×
Fwhere ft is the concrete tensile strength, in this case ft = 2.93 MPa
according to Table [2].
The present tests indicate that Se is reduced as the beam height
increases, which indicates an increase in structural brittleness. The dimensional analysis used by Carpinteri [23] to deine Equa
-tion [3] was based on the physical difference of the two intrinsic properties of concrete, i.e., resistance and tenacity. Resistance is deined as the force per unit area or energy per unit volume, whereas tenacity is the energy per unit area. Hence, the energy
ratio (Se) presented includes a dimensional scale of the specimen (D) to generate a dimensionless number. This proposal is based on
the fact that what characterizes brittleness or ductility of a structure is not the individual values of GF and D but rather a dimensionless function (Se ). Following this reference, Karihallo [20] concludes
that the tendencies in the function of the notch size, height, and
free span can all be represented by Se and that as the beam’s height increases, Se decreases. This response obtained by con
-ventional methods to obtain the P-Delta curve is in accordance with the results obtained using DIC.
In the study by Karihallo [20], beams with heights varying between
100 and 300 mm resulted in Se varying between 8.359 x 10⁻⁴ and
2.09 x 10⁻⁴. For the present study, beams varying between 80 and
Table 2 – Mechanical parameters
of concrete
Parameter Mean
(MPa)
Standard deviation (MPa)
Coeff. of variation
(%)
Compressive
strength 35.43 3.73 10.53
Elastic
modulus 25982 1652 6.36
Tensile
strength 2.93 0.31 10.50
Table 3 – Fracture energy G
Fand brittleness
number (S
e)
Beam Height – D
(mm)
Area under the curve (N x mm)
Energy - GF
(N/m) Se
B1 80 302.5 78.64 3.35 x 10⁻⁴
B2 100 425.2 88.54 3.02 x 10⁻⁴
B3 150 840.2 116.7 2.66 x 10⁻⁴
Figure 8 – Variation in fracture energy (G )
F150 mm resulted in Se varying between 3.35 x 10⁻⁴ and 2.66 x 10⁻⁴.
Figure [7] also indicates that the longer the beam, the steeper the slope of the descending section of the trajectory is, which is a direct consequence of the size effect on structural ductility. To im
-prove the visualization of this effect and relate it to the brittleness
number (Se), Figure [9] presents the dimensionless conversion of
the curves in Figure [7]. For this purpose, the load values were divided by ft D², and the displacements were divided by 10³×D.
The smaller the beam’s characteristic dimension, the larger the displacements obtained were, which thus indicates a more duc
-tile behavior.
4.2 Size effect on nominal strength
When analyzing the variation in strength according to beam height,
the nominal stress (σN) applied to the beams were determined with
the expression deined by PLANAS et al. [24]. (Equation [4]).
(4)
2
2
3
D
B
S
P
N
×
×
×
×
=
s
where P is the applied load, S is the free span of the beam, B is the
section’s width, and D is the total height of the entire cross-section outside the notch section.
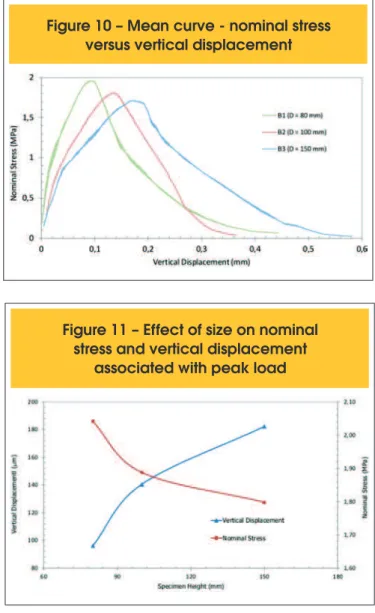
Figure [10] indicates that the behavior represented by the nomi
-nal stress versus vertical displacement curves is different for each beam size. In the pre-peak region, the vertical displacement is greater in beam B3 compared with that of beam B1 regardless of the nominal stress applied. This difference becomes more signii
-cant with load increase. This is most likely the result of the abso -lute length of the notch in B3 beams being larger than that in B1
beams. For the maximum load, a reduction in the nominal stress (nominal resistance) is observed with increases in the specimen size, which thus provides evidence for the size effect. After reach -ing the maximum load, there is a steep decline in displacement
Figure 9 – Dimensionless load versus
dimensionless displacement structural
response and brittleness number (S )
eFigure 10 – Mean curve - nominal stress
versus vertical displacement
in relation to the nominal stress. This decline is related to the fact that the damage is intensiied along the largest part of the beam’s section. At the tail of the curve, in the post-critical regimen, the ratio between the vertical displacement and nominal stress begins to exhibit approximately similar behavior for all beams, except for beam B2, which as previously mentioned, exhibited a disturbance
in the loading rate.
Figure [11] better demonstrates the size effect, which shows the variation in the vertical displacement and nominal stress in relation
to the maximum load for the three beam classes tested.
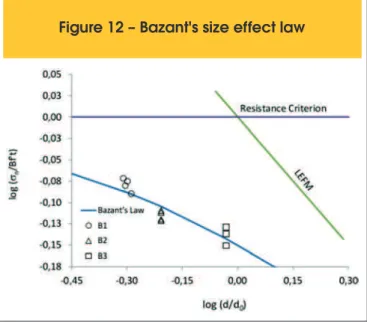
These data were also analyzed using Bazant’s size effect law (BA
-ZANT and PFEIFFER [25], BA-ZANT and PLANAS [26], RILEM 89-FMT [8]). According to this law, it is possible to characterize what type of fault theory should be applied to a structural project by considering the nominal fault stress (σN) and the characteristic
dimension of the structure (d0), which will be discussed next.
Because of the inluence of a relatively large zone of microis
-sures concentrated at the front of the concrete crack tip (Fracture Process Zone), the beam’s strength capacity, as measured by the
nominal fault stress, should be studied based on an intermediate
Figure 11 – Effect of size on nominal
stress and vertical displacement
criterion among the classical resistance criteria for concrete
struc-tures and linear elastic fracture mechanics (LEFM). Equation [5] expresses the size effect law proposed by Bazant [27], which de
-scribes the transition between these theories.
(5)
0
/
1
+
β
with
β
=
D
d
Bf
=
σ
tN
where ft is the material’s tensile strength, d0 is the material’s char-acteristic size that corresponds to the change of the mechanism
between the plasticity phenomenon and the fracture mechanics, B
is a parameter of the material, which is a function of the specimen’s geometry and of the load applied, and 1/b is the structural
brittle-ness number proposed by Bazant [25].
The values of Bft and d0 in Equation [5] are obtained by linear re
-gression according to Equation [6] and Equation [7].
(6)
C
AX
Y
=
+
where
(7)
A
C
d
C
Bf
Y
D
X
t N=
=
÷÷
ø
ö
çç
è
æ
=
=
,
s
1
,
1
,
0Table [4] presents the fracture parameters determined by the scale
effect method and the maximum tensile strengths obtained for beams B1, B2, and B3.
According to the method, d0 is the characteristic dimension of the
structure located in the point of transition between linear elastic fracture mechanics and the mechanical laws based on strength. In the present analysis, this value is larger than the heights of all specimens used, which thus indicates that a more ductile behavior should be expected for all beams. The brittleness number (Equa
-tion [5]) was found to be 0.50, 0.62, and 0.93 for beams B1, B2, and B3, respectively. Therefore, the specimens are at an interme
-diary stage between plastic behavior (β<< 0.1) and the transition state (β = 1). This type of behavior is desirable for concrete so it
can be used in civil construction.
The size effect curve proposed by Bazant [26] is presented in Figure [12], where the inluence on nominal strength for the three beam classes is observed. The size effect law, i.e., Equation [5],
generates a smooth transition between beams B1, B2, and B3, which indicates a good it of the results obtained.
5. Conclusion
In this study, an experimental investigation of the size effect using the digital image correlation technique was performed.
DIC was found to be an effective technique to determine displace
-ment ields on concrete surfaces with the advantage of not requir
-ing physical contact with the specimen’s surface.
This technique allowed observing the inluence of the size effect on the structural ductility of the beams. According to the calcula -tion of the beams’ brittleness number (Se) via an analysis of the
load versus vertical displacement curves, this number indicated
an increase in the structural brittleness of the beams as their sizes increased.
Additionally, it was observed that the nominal strength (maximum
nominal stress) of the notched concrete beams bent at three points
decreases with the increase in the respective characteristic dimen
-sion, as has been demonstrated in literature on this subject. Addi
-tionally, the experimental results were analyzed based on Bazant’s size effect law and were found to completely follow this law.
6. Bibliographical references
[1] GRIFFITH, A A., The phenomena of rupture and low in sol
-ids. Philosophical Transactions of the Royal Society of Lon
-don, v. A 221,1920, p. 163-198.
[2] KAPLAN, F. M., Crack propagation and the fracture of con
-crete. Journal of the American Concrete Institute, v. 58(11), 1961, p. 591-609.
[3] KANI, G., How safe are our large reinforced concrete beams. ACI Journal. v. 64, 1967, p. 128-141,
[4] GLUCKLICH, J., Fracture of plain concrete. Journal of the Engineering Mechanics Division (ASCE), v. 89, 1963, p. 127-138.
[5] HILLERBORG, A., MODEER, M. e PETERSSON, P. E.
Table 4 – Ultimate tensile strength
and fracture parameters
s
(MPa) do
(mm)
Bft (MPa)
B1 B2 B3
2.05 1.88 1.80 161.8 0.41
Analysis of crack formation and crack growth in concrete by
means of fracture mechanics and _nite elements. Cement
Concrete Research, v. 6, 1976, p. 773-782.
[6] BAZANT, Z. P. e CEDOLIN, L., Stability of Structures: Elas
-tic, Inelas-tic, Fracture and Damage Theories. Oxford Univer
-sity Press, New York, 1991.
[7] OZBOLT, J., ELIGEHAUSEN, R. e PETRANGELI, M., The size effect in concrete structure. E & FN Span, 1994, p. 255-268.
[8] RILEM 89-FMT, R. D. R. .-F., Size-effect methods for deter
-mining fracture energy and process zone size of concrete. Materials and Structure, v. 23,1990, p. 461-465.
[9] NGUYEN, T.L, HALL, S.A, VACHER, P, VIGGIANI, G. Frac
-ture mechanisms in soft rock: identiication and quantiication of evolving displacement discontinuities by extended digital image correlation. Tectonophysics, v.503, 2011, p.117-128. [10] RÉTHORÉ, J, TINNES, J.P, ROUX, S, BUFFIÈRE, J.Y,
HILD, F. Extended three-dimensional digital image correla -tion (x3d-dic). Comptes Rendus Mécanique v. 336(8), 2008,
p.643-649.
[11] ALAM, S.Y. Experimental study and numerical analysis of crack openings in concrete. PhD thesis, Ecole Centrale de Nantes; 2011.
[12] SKARŻYŃSKI, Ł.; SYROKA, E.; TEJCHMAN, J. Measure
-ments and Calculations of the Width of the Fracture Process Zones on the Surface of Notched Concrete Beams. Strain, v. 47, 2011, p. 319-332.
[13] SUTTON, M. A.; McNEILL, S. R.; HELM, J. D.; CHAO, Y. J. Advances in two-dimensional and three-dimensional com
-puter vision. Top. Appl Phys, v. 77, 2000, p.323-372. [14] PAN, B., QUIAN, K., XIE, H. e ASUNDI, A., “Two-dimension
-al digit-al image correlation for in-plane displacement and
strain measurement: a review.” Measurement Science and Technology, v. 20, 2009, p. 1-17.
[15] ISO/TC42N 4378, Photography-Electronic Still Picture Im
-aging-Removable Memory-Part 2: Image Data Format-TIFF/ EP, Nov. 25, 1998.
[16] ASSOCIAÇÃO BRASILEIRA DE NORMAS TÉCNICAS. Concreto - Ensaios de compressão de corpos-de-prova cilíndricos – Métodos de ensaio. NBR 5739, Rio de Janeiro, 2007.
[17] ASSOCIAÇÃO BRASILEIRA DE NORMAS TÉCNICAS. Concreto - Determinação do módulo estático de elasticidade à compressão. NBR 8522, Rio de Janeiro, 2008.
[18] ASSOCIAÇÃO BRASILEIRA DE NORMAS TÉCNICAS. Concreto e argamassa – Determinação da resistência à tra
-ção por compressão diametral de corpos-de-prova cilíndri
-cos. NBR 7222, Rio de Janeiro,2011.
[19] KARIHALLO, B. L.; Fracture Mechanics and Structural Con
-crete. Longman Scientiic & Technical, New York. 1995 [20] NALLATHAMBI, P.; KARIHALLO, B. L. and HEATON, B.S.
Effect of specimen and crack size, water/cement ratio and
coarse aggregate texture upon fracture toughness of
con-crete, Mag Concr Res, vol. 36, p.227-236
[21] GETTU, T; BAZANT, Z, P. and KARR, M.E; Fracture proper -ties and brittleness of high strength concrete, ACI Mater J.
vol. 87, p.608-618
[22] HILLERBORG, A. Inluence of beam size on concrete frac
-ture energy determined according to a draft RILEM recom
-mendation, Report TVBM-3201, Div Bldg Mater Lund Inst Tech, Sweden.
[23] CARPINTERI, A. Notch sensitivity in fracture testing of ag
-gregative materials. Journal Engineering Fracture Mechani
-cal, vol. 16, 1982, p. 467-481
[24] PLANAS, J., GUINEA, G. V. e ELICES, M., Size effect and inverse analysis in concrete fracture. International Journal of Fracture, v. 95, 1999, p. 367-378.
[25] BAZANT, Z. P. e PFEIFFER, P., Determination of fracture energy from size effect and brittleness number. ACI Materi
-als Journal, vol. 84, 1987, p. 463-480.
[26] BAZANT, Z. P. e PLANAS, J. Fracture and Size Effect in Concrete and Other Quasi-Brittle Materials. CRC Press, New York. 1998.
[27] BAZANT, Z. P. Size Effect in blunt fracture: concrete, rock, metal. ASCE Journal Engineering Mechanics, vol. 110,