Abstract
Elastomeric materials are used as shock isolation materials in a variety of environments to dampen vibrations and/or absorb energy from external impact for minimizing energy transfer between two objects or bodies. Some applications require the shock isolation materials to behave as a low-pass mechanical filter to mitigate the shock/impact at high frequencies but transmit the energy at low frequencies with minimal attenuation. In order to fulfill this re-quirement, a shock isolation material needs to be carefully evaluat-ed and selectevaluat-ed with proper experimental design, procevaluat-edures, and analyses. In this study, a Kolsky bar was modified with pre-compression (up to 15.5 kN) and confinement capabilities to evalu-ate low-pass shock isolation performance in terms of acceleration attenuation through a variety of elastomers. The effects of preload and specimen geometry on the low-pass shock isolation response were also investigated.
Keywords
Shock isolation, frequency response, Kolsky bar, rubbers, EPDM, polyurethane, neoprene
Experimental Evaluation of Low-Pass Shock Isolation Performance
of Elastomers Using Frequency-Based Kolsky Bar Analyses
1 INTRODUCTION
Shock isolation is an essential concept in component design to mitigate or isolate external shock/impact energy from internal sensitive sub-component devices. Appropriate materials or sys-tems need to be carefully designed or selected for effective and efficient shock isolation. An excellent shock isolation material should be capable of absorbing external shock/impact energy and attenuat-ing acceleration when subjected to impact/shock loadattenuat-ing. While a variety of materials such as glass microbeads can be used for shock isolation (Yoon and Kim 2006), elastomers have been widely used as shock isolation materials due to their superior flexibility associated with excellent energy absorp-tion and vibraabsorp-tion damping capabilities. However, the shock isolaabsorp-tion performance of elastomers
Brett Sanborn a Bo Song a Erik Nishida a Marlene Knight a
a Sandia National Laboratories,
Albuquerque, NM 87185, USA.
[email protected], [email protected], [email protected], [email protected]
http://dx.doi.org/10.1590/1679-78253268
varies in applications depending on intrinsic mechanical properties, geometries, dimensions, assem-bly process, and specific requirements. One example requirement may refer to frequencies. In most applications, high frequencies, which are a typical phenomena in shock or impact environments (La-lanne 2009), are unfavorable and need to be mitigated in order to protect sensitive components. When a shock isolation material is applied to mitigate the high frequencies, the low frequencies are dampened as well such that the internal components or sensors are not isolated too much to cor-rectly sense and respond to actual shock or impact loading. In such specific applications, the shock isolation materials are desired to isolate high frequencies only but allow low frequencies to pass through with minimal attenuation.
Effectiveness of elastomers as mechanical low-pass filters has been investigated extensively as shock isolators for accelerometers. In one application, a polymer material was chosen as a low-pass isolation material to protect accelerometers up to a frequency of 15 kHz (Chu 1988). In another scheme, Bateman et al. (Bateman et al. 1990) installed an accelerometer between two polysulfide rubber pads in an attempt to retain accelerometer fidelity up to 10 kHz and tried to prevent high frequencies above 10 kHz from reaching the accelerometer. Yiannakopoulos and van der Schaaf (Yiannakopoulos and van der Schaaf 1998) evaluated a mix of commercially available and novel arrangements to protect piezoresistive and piezoelectric accelerometers using silicone, butyl, and bromo-butyl rubber from frequencies ranging between 8-10 kHz. The deformation, strain rate, and frequencies which the materials are subjected to in conventional DMA or vibration methods are significantly lower than those in shock or impact environments. Therefore, a new low-pass experi-mental evaluation method needs to be developed to subject the material to larger deformation, higher strain rates and frequencies.
Elastomers used in shock or vibration isolators are routinely confined and subjected to preload during assembly process. The confinement subjects the elastomers to multiple stress states or a nearly uniaxial strain state. The dynamic responses of foam materials and elastomers, typically used for shock or impact isolation applications, have been found drastically different when the state changes from uniaxial stress to unaxial strain (Song and Chen 2004, Song et al. 2005). Such me-chanical property changes are expected to change the shock or impact isolation performance (Nelson 1996). In addition, due to nonlinear mechanical response, the preload changes the initial stress state of the elastomers and consequently influences their shock or impact isolation performance (Thorin et al. 2012) in applications ranging from the electronics industry to protect computer hard drives (Park et al. 2012) to automotive industry engine mounts (Cardillo 1964) to civil structural applica-tions for seismic isolation of buildings (Zou et al. 2011).
shock mitigation capability: nearly all shock energy at frequencies higher than 1.5 kHz was ab-sorbed. Shock energies at frequencies lower than 1.5 kHz were also absorbed; however, the energy dissipation below 1.5 kHz was diminished to about 80%, which indicates that about 20% of the energy below 1.5 kHz is transmitted through the material. Such an amount of energy dissipation resulted in significant attenuation of transmitted acceleration from low to high frequencies. In an-other study, silicone foam was subjected to small amounts of pre-strain and the energy dissipation behavior in the frequency domain was investigated (Sanborn et al. 2016). For the silicone foam, all of the impact energy was absorbed across the entire frequency range. Therefore, both PMDI and silicone foams have been demonstrated to be capable of mitigating shock or impact energy but not good candidates for low-pass shock isolation applications.
In this study, a pre-compression load capability up to 15.5 kN was developed for a Kolsky com-pression bar for low-pass shock isolation performance evaluation of three different elastomers pas-sively confined with a snug-fit tube. A previously developed (Song and Nelson 2015) frequency-based analysis on Kolsky bar experiments was used to analyze the low-pass shock isolation re-sponse, in terms of transmitted accelerations, of a variety of elastomers with different geometrical and loading conditions.
2 MATERIALS AND SPECIMENS
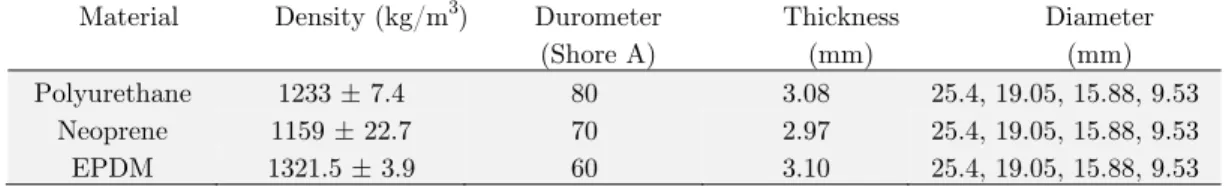
In this study, polyurethane, neoprene, and ethylene propylene diene monomer (EPDM) with differ-ent hardness were characterized and evaluated for low-pass shock isolation performance. The mate-rial and specimen information used in this study is summarized in Table 1. The Shore A durometer of polyurethane, neoprene, and EPDM, were 80A, 70A, and 60A, and had densities of 1233 ± 7.37 kg/m3, 1159 ± 22.7 kg/m3, 1321.5 ± 3.9 kg/m3, respectively. Each material was made into cylindri-cal specimens with different diameters of 25.4 mm (the same diameter as the pressure bars), 19.05 mm, 15.88 mm, and 9.53 mm. Specimen thickness for polyurethane, neoprene, and EPDM were 3.08 mm, 2.97 mm, and 3.10 mm, respectively.
Material Density (kg/m3) Durometer
(Shore A)
Thickness (mm)
Diameter (mm)
Polyurethane 1233 ± 7.4 80 3.08 25.4, 19.05, 15.88, 9.53
Neoprene 1159 ± 22.7 70 2.97 25.4, 19.05, 15.88, 9.53
EPDM 1321.5 ± 3.9 60 3.10 25.4, 19.05, 15.88, 9.53
Table 1: Materials and specimen geometries.
For Neoprene and EPDM rubber, one experiment at each diameter was conducted. To check repeatability of the acceleration transmission behavior for polyurethane rubber, two experiments at each diameter were conducted.
3 EXPERIMENTAL SETUP
bar. When the stress pulse arrives at the specimen sandwiched between the incident and transmis-sion bars, part of the incident pulse is reflected back into the incident bar and the rest transmits through the specimen into the transmission bar. Strain gages mounted on the incident and trans-mission bars are used to provide the time domain load and deformation histories from which the frequency domain behavior can be derived through Fourier transform. The strain gage signal was acquired with a Teledyne LeCroy HDO8058 high definition oscilloscope at a sampling rate of 50 MHz.
The incident bar used in this study was 3657 mm long while the transmission bar was 2134 mm long. Incident and transmission strain gages were located 1915 mm and 762 mm from the gage sec-tion, respectively. The bar material is C300 maraging steel that had a Young’s modulus of approx-imately 190 GPa and elastic wave speed of 4870 m/s. In addition, the Kolsky compression bar was modified to accommodate pre-compression capabilities up to 15.5 kN to investigate the effect of preload on the shock isolation response of different materials. A hydraulic jack was applied to the free end of the transmission bar to facilitate a preload of up to 15.5 kN on the system, as shown in Fig. 1. While hydraulic jacks have been used to generate impact in previous studies (Zhao and Gary 1997, Othman and Gary 2007), the goal in the present study is to facilitate a static preload. As shown in the schematic in Fig. 1, a reaction plate and platen were placed at the impact end of the compression bar to prevent the system from moving toward the striker when the hydraulic pressure is applied to the transmission bar end. Four tie rods, which prevent any buckling in the bars (Frew et al. 2010), were connected between the reaction plate and jack fixture to accommodate the pre-compression load from possible buckling of the bars and fixtures when subjected to such a high-amplitude preload. The platen at the impact end is free to move in the impact direction but pre-vents the incident bar from moving away from the jack (the opposite direction to the impact), simi-lar to the setup described by Chen and Song (Chen and Song 2010) for high triaxial loads. This configuration allows the bar system to move only along the dynamic loading direction. In this study, the bar system including the specimen was subjected to a static pre-compression load of 15.5 kN (3500 lbf) before dynamic loading.
Figure 1: Modified compression setup schematic.
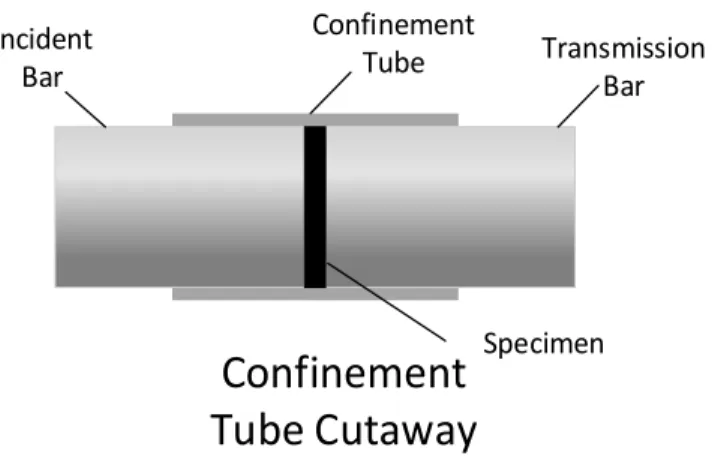
confinement tube was slid over the specimen as shown in Fig. 2. The 4340 steel tube that confined the specimen in the radial direction had dimensions of 31.8 mm for the outer diameter, 25.5 mm for the inner diameter, and a length of 50.83 mm. After the specimen was placed between the bars and the confinement tube was slid over the specimen, the preload was applied and the load of 15.5 kN was verified using the strain gage measurements on the pressure bars. In general, a couple of minutes spanned between application of the static pre-compression load and dynamic loading. No creep of the sample was observed between the preload and dynamic loading. The pre-compression strain generated in the specimen subjected to static pre-compression load was not directly meas-ured. However, it is imagined the pre-compression strain varied with different specimen material and diameter. The varying pre-compression strains are expected to result in different low-pass shock isolation performance, due to nonlinear rate-dependent stress-strain response of elastomers (Song and Chen 2003, Song and Chen 2004).
I ide t
Bar Tra s issio Bar
Co fi e e t
Tu e Cutaway
Co fi e e tTu e
Spe i e
Figure 2: Schematic of specimen under triaxial confinement inside the steel tube.
.
.
. .
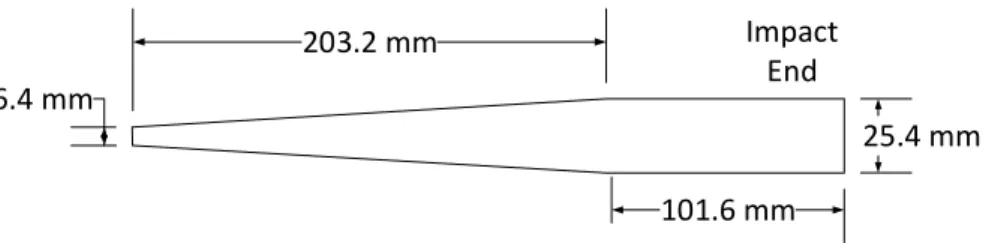
I pa t E d
Figure 3: Sketch of the tapered striker.
Based on the incident, reflected, and transmitted time-domain strain pulses, the acceleration applied to the specimen can be used to evaluate the shock isolation potential of a material. The input acceleration is calculated using (Song and Nelson 2015) the input velocity, Vinput
(1)
where and are the incident and reflected strain pulses, respectively; and are the corresponding acceleration time histories, respectively; and is the wave speed of the bar material. The corresponding output acceleration is calculated using the transmitted velocity, Vt, as
(2)
where is the transmitted strain pulse and is the transmitted acceleration time history. It is noted here that equations (1) and (2) can be used with or without static preload. Each time-domain acceleration history a(t) derived from each of the signals has a Fourier transform
(3)
where is the frequency. Thus, the acceleration transmission ratio, , through the specimen can be calculated using the frequency spectra of the input and output accelerations as
| |
| | (4)
This represents the acceleration transmission through the sample as a function of frequency. Although differentiating to calculate the acceleration can generate noise in the signal, such noise is at a high frequency which is well above 500 kHz (Song and Nelson 2015), so any noise generated through differentiation calculation should not affect our investigation. In addition, the wave disper-sion correction is not necessary to considered when conducting frequency-domain analysis (Eq. (4)) (Song and Nelson 2015).
4 RESULTS AND DISCUSSION
that, upon impact of the striker and after the unloading portion of the incident pulse, the incident signal approaches a negative value, corresponding to tension in the incident bar. Figure 4 shows a plot of the original strain signals collected, in this study, during a dynamic experiment on polyure-thane rubber preloaded to 15.5 kN, where the striker speed was 13 m/s. Since a static pre-compression load of 15.5 kN was applied to the system to compress the specimen prior to dynamic loading, and taking compression to be positive, the incident and transmission bar strain gages would have a positive offset of approximately 170 microstrain after the pre-compression load phase of the experiment. However, the incident and transmission bar strain gages were set to zero follow-ing the application of the preload. Figure 4 shows that the incident pulse approaches a negative value after unloading. This apparent “negative” behavior in the incident pulse was caused by the incident bar losing the static axial load after the striker impact occurred due to the transfer of the free boundary condition from the free end of the striker to the incident bar. The transmitted pulse is apparently not affected by the loss in preload force as the baseline of the transmitted pulse in Fig. 4 remains at zero prior to the arrival of the pulse. According to Fig. 4, the preload on the inci-dent bar resumes at a time of 400 µs since the baseline of the inciinci-dent pulse returns to zero at that time. This is caused by the release of previously stored energy by static pre-compression load. The unloading of the first dynamic compressive loading released the dynamic compressive energy only but left a temporary free boundary condition at the impact end. Therefore, the previously stored static compression energy moves the incident bar back to make the platen contact with the load reaction plate again. This means that the system was recovered back to original static pre-compression status, moving the baseline back to zero. In order to demonstrate the effect of preload on the incident pulse, a comparison of time-domain incident pulses generated by the same tapered striker but at 0 and 15.5 kN preloads was performed and shown in Fig. 5. Figure 5 clearly shows that, though the rise time and peak strain of the incident pulses are identical and follow nearly the same unloading behavior until about 125 µs, when the incident pulse from the preloaded experiment becomes negative due to the preload in the system.
Figure 5: Incident pulses generated using the tapered striker for non-preloaded and preloaded experiments.
It is noted that the constant quasi-static pre-compression load offsets the baseline of the bar strain signals, which represent the velocity histories associated with the incident and reflected puls-es. However, the constant offset in the particle velocities should not influence the incident and re-flected acceleration histories through differentiation.
The input and output accelerations in the time domain through a polyurethane specimen were calculated using Equations (1) and (2) and are shown in Fig. 6. In the time domain, the input ac-celeration had a peak value of 450,000 G while the output acac-celeration had peak amplitude of 180,000 G, indicating that the polyurethane material transmitted 40% of the acceleration. It should be noted that wave dispersion occurs in the time-domain acceleration calculations. However, the effect of wave dispersion will be eliminated in the frequency domain analysis.
Figure 6: Input and output accelerations through a polyurethane specimen.
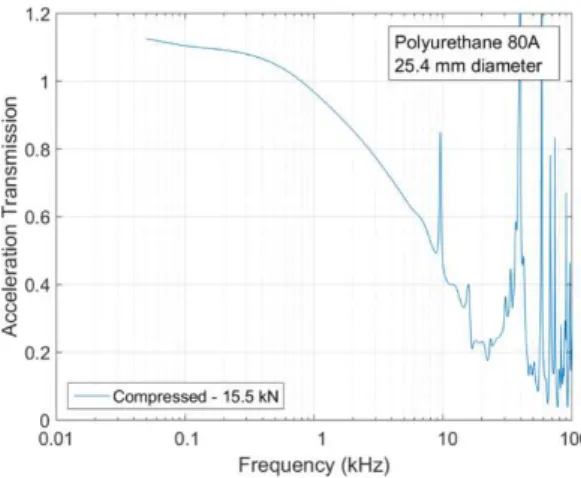
polyu-rethane 80A experiment shown in Fig. 7, the output acceleration is very close but slightly higher than the input acceleration at the frequencies below 0.6 kHz, which is zoomed in and shown in Fig. 7b. This generates an acceleration transmission coefficient above 1 at low frequencies, as shown in Fig. 8. In this case, the polyurethane 80A specimen was stiffened due to the high amplitude (15.5 kN) of the pre-compression load before dynamic loading. This highly stiffened specimen may gener-ate a high amplitude of recovery force when the specimen is unloaded. The unloading/recovery force therefore pushed the incident and transmission bars away, which decelerated the incident bar end but further accelerated the transmission bar. This will possibly result in higher amplitude of output acceleration than input acceleration, and consequently an acceleration transmission factor greater than 1. However, the greater acceleration transmission factor does not contribute to all frequencies uniformly. The output acceleration transmission factor becomes higher than the input at low fre-quencies (below 0.6 kHz) only. At high frefre-quencies, the polyurethane 80A rubber dampened the acceleration, even though it was significantly stiffened before dynamic loading. Thus, it is shown in Fig. 7a that past a frequency of 0.6 kHz, the input acceleration is higher than the output accelera-tion.
Figure 7a: Input and output acceleration transmission behavior in the frequency domain.
Figure 8: Acceleration transmission behavior of polyurethane pre-compressed to 15.5 kN.
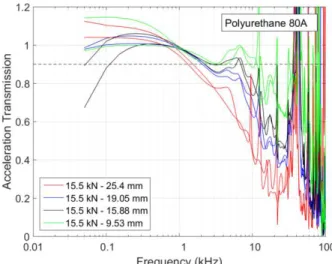
Figure 9: Acceleration transmission behavior of polyurethane rubber at different initial diameters preloaded to 15.5 kN prior to dynamic loading. Two experiments were conducted for each diameter to show repeatability.
The dashed line represents the low-pass cutoff acceleration transmission of 90% defined for this study.
EPDM rubber shows a similar trend in acceleration transmission behavior with diameters under the same preload conditions. Figure 10 shows the results of acceleration transmission for the EPDM rubber specimens with different diameters, but subjected to the same pre-compression load of 15.5 kN. Similar to the polyurethane 80A rubber, the EPDM rubber had almost full acceleration trans-mission up to a frequency of 1 kHz, regardless of the specimen diameter. The acceleration transmis-sion of EPDM rubber begins to fall off when the frequency becomes higher. The low-pass frequen-cies with the acceptance level of 90% acceleration transmission for the EPDM 60A rubber are 1.5 kHz for the 25.4-mm-diameter sample, 2.1 kHz for the 19.05-mm-diameter sample, 2.4 kHz for the 15.88-mm-diameter sample, and 2.55 kHz for the 9.53-mm-diameter sample, respectively. The effect of specimen diameter on the low-pass frequency for the EPDM 60A rubber is not as significant as that for the polyurethane 80A rubber. It should be noted that the acceleration transmission for the 9.53 mm dropped below the 90% threshold and then increased to above 90%, only to decrease again below the threshold at about 8 kHz. In this case, the first crossing of the 90% threshold was taken to be the cutoff. In other applications, the threshold could be set at a different level.
Figure 10: EPDM rubber acceleration transmission behavior as a function of specimen diameter under a preload of 15.5 kN. The dashed line represents the low-pass cutoff acceleration transmission of 90% defined for this study.
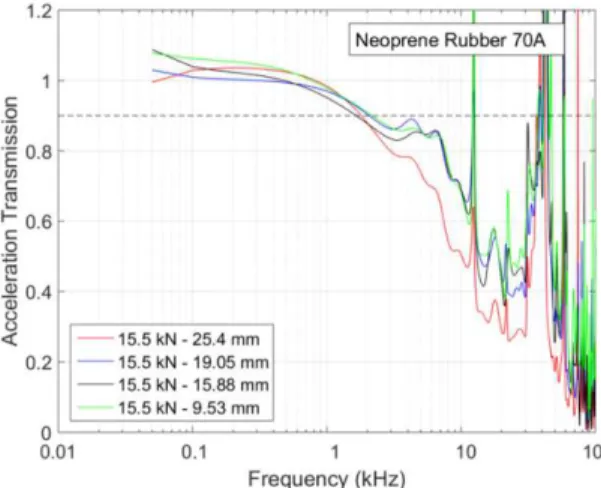
Figure 11: Acceleration transmission response of neoprene rubber at different diameters. The dashed
line represents the low-pass cutoff acceleration transmission of 90% defined for this study.
Figure 12: Effect of specimen diameter on low-pass cutoff frequency.
In order to understand the effect of intrinsic stress-strain response on the low-pass frequency with respect to acceleration transmission, future work must be conducted to characterize the dy-namic stress-strain response under different loading rates and stress states for the materials present-ed here. For example, the compressive stress-strain curves of the materials with and without con-finement would be required to understand the transition from uniaxial stress and triaxial stress state, the nonlinear hardening state of the materials during pre-compression load, and the high-rate triaxial hardening behavior, including dynamic bulk and shear moduli, of the materials during im-pact loading. Since the mechanical response of rubbers is highly temperature dependent, experi-ments over a wide range of temperatures may be needed to describe the low-pass frequency response of elastomers for different environmental applications.
5 CONCLUSIONS
The results presented here for the polyurethane 80A, neoprene 70A, and EPDM 60A rubbers are only applicable for the specific preload, specimen thickness, diameter, and striker velocity of 13 m/s.
Acknowledgments
Sandia National Laboratories is a multi-program laboratory managed and operated by Sandia Cor-poration, a wholly owned subsidiary of Lockheed Martin CorCor-poration, for the U.S. Department of Energy's National Nuclear Security Administration under contract DE-AC04-94AL85000.
References
Bateman, V.I., Bell, R.G., Brown, F.A., Davie, N.T, M.A. Nusser, (1990). Evaluation of uniaxial and triaxial shock isolation techniques for a piezoresistive accelerometer,” SAND90-1579C.
Cardillo, R.M., (1964). Dynamic testing of elastomer mountings, Journal of Applied Polymer Science 8: 53-71. Chen, W. and Song, B., (2011). Split Hopkinson (Kolsky) bar. Design, testing and applications. Springer (New York).
Chu, A.S., (1988), Built-in mechanical filter in a shock accelerometer, 59th Shock and Vibration Symposium. SAND88-2473C.
DeMarco, A.L., Chimich, D.D., Gardiner, J.C., Nightingale, R.W., Siegmund, G.P. (2010) The impact response of motorcycle helmets at different impact severities, Accident Analysis and Prevention 42: 1778-1784.
Frew, D.J., Akers, S.A., Chen, W., Green, M.L., (2010). Development of a dynamic triaxial Kolsky bar, Measure-ment Science and Technology 21(10): 1-10.
Kobayashi, H., Daimaruya, M., Nojima, T., Kajino, T., (2000). Effect of strain rate change during uniaxial dynamic tensile tests on instability strain, Journal de Physique IV 10: 433–438.
Kumar, A., Lok, T.S., and Pengjun, Z., (2004). Design of an impact striker for a split Hopkinson pressure bar, Jour-nal of the Institution of Engineers, Singapore 4:119–130.
Lalanne, C., (2009), Mechanical Vibration and Shock Analysis, Wiley-ISTE.
Landro, L.D., Sala, G. Olivieri, D., (2002). Deformation mechanisms and energy absorption of polystyrene foams for protective helmets, Polymer Testing 21:217-228.
Li, X.B, Lok, T.S., Zhao, J. and Zhao, P.J., (2000). Oscillation elimination in the Hopkinson bar apparatus and resultant complete dynamic stress-strain curves for rocks, International Journal of Rock Mechanics & Mining Sci-ence, 37: 1055-1060.
Mercer, C.A. and Rees, P.L. (1971). An optimum shock isolator, Journal of Sound and Vibration, 18(4): 511-520. Nelson, F.C., (1996). Vibration Isolation review: II. Shock Excitation, Shock and Vibration, 3(6); 451-459.
Othman, R. and Gary, G., (2007). Testing aluminum alloy from quasi-static to dynamic strain rates with a modified split Hopkinson bar method, Experimental Mechanics 47:295-299.
Park, K.S., Lim, S., Park, Y.P., Chang, Y.B., Park, N.C., (2012). Shock and vibration isolation of laptop hard disk drive using rubber mount, Microsystems Technology 18:1559-1566.
Sanborn, B., Song, B., Smith, S., (2016). Pre-strain effect on frequency-based impact energy dissipation through a silicone foam pad for shock mitigation, Journal of Dynamic Behavior of Materials 2:138-145.
Song, B. and Chen, W., (2004). Dynamic compressive behavior of EPDM rubber under nearly uniaxial strain condi-tions, Journal of Engineering Materials and Technology 126: 213-217.
Song, B., and Chen, W., (2003). Dynamic compressive constitutive behavior of EPDM rubber, Transactions of the ASME, Journal of Engineering Materials and Technology, 125: 294-301.
Song, B., Chen, W., Yanagita, T., Frew, D.J., (2005). Confinement effects on the dynamic compressive properties of an epoxy syntactic foam, Composite Structures 67: 279-287.
Song, B., Connelly, K., Korellis, J., Lu, W.Y., Antoun, B.R., (2009). Improved Kolsky-bar design for mechanical characterization of materials at high strain rates, Measurement Science and Technology, 20:1-8.
Thorin, A., Azoug, A., Constantinescu, A., (2012). Influence of prestrain on mechanical properties of highly filled elastomers: measurement and modeling, Polymer Testing 31:978-986.
Yiannakopoulos, G and van der Schaaf P.J., (1998). Evaluation of accelerometer mechanical filters on submerged cylinders near an underwater explosion, Shock and Vibration 5: 255-265.
Yoon, S.H. and Kim, K.L., (2006). Passive low pass filtering effect of mechanical vibrations by a granular bed com-posed of microglass beads, Applied Physics Letters 89: 021906.
Zhao, H. and Gary, G., (1997). A new method for the separation of waves. Application to the SHPB technique for an unlimited duration of measurement, Journal of the Mechanical Physics of Solids, 45(7): 1184-1202.
Zhou, X.Y., Xia, K., Li, X.B., Li, H.B., Ma, G.W., Zhao, J., Zhou, Z.L., Dai, F., (2012) Suggested methods for de-termining the dynamic strength parameters and mode-I fracture toughness of rock materials, International Journal of Rock Mechanics & Mining Science, 49: 105-112.
Zou, L., Huang, K., Zhang, W., Rao, Y., Wang, L., (2011). Prestress rubber isolator and its mechanical properties,