Advances in Mechanical Engineering 1–8
ÓThe Author(s) 2015 DOI: 10.1177/1687814015572465 aime.sagepub.com
Dynamic design of stiffeners for a
typical panel using topology
optimization and finite element
analysis
Yadong Zhou and Qingguo Fei
Abstract
The design of stiffeners is an effective approach to enhance the stiffness of panel-type structures. However, the stiffness– mass efficiency depends largely on the spacing, orientation, and cross-section of the stiffeners. In order to improve the stiffness–mass efficiency, this article presents a combined use of topology optimization and finite element analysis to the dynamic design of stiffeners for a typical panel. Finite element models of a flat and a stiffened rectangular panel were con-structed. Modal analysis was conducted on the two panels to obtain the basic dynamic properties. Topology optimization model of the stiffened panel, so-called initial structure, was built based on the variable density method. According to the loading case and the predominant mode of the system, the objective function was determined to maximize the funda-mental frequency of the panel. The stiffeners were chosen as the design domain. Optimal material density distributions of the stiffeners were obtained at different mass fraction. The finite element model of the optimal stiffened panel was built to reanalyze the dynamic properties and responses. An increase in the relative rate of change in the fundamental frequency versus mass was observed between before and after the optimization.
Keywords
Dynamic design, stiffened panel, topology optimization, finite element analysis
Date received: 19 September 2014; accepted: 26 December 2014
Academic Editor: Weidong Zhu
Introduction
Skin-panels are widely used on the flight vehicle struc-ture, for example, the airfoil, rudder, and cabin, due to their light weight, fine aerodynamic configuration, and high structural efficiency. However, these structures are characterized by low normal stiffness. The skin-panel surfaces of hypersonic flight vehicles are exposed to severe aerodynamic, acoustic, and thermal loading in service.1,2 These dynamic loadings cover a large range of exciting frequencies, which can include one or more natural frequencies of the panel-type structures. It is difficult to avoid resonance for the structures of aircraft fuselage, thin skins, and stiffened panels. Excessive
dynamic responses of skin-panels may occur due to the inadequate normal stiffness of the structures and severe vibro-acoustic loading. The resonant effect can produce cyclic stress, resulting in fatigue damage and cracks in the structures. Thus, structural integrity may be dis-rupted by the alternating stress induced by these
Jiangsu Key Laboratory of Engineering Mechanics, Department of Engineering Mechanics, Southeast University, Nanjing, China
Corresponding author:
Qingguo Fei, Jiangsu Key Laboratory of Engineering Mechanics, Department of Engineering Mechanics, Southeast University, Nanjing 210096, China.
Email: [email protected]
flight vehicles.
Dynamic optimization design has achieved rapid development and wide application with the progress of the finite element method (FEM) and software. A rela-tively extensive attention was paid to the following two topics with respect to optimizing the dynamic proper-ties of panel-type structures. One is the topology opti-mization of the eigenvalues of the flat plate. The design domain was specified as the plate itself, and the optimi-zation results are usually an irregular plate with void domains. For example, Pedersen6used topology opti-mization to optimize the eigenvalues of a plate, which itself was chosen as the design domain. Pagnacco et al.7 concerned the optimization of linear two-dimensional (2D) planar metallic structures subjected to stationary Gaussian random loading. In order to maximize the nonfailure probability, the thicknesses of the 2D ele-ments were considered as the design variables for redis-tributing the amount of the material. Yoon8 used model reduction schemes to calculate dynamic responses and sensitivity values with adequate effi-ciency and accuracy for topology optimization in the frequency domain, taking a plane structure as an exam-ple. Another hot topic is concerning the composite panel. Due to the designability of the ply angles and local thickness, the lamination parameters are widely used to optimize the dynamic properties. Variable thickness and variable stiffness were studied to maxi-mize the natural frequencies.9,10 All these researches made great contributions to the design of panel-type structures and provided the engineers with excellent references for the design and manufacture of new panel structures.
For some occasions, neither designing the thickness of the plate only nor optimizing the topology shape of the plate itself with void areas left after the optimization can meet the requirements of dynamic design, for exam-ple, the thermal protection system (TPS) of the hyperso-nic flight vehicle. The TPS panels should integrate the functions of heat shielding, bearing loads, weight reduc-tion, and so on. For such cases, stiffeners are often used to improve the normal stiffness. The common forms of
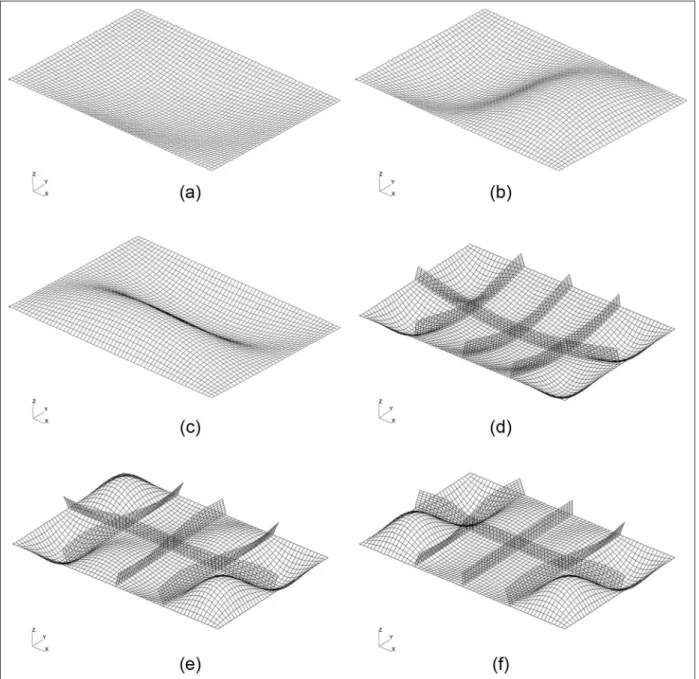
The in-plane size of the flat panel is 600 mm 3 400 mm, with the thickness of 3 mm. The initial form of the stiffeners was based on one of the most common layouts, with three short-edge stiffeners and one long-edge stiffener. And, all the cross-sections were assumed to be identical, with 4 mm width and 30 mm height. It is because the attention was fixed on the layout and form of the stiffeners, rather than on the cross sections. The FE model was built using the commercial software MSC Patran. The thin plate was modeled using CQUAD4 element (a 4-node, 2D shell element with 5 degrees of freedom per node, that is, three translational and two rotational). A total of 2400 elements and 2501 nodes were used for the flat panel, as shown in Figure 1(a). The stiffened panel was also built using the CQUAD4 element and consists of 3840 elements and 3949 nodes, as shown in Figure 1(b). The boundary conditions of the two panels are restricting the three translational degrees of freedom of the nodes at four edges, that is, simply supported constraints. Young’s modulus of the linear elastic material isE= 108 GPa, the Poisson ratio is m= 0.34, and the density is r= 4.5 3 103kg/m3.
Lanczos method was chosen in modal analysis, for it does not miss roots and has high efficiency. The mass normalization was applied in eigenvector normaliza-tion, which scales each eigenvector to result in a unit value of generalized mass. The results of natural fre-quency from modal analysis of the structures are shown in Table 1, together with a few of the mode shapes depicted in Figure 2.
Figure 1. FE model of the (a) flat panel and (b) stiffened panel.
The first step of optimization design is formulating the engineering problems to mathematical expressions, which search for optimization objective. An optimiza-tion problem in mathematics can be described as
min f(x) ,x= (x1,x2,
. . .,xn)
T, x2E
n
s:t: gj(x)0 (j=1,2,. . .,m)
hk(x) =0 (k=1,2,. . .,p)
ð1Þ
wherexis an-dimensional vector composed of a set of variables, called design variables; f(x) is the optimiza-tion objective; and gj(x) and hk(x) are the inequality constraints and equality constraints, respectively. The number of design variables nand the number of con-straintsmandpare independent of each other.
There mainly exist the homogenization method,11 the variable density method,12 the evolutionary struc-tural optimization method,13and the level set method14 for continuum topology optimization. Among them, the variable density method is characterized by simpli-city in concept and high efficiency of optimization, whose basic idea is to consider the material density as a variable and to assume a corresponding relationship between the density and Young’s modulus of the mate-rial. Young’s modulus and density are used as inter-mediate variables of each element designed, while the actual design variablexis the normalized density.
The classic interpolation scheme for variable density method consists of the solid isotropic microstructures with penalization (SIMP) model15 and the rational approximation of material properties (RAMP) model.16 The SIMP model has experienced popularity because of its conceptual simplicity and implementation easiness. As an extension of the homogenization method, the SIMP model is to relax the original 0 (void) and 1 (solid) discrete optimization to an optimization with continuous design variables from 0 to 1. Such a relaxa-tion will allow the design variables having intermediate densities, and then, a ‘‘power-law’’ penalty is applied to push the relaxed design close to the discrete 0 and 1 bounds. Taking the normalized density of an element as the design variablexi(i= 1, 2, ...,n), the interpolation schemes of the structural density (mass density)riand
that it could be negligible. Thus, equation (3) can be simplified to
Ei(xi) =xPiE0 ð4Þ
As for panel-like structures, a review conducted by Cunningham and White17indicates that the major part of the dynamic responses depend on the contribution of the first mode, the so-called predominant mode. This theory is still used as a design tool for panel structures subjected to random pressure loading, and the agree-ment with experiagree-mental measureagree-ments is satisfactory. Thus, in order to suppress the dynamic response, the objective function was selected to maximize the first modal frequency. Not considering the damping, the mathematical model of the topology optimization max-imizing the fundamental frequency subject to the vol-ume constraint is formulated as follows
min v1(r)
s:t: ½K(r)v1M(r)F1(r) =0 Pn
e=1
VereV0 0r
minre1
ð5Þ
whereMandKare the mass matrix and stiffness matrix of the panel, respectively;v1andF1are the first-order
modal frequency and corresponding mode shape, respectively; V is the volume of the initial stiffened panel; andVeis the volume of the element. In
computa-tions, a small lower bound, 0\rmin\r, is usually imposed, in order to avoid a singular FEM problem when calculating the inverse of the stiffness matrix. Here, the lower bound of density is set to a typical value
rmin = 0.001. The sensitivity of the modal frequency to
density can be expressed as18
∂v21 ∂r
e
=FT1
∂K
∂r
e
v21
∂M
∂r
e
F1 ð6Þ
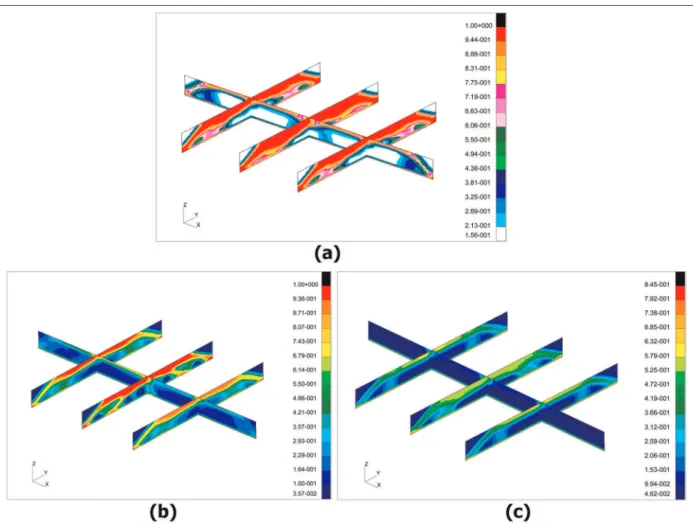
the design domain. The results of optimized material density distribution are shown in Figure 3.
The MF as shown in Figure 3(a)–(c) is decreasing, purpose of which is to identify the most important part for increasing the fundamental frequency. It can be intuitively observed that the density of the long edge is rather low on the whole. High density is distributed at the three short stiffeners, especially at the middle one. The corners and innerness of the short stiffeners are
also low density distributed. The corners of the short stiffeners can be removed. However, for the purpose of mechanical connection between the panel and stiffen-ers, the innerness of the stiffeners should be retained. Thus, the optimal stiffened configuration is in the form of three short stiffeners with trapezoid in the side view, instead of the initial rectangle.
Reanalysis and assessment
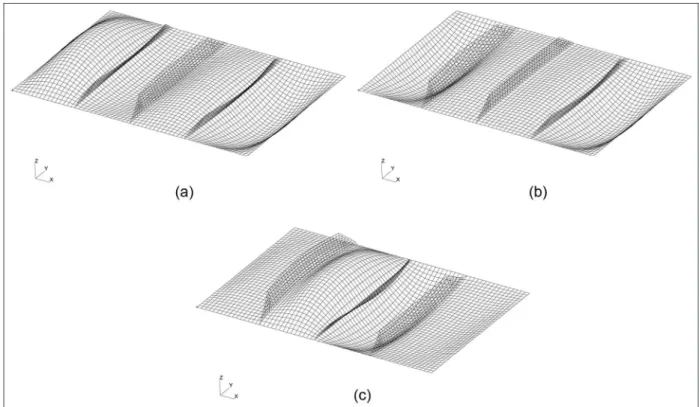
The FE model of the optimized stiffened panel was created using the CQUAD4 element, as shown in Figure 4. The boundary condition is still the simply supported constraint. The first three modal frequen-cies are 438, 444, and 539 Hz, respectively, and the corresponding mode shapes are depicted in Figure 5. Unlike the first mode shape (unidirectional bending) of both the flat and initial stiffened panels, the first-order mode shape of the optimized stiffened panel is more complex, that is, bending in different directions. In order to evaluate the improvement of the optimi-zation, an index of relative rate of change in the
Figure 3. Optimized material density distribution at different MFs: (a) 60% MF, (b) 40% MF, and (c) 20% MF.
fundamental frequency versus mass was used to assess the stiffener efficiency, which is defined as
h=Df f0
=Dm
m0
ð7Þ
where f0 and m0 are the fundamental frequency and
mass of the flat panel, respectively, andDfandDmare the fundamental frequency increment and mass incre-ment of the stiffened panel against the flat panel, respectively. Table 2 gives the masses and fundamental frequencies of the three panels. According to equation (7), hof the initial stiffened panel versus the flat panel
equals 17.56, while the value is 20.84 for the optimized stiffened panel versus the flat panel. This indicates that the contribution to increasing the fundamental fre-quency per mass is higher for the optimized stiffeners.
Furthermore, the dynamic responses of the three panels were computed to make a contrast. As the reen-try speeds of hypersonic flight vehicles can reach as
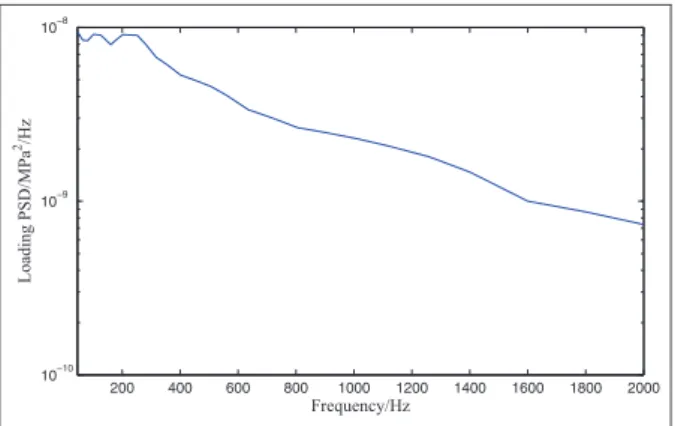
high as Mach 7, the panel-type surfaces are subjected to severe aerodynamic noise (as pressure waves) when the vehicles reentry into the atmosphere. The aerodynamic noise loading is characterized by broadband and acting on the structural surfaces. The random acoustic excita-tion acting vertically to the panel surface is considered to be a stationary Gaussian random pressure with zero mean and uniform magnitude over the whole surface. The power spectral density (PSD) of the acoustic pres-sure loading is transformed based on the 1/3 octave spectrum in US military standard MIL-STD-810D,19 with the overall sound pressure level (SPL) at high exci-tation level of 160 dB (re 2 3 1025
Pa). Figure 6 gives the PSD curve of the acoustic pressure loading. The dis-placement PSD curves of the panels were computed under the excitation of acoustic loading, and the maxi-mum root mean square (RMS) values of displacement responses of each panel were listed in Table 3, together with the locations of the maximum. It obviously shows that both the displacements of the initial and optimized stiffened panel are limited to an acceptable range.
From Figure 7, the numerical results of the dynamic responses clearly support the law that the major part of the response results from the contribution of the first mode, that is, the predominant mode, for both the flat and stiffened panels. The response at the first modal frequency is far larger than that at higher modes. This further demonstrates that optimizing the first-order mode is effective.
Figure 5. Mode shapes of the optimal stiffened panel: (a) first mode, (b) second mode, and (c) third mode.
Table 2. Mass and fundamental frequency of the three panels.
Mass (kg) Fundamental frequency (Hz) Flat panel 1.440 82
Conclusion
This article presents the dynamic design of stiffeners for a typical panel using topology optimization and FE analysis. The FE models of a typical flat and an initial stiffened panel were constructed. Modal analysis was employed to obtain the inherent dynamic properties for both the flat and initial stiffened panels. Then, topol-ogy optimization of the initial stiffened panel was for-mulated based on the variable density method to maximize the fundamental frequency, taking the stif-feners as the design domain. An optimal stiffened panel was obtained based on the optimization results, with the long-edge stiffener and the corners of the short stif-feners removed. Reanalysis was carried out to assess the efficiency of the optimization. An increase in the relative rate of change in the fundamental frequency versus mass was observed between before and after the optimization.
Declaration of conflicting interests
The authors declare that there is no conflict of interest regard-ing the publication of this article.
Funding
This research received financial support from the National Natural Science Foundation of China (10902024), the New Century Excellent Talent in University (NCET-11-0086), the Fundamental Research Funds for the Central Universities, and the College Postgraduates Scientific Research Innovation Program of Jiangsu Province (KYLX_0093).
References
1. Blevins RD, Bofilios D, Holehouse I, et al. Thermo-vibro-acoustic loads and fatigue of hypersonic flight vehicle
structure. Chula Vista, CA: Goodrich Aerostructures
Group, 2009.
2. Zuchowski B. Predictive capability for hypersonic struc-tural response and life prediction: phase II—detailed
design of hypersonic cruise vehicle hot-structure. Chicago,
IL: The Boeing Company, 2012.
3. Moon SI, Cho IJ and Yoon D. Fatigue life evaluation of mechanical components using vibration fatigue analysis technique.J Mech Sci Technol2011; 25(3): 631–637. 4. Aykan M and Cxelik M. Vibration fatigue analysis and
multi-axial effect in testing of aerospace structures.Mech
Syst Signal Process2009; 23(3): 897–907.
5. Han SH, An DG, Kwak SJ, et al. Vibration fatigue anal-ysis for multi-point spot-welded joints based on fre-quency response changes due to fatigue damage accumulation.Int J Fatig2013; 48: 170–177.
6. Pedersen NL. Maximization of eigenvalues using topology optimization.Struct Multidiscip Optim2000; 20: 2–11. 7. Pagnacco E, Lambert S, Khalij L, et al. Design
optimisa-tion of linear structures subjected to dynamic random loads with respect to fatigue life.Int J Fatig2012; 43: 168–177. 8. Yoon GH. Structural topology optimization for
fre-quency response problem using model reduction schemes.Comput Method Appl Mech and Eng2010; 199: 1744–1763.
9. Abdalla MM, Setoodeh S and Gurdal Z. Design of vari-able stiffness composite panels for maximum fundamen-tal frequency using lamination parameters. Compos
Struct2007; 81: 283–291.
10. Khani A, IJsselmuiden ST, Abdalla MM, et al. Design of variable stiffness panels for maximum strength using lamination parameters. Compos Part B Eng 2011; 42: 546–552.
200 400 600 800 1000 1200 1400 1600 1800 2000 10−10 10−9 10−8 Frequency/Hz Loading PSD/MPa 2/Hz
Figure 6. The PSD curve of the loading.
100 200 300 400 500 600 700 800 900 1000 10−8 10−6 10−4 10−2 100 102 Frequency/Hz Displacement PSD/mm 2/Hz Flat panel Initial stiffened panel Optimal stiffened panel
Figure 7. The PSD curves of the responses.
Table 3. RMS displacements and locations of the panels.
RMS displacement (mm)
Location
Flat panel 4.792 Panel center Initial
stiffened panel
0.155 1/4 side center (near the short edges) Optimal
stiffened panel
0.330 1/4 center (near the corners)