1Pontifícia Universidade Católica do Rio Grande do Sul – PUCRS, Porto Alegre (RS), Brasil. E-mails: [email protected], [email protected], [email protected], [email protected], [email protected], [email protected]
2PETROBRAS/CENPES, Rio de Janeiro (RJ), Brasil. E-mails: [email protected], [email protected], [email protected] 3The Petroleum Institute, United Arab Emirates University, Sas Al Nakhl (Abu Dhabi), United Arab Emirates. E-mail: [email protected] *Corresponding author.
Manuscript ID: 20170027. Received in: 03/02/2017. Approved in: 06/22/2017. ABSTRACT: Much research has been published regarding the relation between major gas hydrate accumulations and the global carbon cycle. In this context, the determination of the sulfate/me-thane interface (SMI) depth is of primary importance in order to understand the dynamics of methane lux in the shallow section. his paper identiies the depth of the SMI in sediments based on sulfate and methane concentration proiles in cores recovered in the Rio Grande Cone Gas Hydrate Province, Pelotas Basin, southern Brazil. he shape of methane and sulfate concentration proiles in the sediments can be linked to the local methane lux rate as follows: (i) near linear, high upward-difusing methane lux coupled with high sulfate difusion from seawater; (ii) irregular, variable methane lux rates; and (iii) kink-type proile, which is indicative of variable rather than strictly high upward methane lux. he areas in which a high methane lux was identiied are spatially associated with gas chimneys in sediments within pockmarks, whereas proiles with low methane lux are present in adjacent areas. hese chimneys appear as acoustic blankings in seismic records and can therefore be mapped in subsurface. he wavy-like seismic relection following the SMI coincides with the occurrence of authigenic carbonate nodules and concretions. In addition, high methane luxes and the occurrence of concretions and nodules carbonates were correlated by stratigraphic position of the concretions bearing intervals and sulfate proiles. KEYWORDS: gas hydrate; methane flux; Rio Grande Cone; Brazil.
RESUMO: Muitas pesquisas têm sido publicadas relacionando elevadas acumulações de hidrato de gás e o ciclo global do carbono. Nesse contexto, a determinação da profundidade da interface sulfato/metano (SMI) é importante para entender a dinâmica do luxo de metano em locais rasos. Este artigo cientíico identiica a profundidade da SMI em sedimentos com base em peris de concentração de sulfato e metano em testemunhos recuperados na Província do Hidrato de Gás do Cone do Rio Grande, Bacia de Pelotas, no Sul do Brasil. A forma dos peris de concentração de metano e sulfato nos sedimentos pode ser relacionada à taxa de luxo de metano da seguinte forma: (i) luxo de metano quase linear, de alta difusão ascendente, com alta difusão de sulfato da água do mar; (ii) luxo de metano irregular e taxas variáveis;(iii) peril de tipo torção, que é indicativo de um luxo de metano variável em vez de somente alto luxo ascendente. As áreas em que o alto luxo de metano foi identiicado es-tão associadas com chaminés de gás em sedimentos dentro de pockmarks, enquanto peris com baixo luxo de metano estão presentes em áreas adjacentes. Essas chaminés aparecem como brancos acústicos nos dados sísmicos e, portanto, podem ser mapeadas na subsuperfície. A variação da relexão sísmica que segue o SMI coincide com a ocorrência de nód-ulos e concreções de carbonato autigênicos. Além disso, elevados luxos de metano e a ocorrência de concreções e nódulos de carbonatos foram correlacionados pela posição estratigráica dos intervalos de concreções e peris de sulfato.
PALAVRAS-CHAVE: hidrato de gás; luxo de metano; Cone de Rio Grande; Brasil.
The inluence of methane luxes on the
sulfate/methane interface in sediments
from the Rio Grande Cone Gas Hydrate
Province, southern Brazil
A inluência dos luxos de metano na interface sulfato/metano em
sedimentos de hidrato de gás do Cone do Rio Grande, Sul do Brasil
Luiz Frederico Rodrigues1*, João Marcelo Ketzer1, Rogerio Véscia Lourega1, Adolpho Herbert Augustin1, Gesiane Sbrissa1, Dennis Miller2,
Roberto Heemann1, Adriano Viana2, Antonio Fernando Menezes Freire2, Sadoon Morad3
INTRODUCTION
Methane in gas hydrates is generated by bacterial deg-radation of organic matter at shallow depths below sealoor and/or sourced from deep petroleum ields (Demirbas 2010, Gupta 2004). Methane in deep-sea sediments is transported by advection and difusion in pore water and, under favorable conditions of pressure, temperature and saturation, part of the methane luxing through sediments forms methane hydrate within the pore space (Gupta 2004, Demirbas 2010).he con-sumption of methane owing to microbial activity may increase carbonate alkalinity, which can promote the precipitation of authigenic carbonates (Kennicutt et al.1988a, 1988b,Michae-lis et al. 2002, Sassen et al.1998, Matsumoto et al. 2011).
Anaerobic oxidation of methane (AOM) and the closely linked sulfate reduction (SR) are dominant processes in organic-rich sediments. AOM occurs at or close to the boundary between SR zone and the methanogenic zone, where methane difuses upward. he boundary between these two zones is called sulfate/ methane interface (SMI).Upward luxes of methane may afect the depth of SMI below the sealoor (Borowski et al. 1996).
Pore water geochemical parameters suggest that most of the upward lux of methane is oxidized anaerobically near the SMI. he occurrence of AOM primarily at the SMI is indi-cated by a linear sulfate proile in areas with large amounts of methane difusing upwards (Borowski et al. 1996, 1997, Niewöhner et al. 1998, Hinrichset al. 1999). AOM can be represented by the reaction ahead (Eq. 1):
CH4 + SO42-→ HCO 3
- + HS- + H
2O (1)
In which: CH4 = methane SO42-= sulfate
HCO3-= hydrogencarbonate
HS-= bisulide
H2O = water
Immediately below the SR zone and the SMI there is the methanogenic zone, in which methane concentrations increase with depth (Claypool &Kaplan 1974).
Another important anaerobic microbial reaction occurs when sulfate is used as an oxidant by consortium of micro-organisms to breakdown organic matter. he reduction of sulfate results in a concave-down exponential proile of sul-fate (Berner 1980). his reaction is depicted ahead (Eq. 2):
2CH2O + SO42-→ 2HCO 3
- + H
2S (2)
In which:
2CH2O = formaldehyde
SO42-= sulfate
HCO3- = hydrogencarbonate
H2S = hydrogen sulide
According to Equations 1 and 2, the increase in carbon-ate alkalinity (primarily HCO3-) owes to the decomposition
of methane or organic matter (Raiswell 1988).
Organic matter and methane are the fuels for microbial activity in sediments, contributing to the control of the bio-geochemical zonation below the sealoor. Geochemical zon-ing includes the reduction of sulfate as one of the main fea-tures of metabolic activity in marine sediments. herefore, the SMI tends to be located at shallow depths below the sealoor (Hensen et al. 2003, Joye et al. 2004).
Evidence suggests that there is a relationship between sulfate concentration gradients and upward methane lux rate, which is in equilibrium with underlying gas hydrate systems (Joye et al. 2004). Hence, understanding sulfate depletion patterns can be useful for indicating the presence of gas hydrate in sediments (Zatsepina & Bufett 1997, Carroll1992, Borowski et al. 1999).
he purpose of this paper was to identify the depth of the SMI in sediments based on sulfate and methane con-centration profiles in cores obtained from Rio Grande Cone Gas Hydrate Province, Pelotas Basin, southern Brazil. Additionally, the shape and relationships between these pro-iles are used in order to estimate the upward methane lux in the sediments. In this manner, this study may provide important information for the understanding of the global carbon cycle and for the exploration of gas hydrates.
STUDY AREA AND
GEOLOGICAL SETTING
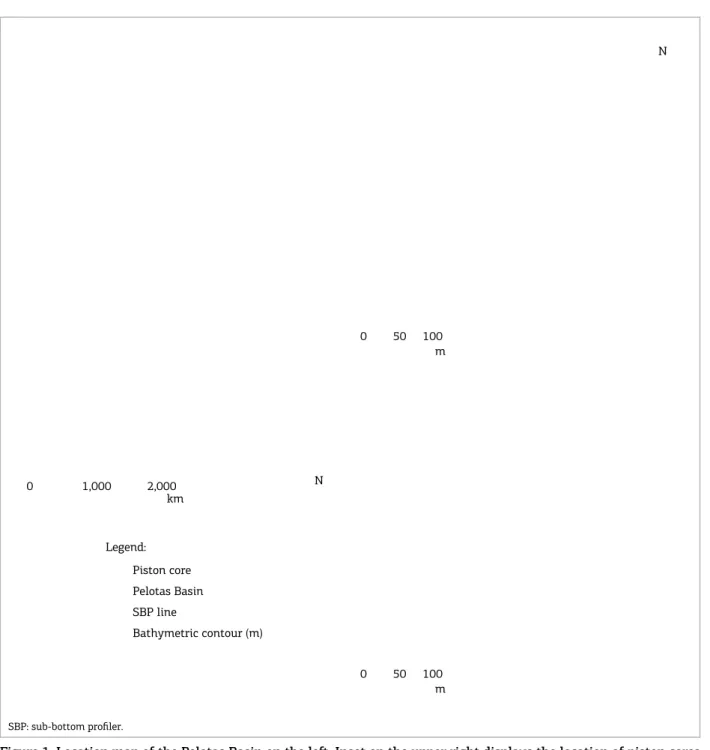
he study area is located in the Rio Grande Cone (Martins et al. 1972), which is a large protuberance in the continental slope of the Pelotas Basin, southern Brazil (Fig. 1). he Pelotas Basin has an area of approximately 250,000 km2resulted
SAMPLES AND METHODS
Sub-bottom profiler
Sub-bottom proiler (SBP) survey lines were acquired in the study area using an EdgeTech DW106 SBP (Chirp 1–6 kHz, central frequency 3.5 kHz) on board a C-Surveyor II Autonomous Underwater Vehicle (AUV). he AUV was towed at 40 m above the sealoor. he collected lines were processed and visualized using the software HIS Kingdom suite.
Piston cores
Five representative sediment cores were extracted with a 6-m-long piston core device during the MR11oceanographic mission. he cores were named PC01, PC51, PC52, PC53 and PC41 and were recovered in water depths from 531 to 1,301 m. PC41 is a background core. Immediately upon piston core recovery on deck, the Polyvinyl chloride (PVC) liner containing the sediments was removed from the external pipe and cut into 100 cm sections. Sediments and liners were then split lengthwise into a working half,
0 1,000 2,000 km
Legend:
Piston core
Pelotas Basin
SBP line
Bathymetric contour (m)
0 50 100
N
N
m
0 50 100 m
SBP: sub-bottom proiler.
for sampling, and an archive half, for onboard core descrip-tions and future storage. Core descripdescrip-tions involved the annotation of visual grain size, sediment color, icnofacies and structures.
Interstitial water and sediment sampling
he sediment samples of the working half were col-lected at regular intervals of 30 cm (three per core section) for chemical analysis of the interstitial water. he sediment samples (pieces of 10 to 20 cm) were squeezed onboard using stainless steel hydraulic squeezers, and interstitial water sam-ples were collected in 50 mL syringes attached to the base of each squeezer. Approximately, 10 mL of the interstitial water were used for onboard analysis while 40 mL were transferred to plastic bottles and stored at 4ºC for further analyses onshore.
Sediment samples for gas analyses (C1-C5 hydrocar-bons) were also collected from the top of the each section in regular intervals of 100 cm. Samples were collected from the freshly exposed tops of the core sections using a spatula and were immediately placed in IsoJars (special plastic con-tainer). he sediment samples illed one third of the IsoJars, while another third was illed with distilled water, leaving the top third with air (headspace). Five drops of the diluted Zephiran Chloride bactericide were added into the IsoJars in order to eliminate microbial activity. he IsoJars were kept refrigerated at 4ºC.
Experimental procedures
and measurements
Alkalinity was determined using a single beam spec-trophotometer (V-1 100D) adjusting the wavelength to 590 nm. Standards with known alkalinity (840, 1,680 and 3,360 mg L-1) were prepared by dilution of a titrated
NaHCO3 solution in an aqueous solution. he experimen-tal points demonstrated a irst order function with coei-cient of determination of 0.997. hese equations are used for the calculation of unknown alkalinity samples (Breland & Byrne 1993). he indicator was prepared by mixing in a 250 mL volumetric lask: 5 mL of 98% methanoic acid and 25 mL of a solution of Bromophenol-Blue (500 mg L-1).
he inal volume was adjusted to 250 mL with a solution of NaCl 0.7 mol L-1. Standards and samples were prepared
by mixing 1.5 mL of indicator with 1.5 mL of prepared alkalinity standards or sea water samples in polypropylene tubes and thoroughly shaken to achieve the CO2 outgas-sing. Samples above 800 mg L-1were carefully diluted to a
known factor by a solution of NaCl 0.7 mol L-1 in order to
keep the same ionic strength.
Sulfate concentrations in the interstitial waters were determined using a Metrohm (Herisau, Switzerland) ion
chromatograph (IC) consisting of a pump (IC liquid han-dling unit) and a conductivity detector (Model 819). he ana-lytical column was a Metrosep A Supp 5 (150 × 4 mm i.d.) with packing material composed by polyvinyl alcohol with quaternary ammonium groups and particle size of 5 m. A guard column Metrosep A Supp 4/5 Guard, packed with the same material and particle size of analytical column, was also used. An anion self-regeneration suppressor from Metrohm (Model 833 suppressor unit) was used to reduce the conductivity of mobile phase. Samples were diluted using 18 MΩ water, and the standards were also made from pure reagents and 18 MΩ water. Standard solutions were measured repeatedly in order to estimate the accuracy and external precision of the measurement.
A gas chromatograph equipped with a capillary column VP-Plot Alumina/KCl, 30 m × 0.53 mm, Film 10.0 μm, was used to determineC1-C5 hydrocarbons concentration in sediments. he GC-14A is conigured with a 0.5 mL injec-tion, split 1:7and a lame ionization detector (FID) for gas detection. Run conditions for column were 75ºC; ramp-ing up at 30 to 170ºC, and held for 10 min. Helium was used as the carrier gas at a constant volume of 5 mL/min. he injector temperature was 190ºC and the FID tempera-ture was held at 200ºC.
RESULTS
Sub-bottom profiler
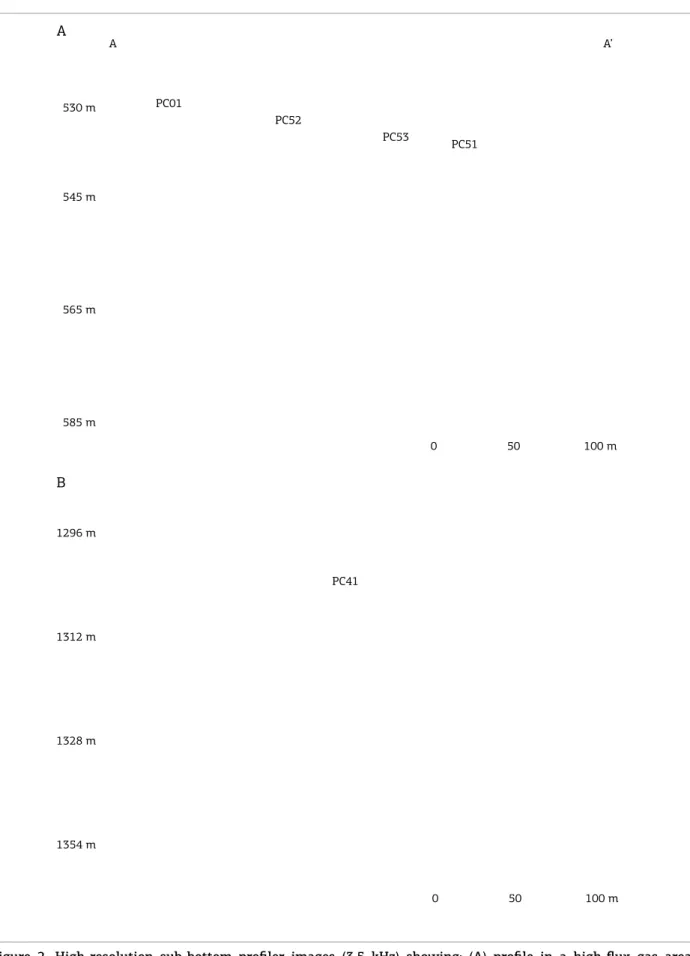
Gas chimneys have been recognized in other regions of the world as displaying typical acoustic blanking fea-tures in the SBP records (Riedel et al. 2006, Römer et al. 2012, Freire et al. 2011). In the present study area, detailed high-resolution acoustic surveys using SBP show inter-nal relections with strong positive amplitudes overlying zones of acoustic blanking which probably represent gas chimneys (Fig. 2A). In contrast, in the background area no amplitude anomalies or blanking features are observed (Fig. 2B). Note that the depth of the SMI, which will be further discussed, is generally shallower in the area with gas chimneys (Fig. 2A) than in the background area (Fig. 2B). Furthermore, it is also observed that the SMI depth is shallower above more intense amplitude anomalies (e.g., PC 51, Fig. 2A).
Piston core descriptions
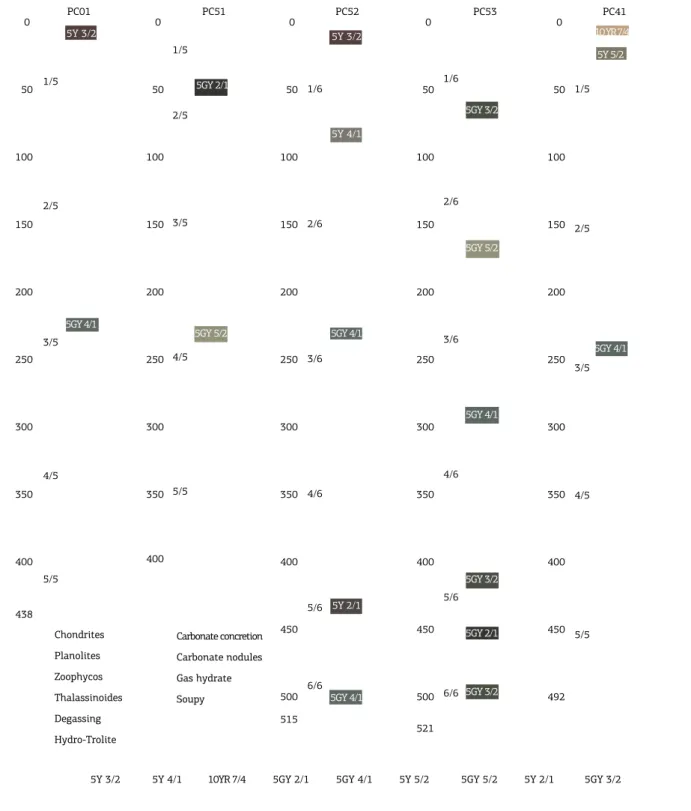
he four representative piston cores selected for this study (PC52,PC01, PC53, PC51) and the background piston core (PC41) were described as follows (Fig. 3).
A
A
B
A’
PC01
PC52
PC53
PC51 530 m
545 m
565 m
585 m
PC41
0 50 100 m
0 50 100 m 1296 m
1312 m
1328 m
1354 m
variation, stained by hydro-troilite (a rare iron sulfide mineral with the simple formula of FeS) and show-ing Thalassinoides ichnofossils (410–438 cm below seafloor (cmbsf )).
PC52 (5.15 m long/532 m water depth) consists of green gray mud with occurrence of hydrotroilite (430 – 445 cmbsf ), and Zoophycos ichnofossils dispersed below 250 cmbsf. Burrows are encountered at 180 to 230 cmbsf.
PC01 0 50 100 150 200 250 300 350 400 438 1/5 2/5 3/5 4/5 5/5 5Y 3/2 5GY 4/1 PC51 0 50 100 150 200 250 300 350 400 1/5 2/5 3/5 4/5 5/5 5GY 2/1 5GY 5/2 PC52 0 50 100 150 200 250 300 350 400 450 500 515 1/6 2/6 3/6 4/6 5/6 6/6 5Y 3/2 5Y 4/1 5GY 4/1 5Y 2/1 5GY 4/1 PC53 0 50 100 150 200 250 300 350 400 450 500 521 1/6 2/6 3/6 4/6 5/6 6/6 5GY 3/2 5GY 5/2 5GY 4/1 5GY 3/2 5GY 2/1 5GY 3/2 PC41 0 50 100 150 200 250 300 350 400 450 492 1/5 2/5 3/5 4/5 5/5 10 YR 7/4
5Y 5/2 5GY 4/1 Chondrites Planolites Zoophycos Thalassinoides Degassing Hydro-Trolite Carbonate concretion Carbonate nodules Gas hydrate Soupy
5Y 3/2 5Y 4/1 10YR 7/4 5GY 2/1 5GY 4/1 5Y 5/2 5GY 5/2 5Y 2/1 5GY 3/2
PC53 (5.21 m long/540 m water depth) contains a green gray mud with a soupy interval at 182 cmbsf. he occurrence of authigenic carbonate nodules was veriied from 220 to 240 cmbsf and hydrotroilite from 435 to 470 cmbsf associ-ated with halassinoides ichnofossils (460 cmbsf ).
PC51 (3.97 m long/535 m water depth) consists of a dark green gray mud with concretions and carbonate nodules between 100 cm and 180 cmbsf. At the interval from 185 m to 270 cmbsf, authigenic carbonate nod-ules are present. Between 315 and 397 cmbsf degassing structures were described, and gas hydrates were found at interval 345–365 cmbsf. A core section showing degas-sing features in muddy sediments from PC51 is depicted in Fig. 4A and carbonate concretions from PC53 are shown in Fig. 4B.
he background sample in PC41 (4.92 m length/1,301 m water depth) contains a grayish orange mud in the top10 cmbsf, changing to a light olive gray (10–33 cmbsf) and olive gray below until the bottom of the core. Planolites and Chondrites (10–33 cmbsf ) and Zoophycos ichno-fossils with Planolites and halassinoides (between 100– 210 cmbsf ) were also described.
Interstitial water and gas analyses
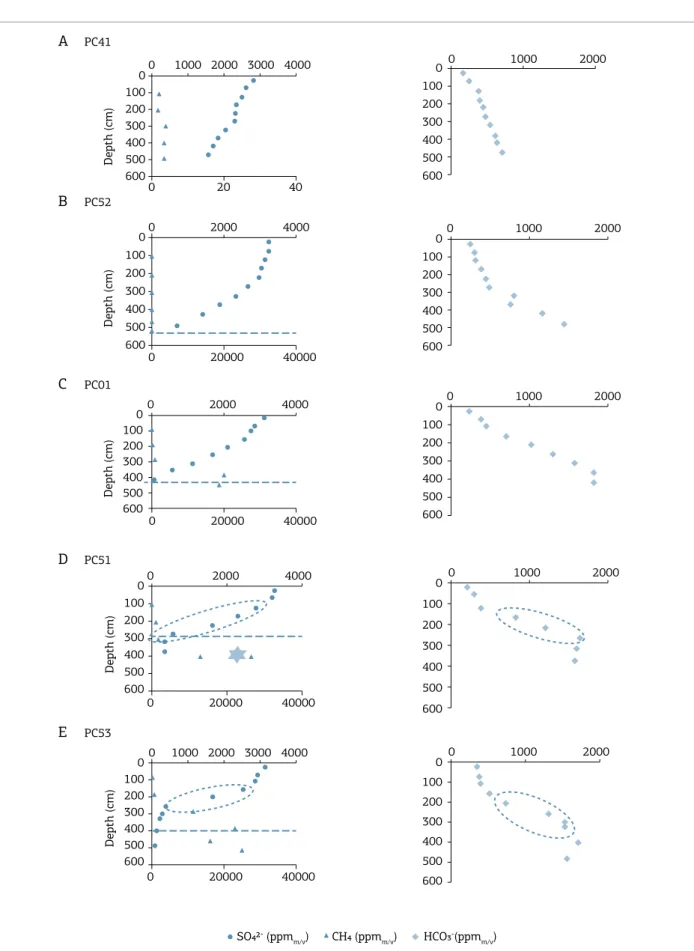
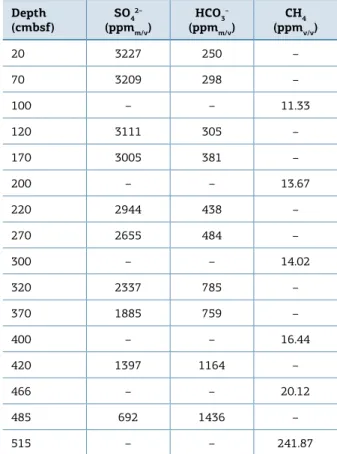
In PC41 (background), the sulfate concentration decreases slowly between 20 and 470 cmbsf from 2,800 to 1,590 ppm. he methane concentration is very low (around4 ppm) and alkalinity increases gradually from 150 to 700 ppm (Fig. 5A). he sulfate/depth proile in PC52 (Fig. 5B) shows a concave-up shape and the SR begins approximately at 60 cmbsf, with decreasing sulfate concentration from 3,227 to 692 mg L-1. he methane
concentration is low (200 ppm at 500 cmbsf ) (Fig. 5A). Alkalinity concentration increases from 200 to 1,400 mg L-1
in the interval between 20 and 500 cmbsf. For PC01, the sulfate depth proile decreases linearly between 20 and 422 cmbsf, and the methane concentration increases sharply after 400 cmbsf, reaching values of 20,000 ppm (Fig. 5C). At this depth (400 cmbsf ), the sulfate concen-tration in pore water falls to nearly zero and alkalinity increases from 200 to 1,800 mg L-1 (Fig. 5C). In PC51 and
PC53, the SR begins approximately at 60 cmbsf, and sulfate concentration decreases from 3,110 to nearly 0.0 mg L-1
(Figs. 5D and 5E). In PC51, the methane concentration increases sharply from 900 to 13,000 ppm in the inter-val from 200 to 400 cmbsf, and alkalinity increases from 190 to 1,600 mg L-1 in the measured interval (Fig. 5D).
In PC53, the methane concentration increases for 400 to over 20,000 ppm in the interval from 200 to 400 cmbsf, and the increase in alkalinity was from 350 to 1,700 mg L-1
in the measured interval (Fig. 5E). In all cores, sulfate concentrations displayed decreases from a maximum of 3,370 mg L-1 to values near zero in the interval between
2.6 and 500 cmbsf.
Tables 1-4 show the results for sulfate, alkalinity and methane determination in the PC52, PC01, PC51 and PC53. hese results can be ind in the suplementary material.
DISCUSSION
The SR process in pore waters of marine sediments involves simultaneous oxidation of methane or organic compounds and reduction of dissolved sulfate to hydrogen sulide and bicarbonate by microorganisms (Berner 1981). Methane hydrate formation near the sealoor typically occurs below the SMI and immediately above this interface, as the SR process consumes dissolved methane and inhibits hydrate formation. he depth to which hydrate is formed is constrained by a balance between downward difusing sul-fate and the upward lux of methane towards the sealoor (Borowski et al. 1996).
he proile of sulfate concentrations in interstitial water in PC52 can be divided into two sections (Fig. 5). A sharp
2.5 cm 2.5 cm
A B
CH₄ (ppmm/v) HCO³⁻(ppmm/v) A
B
C
D
E PC41
PC52
PC01
PC51
PC53
Depth (cm)
SO₄⁻ (ppmm/v) 0 1000 2000 3000 4000
0 2000 4000
0 20000 40000 0
100 200 300 400 500 600
0 1000 2000 0
100 200 300 400 500 600
0 1000 2000 0
100 200 300 400 500 600
0 1000 2000 0
100 200 300 400 500 600
0 1000 2000 0
100
200
300
400
500
600
0 1000 2000 0
100
200
300
400
500
600
Depth (cm)
Depth (cm)
0 100 200 300 400 500 600
0 2000 4000
0 20000 40000 0
100 200 300 400 500 600
Depth (cm)
0 2000 4000
0 20000 40000 0
100 200 300 400 500 600
Depth (cm)
0 1000 2000 3000 4000
0 20000 40000 0
100 200 300 400 500 600
0 20 40
Table 4. Results for sulfate, alkalinity and methane
determination in PC53.
Depth
(cmbsf) SO4
2–
(ppmm/v) HCO3
–
(ppmm/v) (ppmCH4v/v)
20 3117 349 –
70 2891 370 –
82 – – 175.35
102 2856 396 –
152 2513 514 –
182 – – 423.08
202 1651 729 –
252 344 1300 –
282 – – 11459.02
302 242 1535 –
325 171 1522 –
382 – – 23123.23
402 81 1687 –
467 – – 15944.11
487 45 1529 –
521 – – 24738.11
Table 1.Results for sulfate, alkalinity and methane
determination in PC52.
Depth
(cmbsf) SO4
2–
(ppmm/v) HCO3
–
(ppmm/v) (ppmCH4v/v)
20 3227 250 –
70 3209 298 –
100 – – 11.33
120 3111 305 –
170 3005 381 –
200 – – 13.67
220 2944 438 –
270 2655 484 –
300 – – 14.02
320 2337 785 –
370 1885 759 –
400 – – 16.44
420 1397 1164 –
466 – – 20.12
485 692 1436 –
515 – – 241.87
Table 2.Results for sulfate, alkalinity and methane
determination in PC01.
Depth
(cmbsf) SO4
2–
(ppmm/v) HCO3
–
(ppmm/v) (ppmCH4v/v)
20 3121 230 –
70 2831 374 –
87 – – 137.3
107 2735 438 –
157 2512 692 –
187 – – 249.1
207 2092 1014 –
257 1700 1295 –
287 – – 641.55
307 1154 1578 –
357 590 1828 –
387 – – 19784.67
422 83 1817 –
438 – – 18296.09
Table 3.Results for sulfate, alkalinity and methane
determination in PC51.
Depth
(cmbsf) SO4
2–
(ppmm/v) HCO3
–
(ppmm/v) (ppmCH4v/v)
20 3211 193 –
60 3143 287 –
97 – – 127.86
117 2739 390 –
167 2252 821 –
197 – – 904.07
217 1588 1188 –
267 528 1633 –
297 – – 1616.88
317 310 1597 –
372 279 1573 –
497 – – 26145.22
■ A downward kink at 117 cmbsf for PC51 and152 cmbsf for PC53;
■ An upward kink at near 300 cmbsf for PC51 and PC53 to the base of piston core.
herefore, based in sulfate proile, the variable methane lux can be divided in three stages:
■ Low methane lux from 0–117 cmbsf to PC51 and from 0–152 cmbsf to PC53;
■ High methane lux between 117–300 cmbsf to PC51 and 152–300 cmbsf to PC53, which corresponds to the concretion-bearing interval;
■ Low methane lux from 300 cmbsf to base of piston core.
However, even showing high slope in sulfate proile in this depth, the geochemical data showed high concentra-tion of methane (around 20,000 ppm) and gas hydrate for-mation (PC51).he methane proile is crossing the SMI, which suggests that the AOM does not consume all the available methane migrating through the zone of major AOM activity (Knab et al. 2009, Reeburgh et al. 1991, Jørgensen et al. 2001, Hensen et al.2003). AOM of this type, having such methane-tailing proiles, is referred as “sluggish” and it is generally associated with variable meth-ane lux rates (Jørgensen et al.2001). In the same way, the sulfate proile after 300 cmbsf is continuing and showing a constant low concentration. It remains unclear why the microorganisms cannot bring down the substrate con-centrations further and shorten the lifetime of coexisting methane and sulfate. Little is known about their limiting the eiciency of the anaerobic methane oxidizing microor-ganisms (Jørgensen et al. 2001). Since the gradients have not signiicantly smoothed, the event at PC51 and PC53 has probably occurred very recently like a magnitude of the mass (re-)movements, for example. After some hundreds of years, the kink-type sulfate proile will change to a concave up shape (Hensen et al. 2003).
In PC51, extrapolation of the concentration proiles of dissolved CH4 and sulfate would indicate that the SMI is positioned approximately between 260 and 360 cmbsf. he presence of degassing features (Fig. 4) in the interval from 310 to 397 cmbsf and gas hydrate formation within this zone (345–360 cmbsf ) are indicative of high methane lux (Hiruta et al. 2009). Pore water collected from the sed-iment closer to hydrate revealed the highest methane con-centration (26,000 ppm) in the core, most probably derived from the dissociation of methane hydrate. he increase in alkalinity is coupled with the presence of carbonate con-cretions (Fig. 4B) and hydrotroilite, indicating AOM and concomitant SR. he interception depth between sulfate and methane proiles in PC53 is encountered at 300 cmbsf. kink in the sulfate concentration proile at 250 cmbs is that
both sediment sections have diferent gradients. he sulfate gradient of the upper part was probably formed in a sedi-ment sequence with a low sulfate gradient while lower part was formed with a high gradient. his diference might be attributed to diferent upward lux of methane (Berner 1980). According to Borowski et al. (1996), rate of sulfate consumption and steepness of sulfate gradients are controlled by methane lux from below. herefore, the low angle pro-ile of lower part (below 250 cmbsf ) is attributed to higher lux than the upper part (until 250 cmbsf ). Extrapolation of the concentration proiles of dissolved CH4 and sulfate would indicate that the SMI is positioned approximately at 550 cmbsf (Fig. 5), and hence located below the base of the core. he presence of abundant hydrotroilite at the base of the core (i.e., 380–470 cmbsf ) is indicative of the con-sumption of methane by microbial SR and release of sulide to pore waters (Eq. 1) (Borowski et al. 1996, 1997). In this interval, the sulide ions have reacted with available iron to form iron sulide. his geochemical phenomenon explains the close association of hydrotroilite with the increase of alkalinity in the interstitial water (Fig. 5) (Niewöhner et al. 1998, Hinrichs et al. 1999).
he sulfate proile of PC01 also presents a kink-type proile at 200 cmbsf, which is indicative of variable rather than strictly high upward methane lux. A low sulfate gra-dient is until 200 cmbsf, and a constant linear decrease in sulfate concentration is observed below 200 cmbsf (Fig. 5), which might be attributed to high upward lux of methane coupled with high sulfate difusion from sea water, used for anaerobic methane oxidation (Borowski et al. 1996, 1997). Linear sulfate proiles indicate that sulfate consumption is driven by high upward lux of methane and the slope of the concentration proile of sul-fate indicates that its depletion is driven by methane lux from below. Comparison of the slope between the linear behavior regions of PC52 and PC01 shows that the slope of PC01 is lower than PC52, which means that sulfate consumption driven by methane lux from below in PC01 is higher than PC52. Based on the methane and sulfate concentration proiles, the SMI in PC01 is interpreted at422 cmbsf, which coincides with the ubiquitous pres-ence of hydrotroilite immediately above this depth (i.e., 420–430 cmbsf ), associated with anaerobic oxidation reactions (Eq. 1).Although carbonate concretions are not present in the core, its alkalinity increases from 200 to 1,800 mg L-1 from 60 and 420 cmbsf.
The irregular pore water SO42- profile of PC51 and
he decrease in methane concentration above the SMI is indicative of methane consumption by AOM, whereas in the region below the SMI there is methane production by methanogenesis and/or methane lux from deeper sediments via gas chimneys (Fig. 2). he increase in alkalinity is cou-pled with the presence of carbonate concretions (Fig. 4B) and hydrotroilite, indicating AOM and concomitant SR.
Several locations indicates a relationship and co-occurrence between venting of methane-rich luids, gas hydrate and the formation of authigenic carbonates at the sealoor — e.g., the Sea of Okhotsk (Soloviev &Ginsburg 1997), the Cascadia Margin (Bohrmann et al. 1998) and the Blake Ridge (Paull et al. 1995), Rio Grande Cone (Miller et al. 2015). Besides the authigenic carbonates have been shown to occur in sed-iments containing CH4 hydrates, they are often associated with faults that act as conduits for the upward migration of luids and CH4 (Bohrmann et al. 1998). he favoring pre-cipitation of authigenic carbonate minerals in the shallow subsurface by the reaction (Eq. 3) (Baker & Burns 1985):
2 HCO3- + Ca2+↔ CaCO 3
- + CO
2 + H2O (3)
In which:
HCO3- = hydrogencarbonate
Ca2+ = calcium
CaCO3 =calcium carbonate CO2 = carbon dioxide H2O = water
It was identiied abundant concretions and nodules in the piston cores PC51 and PC53. By correlating the strati-graphic position of the concretions bearing intervals and sulfate proiles, it is possible to do the correlations between high methane fluxes and the occurrence of concretions (Fig. 5). herefore, high upward methane lux leads to the ascension of the SMI throughout the sedimentary column and the formation of concretions and nodules carbonates.
In addition to the use of methane and sulfate concentra-tion proiles, the study also demonstrated that the posiconcentra-tioning of the SMI in sediments could be inferred in high-resolution SBP sections, as the SMI is marked by a discontinuous seis-mic relection (Fig. 2). he lateral changes in methane lux rates observed in diferent piston cores agree well with the wavy form of the SMI relection in the proiler section, where areas of higher and lower luxes coincide with the upward and downward displacements of the relection, respectively. he SMI relection is absent in areas of very low methane lux (Fig. 2). he wavy SMI-coincident relector was sampled by cores PC51 and PC53 which contain carbonate nodules and concretions. It is thus probable that the dispersed auth-igenic carbonate is responsible for these relections.
CONCLUSIONS
he methane and sulfate concentrations and alkalin-ity proiles in pore waters provide valuable insight into geochemical zones in methane hydrate-bearing deep sea sediments. he decrease of sulfate concentrations in the pore waters is attributed to the decomposition of organic matter and/or methane consumption by microorganisms during anaerobic oxidation of methane, which results in reduction of sulfates into sulides. In our study area, the data imply the depth of the SMI below the seafloor is mainly controlled by the rate of the upward methane lux. he depth of the SMIs in high methane lux areas, which are associated with underlying gas chimneys, is between 3–4 m below sealoor, whereas in adjacent areas the depth of SMI is >5 m. hese SMI depths in sediments can also be inferred in high-resolution SBP sections.
he shape of methane and sulfate concentration pro-iles in the sediments can be linked to the local methane lux rate as such:
■ A near linear sulfate proiles indicate that sulfate con-sumption is driven by high upward lux of methane from below.
■ he irregular pore water proiles, also referred as “slug-gish” proiles, are correlated to variable methane lux rates. ■ Concave-up exponential profiles are related to slow
upward lux of methane.
he areas in which a high methane lux was identiied are spatially associated with gas chimneys in sediments within pockmarks, whereas proiles with low methane lux are associated to adjacent areas.
he presence of gas chimneys in sediments can be acous-tically detected using SBP images (3.5 kHz). hese chim-neys appear as blanking in the acoustic signals and can therefore be mapped in the subsurface. Cores identiied with high methane lux are positioned above such blanking features and low methane lux in cores adjacent to them. Also, higher amplitude relections following the SMI seem to occur where authigenic carbonate nodules and concre-tions are present.
ACKNOWLEDGEMENTS
Baker P.A., Burns S.J. 1985. Occurrence and formation of dolomite in organic-rich continental margin sediments. American Association Of Petroleum Geologists Bulletin, 69(11):1917-1930.
Berner R.A. 1980. Early Diagenesis: A Theoretical Approach. Princeton University Press, Princeton, 241 p.
Berner R.A. 1981. A new geochemical classiication of sedimentary
environments. Journal of Sedimentary Research,51(2):359-365.
Bohrmann G., Greinert J., Suess E., Torres M.1998. Authigenic carbonates from Cascadia subduction zone and their relation to gas hydrate stability. Geology, 26(7):647-650.
Borowski W.S., Paull C.K., Ussler W. 1996. Marine pore-water sulfate
proiles indicate in situ methane lux from underlying gas hydrate.
Geology, 24(7):655-658.
Borowski W.S., Paull C.K., Ussler W. 1997. Carbon cycling within the
upper methanogenic zone of continental rise sediments; An example
from the methane-rich sediments overlying the Blake Ridge gas hydrate deposits. Marine Chemistry, 57(3-4):299-311.
Borowski W.S., Paull C.K., Ussler W. 1999. Global and local variations of interstitial sulfate gradients in deep-water, continental margin sediments: Sensitivity to underlying methane and gas hydrates. Marine Geology, 159(1-4):131-154.
Breland J.A., Byrne R.H. 1993. Spectrophotometric procedures for determination of sea water alkalinity using bromocresol green. Deep Sea Research Part I: Oceanographic Research Papers, 40(3):629-641.
Carroll J.J. 1992. Comments on ‘The prediction of methane solubility in natural waters to high ionic strength from 0 to 2508C and from 0 to 1600 bar’. In: Duan Z., Moller N., Greenberg J., Weare J.H. (eds.) Geochemica Cosmochemica Acta, 56, p. 4301-4302.
Claypool G.E., Kaplan I.R. 1974. The origin and distribution of methane in sediments. In: Kaplan I.R. (ed.) Natural Gases in Marine Sediments. New York, Plenum, p. 99-139.
Clennell M.B.2000. Hidrato de gás submarino: natureza, ocorrência
e perspectivas para exploração na margem continental brasileira.
Revista Brasileira de Geofísica, 18(3):397-409.
Demirbas A. 2010. Methane hydrates as potential energy resource: Part 1 – Importance, resource and recovery facilities. Energy Conversion and Management, 51(7):1547-1561.
Fontana R.L., Mussumeci A. 1994. Hydrates ofshore Brazil. Annals
of the New York Academy of Sciences, 715:106-113.
Freire A.F.M., Matsumoto R., Santos L.A. 2011. Structural-stratigraphic control on the Umitaka Spur gas hydrates of Joetsu Basin in the eastern margin of Japan Sea. Marine and Petroleum Geology, 28(10):1967-1978.
Gupta A.K. 2004. Marine gas hydrates: their economic and environmental importance. Current Science, 86(9):1198-1199.
Hinrichs K., Hayes J.M., Sylva S.P., Brewer P.G., DeLong E.F. 1999. Methane-consuming archaebacteria in marine sediments. Nature, 398:802-805.
Hiruta A., Snyder G.T., Tomaru H., Matsumoto R.2009. Geochemical constraints for the formation and dissociation of gas hydrate in an
area of high methane lux, eastern margin of the Japan Sea. Earth
and Planetary Science Letters, 279(3-4):326-339.
Hensen C., Zabel M., Piefer K., Schwenk T., Kasten S., Riedinger N., Schulz H.D., Boetius A. 2003. Control of sulfate pore-water proiles by sedimentary events and the signiicance of anaerobic oxidation
of methane for the burial of sulfur in marine sediments. Geochimica et Cosmochimica Acta, 67(14):2631-2647.
REFERENCES
Jørgensen B.B., Weber A., Zopi J. 2001. Sulfate reduction and
anaerobic methane oxidation in Black Sea sediments. Deep Sea
Research Part I: Oceanographic Research Papers, 48(9):2097-2120.
Joye S.B., Boetius A., Orcutt B.N., Montoya J.P., Schulz H.N., Erickson
M.J., Lugo S.K. 2004. The anaerobic oxidation of methane and sulfate
reduction in sediments from Gulf of Mexico cold seeps. Chemical
Geology, 205(3-4):219-238.
Kennicutt M.C., Brooks J.M., Bidigare R.R., Denoux G.J. 1988b. Gulf of Mexico hydrocarbon seep communities — I. Regional distribution of
hydrocarbon seepage and associated fauna. Deep Sea Research Part A. Oceanographic Research Papers, 35(9):1639-1651.
Kennicutt M.C., Brooks J.M., Denoux G.J. 1988a. Leakage of deep, reservoired petroleum to the near surface on the gulf of Mexico
Continental slope. Marine Chemistry, 24(1):39-59.
Knab N.J., Cragg B.A., Hornibrook E.R.C., Holmkvist L., Pancost R.D., Borowski C., Parkes R.J., Jørgensen B.B. 2009. Regulation of anaerobic
methane oxidation in sediments of the Black Sea. Biogeosciences, 6:1505-1518.
Martins L.R., Melo U., França A.M.C., Santana C.I.,Martins I.R. 1972. Distribuição Faciológica da Margem Continental Sul Riograndense.
Congresso Brasileiro de Geologia. 26° Anais. Belém, Brasil, p. 115-132.
Matsumoto R., Ryu B., Lee S., Lin S., Wu S., Sain K., Pecher I., Riedel
M.2011. Occurrence and exploration of gas hydrate in the marginal
seas and continental margin of the Asia and Oceania region. Marine and Petroleum Geology, 28(10):1751-1767.
Michaelis W., Seifert R., Nauhaus K., Treude T., Thiel V., Blumenberg M., Knittel K., Gieseke A., Peterknecht K., Pape T., Boetius A., Amann R., Jørgenson B.B.,Widdel F., Peckmann J., Pimenov N., Gulin M.B.
2002. Microbial reefs in the black sea fueled by anaerobic oxidation
of methane. Science, 297(5583):1013-1015.
Miller D.J., Ketzer J.M., Viana A.R., Kowsmann R.O., Freire A.F.M., Oreiro S.G., Augustin A.H., Lourega R.V., Rodrigues L.F., Heemann R., Preissler A.G., Machado C.X., Sbrissa G.F. 2015. Natural gas hydrates in the Rio Grande Cone (Brazil): A new province in the western South Atlantic. Marine and Petroleum Geology, 67:187-196.
Niewöhner C., Hensen C., Kasten S., Zabel M., Schulz H.D. 1998. Deep sulfate reduction completely mediated by anaerobic methane
oxidation in sediments of the upwelling area of Namibia. Geochimica
et Cosmochimica Acta, 62(3):455-464.
Oliveira S., Vilhena O., da Costa E. 2010. Time-frequency spectral signature of Pelotas Basin deep water gas hydrates system. Marine Geophysical Researches, 31(1-2):89–97.
Paull C.K., Ussler W., Borowski W.S., Spiess F.N. 1995. Methane-rich plumes on the Carolina continental rise: Associations with gas hydrates. Geology, 23(1):89-92.
Raiswell R. 1988. Chemical model for the origin of minor
limestone-shale cycles by anaerobic methane oxidation. Geology,
16(7):641-644.
Reeburgh W.S., Ward B.B., Whalen S.C., Sandbeck K.A., Kilpatrick K.A., Kerkhof L.J. 1991. Black Sea methane geochemistry. Deep Sea Research Part A. Oceanographic Research Papers, 38(S2):S1189-S1210.
Riedel M., Novosel I., Spence G.D., Hyndman R.D., Chapman R.N., SolemR.C., Lewis T. 2006. Geophysical and geochemical signatures associated with gas hydrate- related venting in the northern Cascadia margin. Geological Society of America Bulletin, 118(1-2):23-38.
ebullition from a high-lux seep area in the Black Sea—the Kerch
seep area. Marine Geology, 319-322:57-74.
Sad A.R.E., Silveira D.P., Machado D.A.P., Silva S.R.P., Maciel R.R.1998. Marine gas hydrates evidence along the Brazilian coast. In: Proc. AAPG
International conference and exhibition. Rio de Janeiro, Brazil, CD-ROM.
Sassen R., MacDonald I.R., Guinasso Jr. N.L., Joye S., Requejo A.G., Sweet S.T., Alcalá-Herrera J., DeFreitas D.A., Schink D.R. 1998.
Bacterial methane oxidation in sea-loor gas hydrate: Signiicance to
life in extreme environments. Geology, 26(9):851-854.
Silveira D.P., Machado M.A.P. 2004. Bacias sedimentares brasileiras: Bacia de Pelotas. Boletim informativo da Fundação Paleontológica Phoenix, 63(6).
Soloviev V.A., Ginsburg G.D. 1997. Water segregation in the course of gas hydrate formation and accumulation in submarine gas-seepage
ields. Marine Geology, 137(1-2):59-68.
Tomasini J., Santa Ana H., Conti B., FerroS., Gristo P., Marmisolle J., Morales E., Rodriguez P., Soto M., Veroslavsky G. 2011.Assessment
of marine gas hydrates and associated free gas distribution ofshore
Uruguay. Journal of Geological Research, 2011(2011):1-7.
Zatsepina O.Y., Bufett B.A. 1997. Phase equilibrium of gas hydrate: Implications for the formation of hydrate in the deep sea loor.
Geophysical Research Letters, 24(13):1567-1570.