Manager’s Discretionary Power and Comparability of Financial
Reports: An Analysis of the Regulatory Transition Process in Brazilian
Accounting*
Alex Mussoi Ribeiro
Universidade Federal de Santa Catarina, Centro Socioeconômico, Departamento de Ciências Contábeis, Florianópolis, SC, Brazil
Carlos Henrique Silva do Carmo
Universidade Federal de Goiás, Faculdade de Administração, Ciências Contábeis e Economia, Departamento de Ciências Contábeis, Goiânia, GO, Brazil
Luiz Paulo Lopes Fávero
Universidade de São Paulo, Faculdade de Economia, Administração e Contabilidade, Departamento de Contabilidade e Atuária, São Paulo, SP, Brazil
L. Nelson Carvalho
Universidade de São Paulo, Faculdade de Economia, Administração e Contabilidade, Departamento de Contabilidade e Atuária, São Paulo, SP, Brazil
Received on 04.17.2015 – Desk acceptance on 06.19.2015 – 3rd version approved on 12.21.2015.
ABSTRACT
This research aimed to directly evaluate the impact of the accounting regulatory flexibility movement on the comparability of financial reports. The country chosen for the analysis was Brazil, because it was one of the few countries in the world where a process of regulatory change from a completely rule-based standard with a strong link to tax accounting (Lopes, 2011) to a principle-based standard with greater need for decision by managers who prepare the financial reports took place. To measure comparability, the accounting function similarity model developed by DeFranco, Kothari and Verdi (2011) was used. The companies analyzed were all listed ones with full data for the period concerned having, at least, a pair company within the same economic activity sector. To obtain the research results, we adopted a panel data model where the years 2005 to 2012 were compared to the year 2004. The results obtained prove that, on average, there was no significant decrease in the comparability level within country during the regulatory transition period in Brazil. On the contrary, there was an increase in genuine comparability in the year 2012 when compared to 2004. In the model adjusted by stepwise, the years 2011 and 2012 had a significantly higher average comparability when compared to 2004. The results found corroborate other researches addressing the quality of accounting information (Collins, Pasewark, & Riley, 2012; Psaros & Trotman, 2004; Agoglia, Doupnik, & Tsakumis, 2011) and prove the superiority of the principle-based standard also over the comparability of financial reports. The main conclusion of this research is that increasing manager’s discretionary power through flexibility of accounting standards does not decrease the comparability of financial reports.
Keywords:comparability, regulation, International Financial Reporting Standards, principles, rules.
1 INTRODUCTION
the behavior of the latter (Ball, 2006; Madsen, 2011). In the case of adopting international standards, the gain in comparability between companies from diferent coun-tries is due to using a single standard and it is already expected, because there is a convergence of regulation that restricts accounting choices by managers and audi-tors within the same spectrum. On the other hand, the gain in comparability between companies from diferent countries may have generated a decrease in comparabi-lity between companies from the same country that had already adopted a single accounting standard, oten more restrictive in accounting choices when compared to the international standards. On this regard, a technical study conducted by the Foundation Institute for Accounting, Actuarial, and Financial Research (FIPECAFI) and Ernst & Young (2013, p. 7) highlights, in the Brazilian context, that “the way how some IFRS are applied has not become a consensus among market participants, yet, something which raises doubts about comparability of inancial sta-tements.”
In the academy there is also no consensus about the role of regulation concerning comparability (Cole, Bran-son, & Breesch, 2012). On the one hand, some authors argue that the standards based on principles increase the level of judgment and the diversity of interpretations of accounting phenomena, thus they can decrease the con-sistency and comparability of inancial reports (Sunder, 2009; Schipper, 2003; D’Arcy, 2000). On the other hand, certain authors argue just the opposite, i.e. an increased level of judgment allows managers to incorporate more properly the economic events and their various nuances in accounting numbers, thus increasing their compara-bility (Dye & Verrecchia, 1995; Securities and Exchan-ge Commission, 2003; Agoglia et al., 2011). he studies by Collins et al. (2012) and Agoglia et al. (2011) found diferences between accounting choices (and, as a con-sequence, in the inal outcome of inancial reports) by managers working under rather strict regulatory systems when compared to those working under rather lexible systems, although in the latter no rather scattered outco-mes have been found. In turn, Dye and Verrecchia (1995) argue, based on their research, that a pattern with greater discretion is more informative than a strict pattern. Ho-wever, such lexibility can increase opportunistic mana-gement of outcomes by preparers of inancial statements. Although there are empirical studies that evaluated the efects of regulatory changes on outcomes of inan-cial reports or on the interpretive behavior of a manager in translating economic events into accounting numbers (Agoglia et al., 2011; Collins et al., 2012; Dye, 1985; Dye & Verrecchia, 1995; Psaros & Trotman, 2004; Stolowy & Ding, 2003; Ashbaugh, 2001; Ashbaugh & Pincus, 2001; Nelson, 2003; Jamal & Tan, 2010; Donelson et al., 2012), there is little prior evidence of the impact of regulatory lexibility directly on the comparability of inancial re-he corporate scandals that occurred in tre-he
begin-ning of the last decade (e.g. Enron and WorldCom) and the subprime crisis in the USA rekindled an old debate between accountants on how accounting should be re-gulated: according to rather strict and speciic rules or rather lexible and generic principles – for more details see Merino and Coe (1978).
According to the Securities and Exchange Commis-sion (SEC) (2003), accounting standards may be gene-rally divided into two types: those based on rules and those based on principles. According to the entity, those based on principles are typically characterized by a con-tent rather aimed at the incon-tentions instead of the actions, i.e. there are general guidelines, but no detailed imple-mentation guide. In turn, the standards based on rules have a certain level of detail concerning their implemen-tation and greater compliance. Regarding this theme, Collins, Pasewark and Riley (2012) claim that, according to this characterization, for a given scenario of inancial reporting, standards based on principles require from a professional accountant greater judgment, while tho-se standards batho-sed on rules requiring greater expertitho-se in seeking legislative knowledge. Researchers claim that most accounting standards – either the U.S. or the In-ternational Financial Reporting Standards (IFRS) – have an extension based on rules, i.e. they contain rules that a certain entity must follow to report speciic transac-tions. However, they may vary in the speciicity degree (bright lines), where the more speciic (smaller space for judgment) are those based on rules and the less speciic (larger space for judgment) are those based on principles.
In the discussion between rules and principles there are arguments for both sides. hose who support prin-ciples claim they improve quality in the information en-vironment and not necessarily increase variability in the accounting outcomes (Silva, 2013; Agoglia, Doupnik, & Tsakumis, 2011; Donelson, McInnis, & Mergenthaler, 2012; Jamal & Tan, 2010; Mergenthaler, 2009; Stolowy & Ding, 2003; Psaros & Trotman, 2004; Iatridis, 2010). ho-se supporting rules point out the contrary: that without the latter, there is no comparability and managers might be susceptible to greater manipulation of outcomes (Sun-der, 2009; Schipper, 2003; D’Arcy, 2000). As noticeable in both arguments, the discussion revolves around the comparability of inancial reports. By adopting the IFRS around the world, many countries (e.g. Brazil, Germany, and China) have undergone a change from their rather speciic rule-based accounting standards, oten linked to tax issues, to principle-based standards – such as the IFRS (Tweedie, 2007) – and perhaps the main justiica-tion in a large part of the countries that decided to adopt the IFRS is increasing comparability between diferent countries.
ports. As this information feature is linked to quality of the information environment that, in turn, may afect proper functioning of the economy and the relationship between regulation and comparability has not been well established, yet, there emerges the guiding question of this paper: Which is the efect of regulatory lexibility on the comparability of inancial reports?
his is a critical issue both in the domain of the adop-tion of internaadop-tional standards and outside it. his pa-per, in general, may help pointing out the impact of a standard based on rules or principles concerning compa-rability that, according to Schipper (2003) and Kothari, Ramanna and Skinner (2010), is the very driving force through which accounting standards are created. In turn, regarding the convergence process there is a need to eva-luate to what extent a trade-of from external to inter-nal comparability takes place, i.e. there is no use in the foreign markets gaining an advantage in the allocation of capital if such a gain occurs at the expense of greater deiciency in the resource allocation process within this economy. he question is whether the gain in external comparability (between countries) empirically proved by some studies (Yip & Young, 2012; DeFond, Hu, Hung & Li 2011; Barth, Landsman, Lang & Williams, 2013) oc-curs at the expense of decreased internal comparability (between companies in the same country – within coun-try) generated by regulatory lexibility. To answer these practical questions, there is a need to examine how the regulatory lexibility process can impact comparability.
he main challenge of this research type is identifying a feasible window of accounting system change to
iso-late the efects of regulatory lexibility. Many European countries have experienced changes in their accounting systems with mandatory IFRS adoption in 2005. Ho-wever, there are few countries where this process was so clear and distributed as in Brazil. According to Car-valho and Salotti (2013), Brazil is a rare example of a country that has adopted the full international standard, not only concerning consolidated inancial statements, but also individual statements. What we notice, in the Brazilian case, is the gradual change from a completely rule-based accounting standard, linked to tax standar-ds and without much room for interpretation (Lopes, 2011; Lopes & Walker, 2010) to rather lexible accoun-ting standards and based on principles, such as the IFRS (Tweedie, 2007). According to the Foundation Institute for Accounting, Actuarial, and Financial Research and Ernst & Young (2013, p. 7), in Brazil there was a “change from rule-based accounting to principle-based accoun-ting.” According to these entities, regulatory lexibility increased the complexity of procedures for recognizing, measuring, and disclosing accounting information, thus, greater subjectivity and higher degree of judgment were provided to the statements. It is also worth noticing that this change occurred in isolation, i.e. the other variables that could impact the outcomes of inancial reports (and, as a consequence, comparability), such as incentives to managers, audit quality, level of enforcement, ownership structure, and institutional features (Holthausen, 2009) remained relatively constant within this period, making the Brazilian regulatory case the optimal example to in-vestigate this research question.
2 THEORETICAL FRAMEWORK
2.1 Concept of Comparability
he view of comparability used in this research is the same adopted by agencies that regulate accounting: the Fi-nancial Accounting Standards Board (FASB) and the Inter-national Accounting Standards Board (IASB). According to these entities:
Comparability is the qualitative feature that enables users to identify and grasp similarities and differences between the items. Unlike other qualitative features, comparability is not related to a single item. Comparison requires at least two items (Financial Accounting Stan-dards Board, 2010; International Accounting StanStan-dards Board, 2010).
According to Simmons (1967), with a view to make users able to efectively compare the economic and inan-cial performance of a company to another one or the same company, over time, there is a need that companies
of uniformity than actually comparability, according to the concept of the Financial Accounting Standards Board (2010) and the International Accounting Standards Board (2010).
he irst measurement of comparability that managed to capture the two dimensions (ex-ante and ex-post) of the phenomenon was recently developed by DeFranco,
Kotha-ri and Verdi (2011) and it was named as similaKotha-rity of the accounting function. According to these authors, the rea-soning underlying their model is grounded in the premise that the results provided by accounting are a translation of economic events to which an entity is subject, i.e. the ac-counting numbers are a function of economic events, whi-ch may be represented as follows:
Financial Statements i = fi [Economic Events]
In this function, i [ ] represents the accounting system of a irm i. DeFranco et al. (2011) state that two compa-nies have comparable accounting systems if, for the same type of economic event, they produce similar accounting outputs. his way of measuring comparability has a big advantage, because, unlike the indices of harmonization, which are measurements calculated having the accoun-ting model inputs as a basis (it is needed to calculate an index for each accounting policy), the model of similarity is a measurement of output, i.e. its number is a inal mea-surement of comparability (DeFranco et al., 2011).
To operationalize the measurement of comparabili-ty in the model by DeFranco et al. (2011) two pieces of information are required: proit and return. Proit repre-sents the inal product of the accounting system, where a large part of choices in a company is relected concerning the recognition and measurement of economic events to which it is subject. In turn, the return is the proxy adop-ted to represent the economic event. According to Beaver, Lambert and Ryan (1987), the accounting system recogni-zes economic events ater the recognition of stock prices, i.e. price relects faster economic events than proit (for empirical evidence see Aylward & Glen, 2000, and Ryan, 1995, and, in Brazil, Brugni, Fávero, Flores, & Beiruth, 2015, and Fávero, 2015). his representation allows us to infer that proit (inal result of the accounting translation in the economic event) has a direct relationship with re-turn (economic event), thus to obtain the measurement of comparability there is a need to calculate the time series of proit in relation to return. he linear coeicient and the slope coeicient of this line are the accounting func-tion of the company.
To achieve a measurement of comparability there is a need to calculate the accounting functions for compa-nies on an individual basis. hen, the economic event of a company is determined and we take advantage of func-tions of the other entities subject to the same economic events (e.g. companies in the same economic activity
sector). he inal measurement of comparability is the distance between these two functions given an economic event in common.
he model proposed by DeFranco et al. (2011) has its rationale linked to the concept of comparability under-lying the conceptual framework, i.e. comparability is the feature of accounting information that allows us to iden-tify similarities and diferences between the accounting functions of two or more companies (International Ac-counting Standards Board, 2010; Financial AcAc-counting Standards Board, 2010). hus, if two companies have the same set of economic events, the more comparable their accounting functions, the more similar their accounting numbers.
2.2 Standards Based on Rules or Principles
Although there is no complete diferentiation border between standards based on rules or principles, there is a key diference: their level of speciicity. Kothari et al. (2010) claim that, in an extreme view, under a regulatory system based on principles, regulators deine a range of principles and allow all interested parties to apply these principles in the speciic economic contexts found. Con-versely, in a system based on rules, regulators provide the same parties with detailed guides on how they should re-cognize, measure, and highlight the diferent economic contexts, minimizing the requirement to exert judgment by managers and other related parties.
In Figure 1 we observe the operation of the mecha-nics of the two types of regulatory standards regarding the accounting choices suitable to each of them. According to Kothari et al. (2010), the gradual border of inancial choices between regulators, boards, accountants, and au-ditors of the motivating patrimonial event up to the oc-casional accounting method chosen takes the shape of a deep funnel in principle-based standards and the shape of a shallow funnel in rule-based standards. he funnel shape and depth, in fact, relect the constraints of com-panies when applying their accounting policies. Such a limitation is a function of the autonomy degree to choose accounting policies guaranteed by the regulatory levels.
Kothari et al. (2010) claim that the idea, in theory, behind a principles-based system is setting broad limits of accounting choices and allowing companies, also their managers, auditors, and accountants to pursue accoun-ting practices within these limits. he reasoning behind such a regulatory strategy is that managers have speciic knowledge about the economic situation of their business, including regulatory, contractual, iscal, and political
en-vironments, therefore, they are able to meet more ade-quately the requirements of various contracting parties, as well as to take into account aspects that only providers of such information could make available when preparing their inancial reports. In turn, in the rule-based system, the behavior forms and accounting choices are dictated by regulatory standards in a speciic way, leaving the ma-nager without much room for innovation, given that she/ he might have to it her/his accounting policies in a fra-me that does not always relect the various nuances of the dynamic business environment concerned (Securities and Exchange Commission, 2003).
2.3 Previous Research Addressing Standards
Based on Rules or Principles and its Impact
on Financial Reports
Despite the discussion on lexibility versus standardi-zation is an old issue in the accounting scenario, it has gained an extra breath with the recent economic crises. Accounting frauds committed by the companies Enron and WorldCom raised an old argument about the
exis-Figure 1 Differences between the spectra of accounting choices in the regulatory system based on principles compared to the system based on rules.
tence of bright lines in the accounting standards based on rules (Kothari et al., 2010) and how the standards based on principles could solve such problems. Anchored in this debate, there emerged some papers seeking to analyze the impact of each type of system in theoretical and empiri-cal terms. he FASB in 2002 and the SEC in 2003 created committees to examine in greater depth the diference between standards based on rules or principles. Reports from the two committees reached similar conclusions. According to the Financial Accounting Standards Bo-ard (2002), the adoption of a regulatory system based on principles (rather than on rules) might result in a higher level of judgment on the part of those responsible for pre-paring inancial reports. his greater subjectivity, in turn, might lead to accounting policy choices that better relect the economic substance of transactions, increasing trans-parency, comparability, responsiveness to new phenome-na, and exchange of funds across borders. he Securities and Exchange Commission (2003) also concluded that the regulatory system based on principles is superior, but the entity provided a distinction between the traditional system based on principles and that based on goals, who-se efectiveness, according to the entity, is even bigger.
As for empirical papers addressing the diferences be-tween regulatory systems and their efects on the quality of accounting information or on how a manager deter-mines her/his accounting policies, what takes advanta-ge is also the standard based on principles. Webster and hornton (2004) analyzed the quality of accruals among reports from the Canadian companies that reported ac-cording to their local standard and the U.S. accounting principles (U.S. generally accepted accounting principles – USGAAP). he researchers concluded that the quality of accruals is higher in the regulatory system based on principles from Canada than in the system based on ru-les from the USA. Kohlbeck and Warield (2010) found, in turn, features in the system based on principles rela-ted to a higher quality of prediction by market analysts in their assessment reports. In turn, Mergenthaler (2009) has investigated the impact of the system based on rules on managing outcomes and found evidence that such a system has a signiicant relationship with the magnitude of management of outcomes and the likelihood that the manager is penalized by the market surveillance authority
is lower than in the principle-based system, i.e. in stricter regulatory system companies practice more management of outcomes and are less likely to be punished.
Another study that investigated the relationship be-tween the two accounting standard systems was Collins et al. (2012). he objective of this research was analyzing variation in the classiication of leasing operations in both types of regulations. Collins et al. (2012) found ro-bust evidence that companies subject to the USGAAP are more likely to classify their leasing operations as opera-tional than the companies subject to the IFRS. he rese-archers also found evidence that the outcomes reported according to the international standard are less dispersed when compared with the outcomes reported according to the USGAAP. his suggests that variability in the inal ou-tcome of inancial reports is lower in the principle-based system, something which contradicts the rationale of ru-le-based standards a little bit.
In the line of experimental studies, the results obtained also favor principle-based standards. Psaros and Trotman (2004) compared the judgments of management regar-ding the consolidation of accounting statements in two diferent regulatory environments, one tighter and ano-ther more lexible. Although both groups had the same incentive not to consolidate (and consolidation was the right response), the researchers were faced with a signi-icantly greater number of individuals who choose not to consolidate in the regulatory system based on rules when compared to the system based on principles. According to the authors, their indings contradict the arguments that inaccurate standards taking into account the substance under the form makes them less efective to ight biases in inancial reports when compared to rule-based standards. Corroborating the indings of Psaros and Trotman (2004), Agoglia et al. (2011) observed in their experiments that inancial directors subject to a more lexible regulatory system are less exposed to aggressive practices in inan-cial reporting than inaninan-cial directors in stricter systems. Overall, based on these studies, we notice the existence of a proven superiority of the standard based on principles over the standard based on rules. Regulatory lexibility may fail to reduce variability in the outcomes disclosed in the inancial reports, indeed, Collins et al. (2012) found the exact opposite.
3 RESEARCH DESIGN
Methodologically, this research may be classiied as descriptive and, predominantly, quantitative. Data are se-condary and they were collected resorting to the sotware Economática® and the websites of the Brazilian Securities Commission (CVM) and the Brazilian Securities,
2004 to 2012. To measure comparability, we adopted as a metrics the model similarity of the accounting function de-vised by DeFranco et al. (2011). To test the behavior of the variable concerning the regulatory lexibility, we chose the panel data statistical approach.
3.1 Comparability Measurement
he measurement of comparability used in this resear-ch was the similarity of accounting function proposed by DeFranco et al. (2011). As a measurement of output, the comparability obtained by means of this model has some advantages, such as increased robustness in statistical
analy-sis, lower bias of the researcher, and higher reliability in data collection. Moreover, it was widely used in recent studies on the theme (DeFranco et al., 2011; DeFond et al., 2011; Bar-th, Landsman, Lang & Williams, 2012; Brochet, Jagolinzer & Riedl, 2013; Lang, Mafett & Owens, 2010; Fang, Li, Xin & Zhang, 2012; Neel, 2013; Peterson, Schmardebeck & Wi-lks, 2012; Yip & Young, 2012; Barth et al., 2013; Sohn, 2011; Cascino & Gassen, 2012; Kim, Krat & Ryan 2013), and this already guarantees an external validation to it.
he irst step in the composition of such a metrics was estimating the individual accounting function of each com-pany based on the last 12 quarters by using this equation:
where:
ROAit = Quarterly net proit on the inal total assets of irm i for non-consolidated period t.
Returnit = Quarterly average return of irm i for pe-riod t, calculated having as a basis the close stock price of those with greater presence adjusted for dividends and splits.
he use of stocks with bigger presence aimed to avoid distortions in the measurement of comparability that could arise due to a potential lack of trading of some ordi-nary shares. To select the type of share, we calculated the average number of trading days. We selected the types of
share (ordinary or preferred) showing the greatest daily average presence within the period. Ater this selection, there was no exchange between the type of share from one quarter to another. his served to avoid the efect of such an exchange in return, as the prices of preferred and ordinary shares are diferent.
Ater estimating the parameters of individual func-tions, it was necessary to design the expected ROA – E(ROA) – for each company having the regressions ob-tained as a basis. First, it was necessary to estimate the expected ROA speciic to the company within the period according to this function:
ROA
it= α
i+ β
iReturn
it+
ε
it 1
E
(
ROA)
iit= α
i+ β
iReturn
it 2
E
(
ROA)
ijt= α
j+ β
jReturn
it 3Later, we calculated the expected ROA for the same company with the estimators of other companies in the same sec-tor, according to this equation:
he idea is maintaining a steady economic event, by using the estimators of a company in an economic event of another one, thus the measurement of comparability is the average distance between these two functions for each quarter – E(ROAiit) – E(ROAijt). According to DeFranco et
al. (2011), the closer the two functions, the greater compa-rability between companies.
To measure individual compability between pairs, we calculated the average proximity of each function for a pe-riod (quarter) according to this formula:
where:
Compbijt = Relative individual measurement of compa-rability for company i based on company j.
E(ROAiit) = Return on assets expected for company i ba-sed on the estimators of company i and the return of irm i within the period t.
E(ROAijt) = Return on assets expected for company i ba-sed on the estimators of company j and the return of irm i
within the period t.
he measurement of comparability obtained according to the equation above is a relative measurement, i.e. it me-asures the average distances between the functions of two isolated companies. For obtaining a measurement of gene-ral individual comparability with pairs in the sector there is a need to calculate the average of these distances between reference companies, according to this equation:
where:
COMPMit = Individual measurement of comparability for each company in relation to pairs in the sector.
Compbijt = Relative comparability measurement of each pair of companies.
n = Number of companies in the sector (or those under comparison).
In relation to the original model by DeFranco et al. (2011) there were three adjustments in this study: in the estimation period of individual functions (16 to 12 quar-ters), in the delator to determine the efect size (total as-sets), and in the measurement of proit used (due to the transition period, the measurement of operational proit originally employed has diferent elements before and ater the international standards). he objective of proit in the model of comparability is representing the set of accoun-ting choices made by the manager in a given period. he ideal might be using the comprehensive outcome, since this is the measurement that represents the largest number of possible accounting policies adopted by the manager. However, in this case, as the study period is prior to the IFRS adoption, this measurement did not exist, something which prevents its use. he second accounting measure-ment that covers more manager discretionary decisions is net proit, which, despite the possibility of being afected by leverage-related problems, constitutes a measurement that may be compared throughout the period before and ater adopting the international standard. Net proit was also employed in other studies, such as Yip and Young (2012) and Brochet et al. (2013). Yip and Young (2012) also used ROA in the same way as calculated in this rese-arch. Both in this research and in other studies adopting similar adaptations (Yip & Young, 2012; Lang et al. 2010; Cascino & Gassen, 2012; Brochet et al., 2013) no signii-cant bias was noticed in relation to the original measure-ment by DeFranco et al. (2011).
3.2 Researched Universe and Data Collection
he universe of companies used in this article was se-lected intentionally through the sotware Economática®. he irst selection needed was the primary country of research.
Having in mind that the aim of this article is identifying how regulatory lexibility impacts on comparability, we chose to use only one country to limit the efects of institutional and economic diferences on the results obtained. Brazil was the country chosen because a well-known process of regulatory lexibility has taken place in it in recent years.
he second selection was made in the economic activity sector under analysis. To choose sectors, level 2 of the North American Classiication System (NAICS) was used. Level 2 of the NAICS was used a large part of the studies investi-gating comparability within sectors (DeFranco et al., 2011; Yip & Young, 2012; Lang et al., 2010). he selected sectors were those with more than a company having quarterly data available from 2002 to 2012. he accounting function is es-timated through quarterly data for three years before the base period. herefore, to calculate the year 2004 data from early 2002 were needed.
Overall, nine sectors met this condition, excluding the banking sector, because banks do not ile their quarterly sta-tements in accordance with the IFRS. In the end, eight eco-nomic activity sectors were analyzed (heavy construction; electric power companies; transport equipment industry; metal products industry; textile industry; chemical indus-try; steelworks; and telecommunications). Embraer S.A. and Gerdau S.A. were excluded from the study because the irst has as its functional currency U.S. dollars and its acti-vities are primarily concentrated abroad, something which could distort comparability to the other companies in the sector. he second was excluded because it has a wholly ow-ned subsidiary in the same sector, something which could also bias the outcomes. In the end, a total of 54 companies with data in the time series between 2002 and 2012 were analyzed.
Ater determining the companies addressed in the analysis, it was time to collect the data needed for the stu-dy. To obtain all information needed to conduct the re-search we used: the sotware Economática® (for indicators and variables related to inancial and market statements), the site of the CVM (for data related to audit companies), and the site of the Bovespa (for information on corporate governance).
3.3 Data Analysis
he variable D.YEAR is qualitative and it was opera-tionalized with dummies for each year representing the period from 2005 to 2012 where the reference year was 2004. he year 2005 was chosen as the starting point, be-cause the irst rather concrete initiatives occurred in it (such as the creation of the Brazilian Accounting State-ments Committee (CPC) and the issuance of CPC 01 on the impairment test) regarding the convergence of Bra-zil to the international standard. he remaining periods prior to the year 2010 represent the regulatory transition period and since 2010 the period is regarded as full-IFRS. he year 2004 was chosen as a base, because it is a relati-vely recent period and prior to the efect of convergence to the IFRS. As it takes three previous years of data to cal-culate the accounting function, going back a longer time might cause a considerable decrease of companies with data available to analysis.
In turn, regarding the control variables, theoretically the measure of comparability used in this research has a
very close relationship to accounting choice theories and quality of proits. For instance, the variable Earnings per share (EPS) is a measurement that relects company’s per-formance to a shareholder and it is widely used in con-tracts with variable remuneration for managers (Ittner, Larcker & Rajan, 1997; Young & Yang, 2011). Due to this fact, in order to achieve a speciied proitability goal, ma-nagers may engage in accounting practices that do not re-lect the economic reality of their business, thus afecting the comparability of inancial reports.
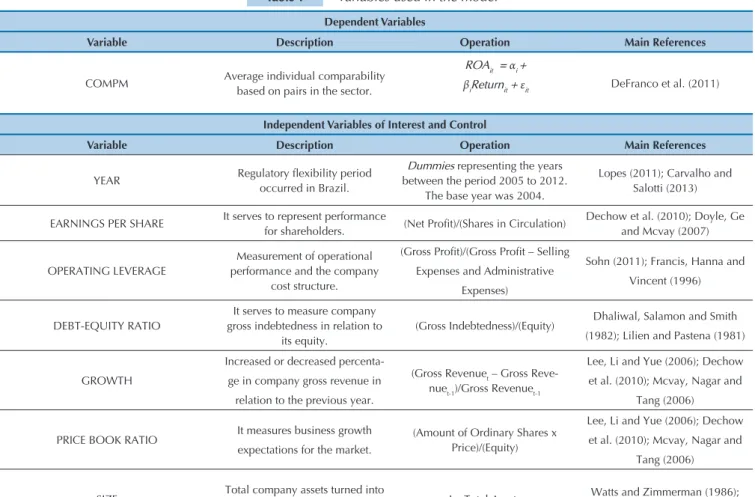
Dechow, Ge and Schrand (2010) distribute the deter-minants of proit quality into six categories: (i) companies’ characteristics; (ii) inancial reporting practices; (iii) go-vernance and control mechanisms; (iv) audit; (v) capital market incentives; and (vi) external factors. In this article, the practical categories of inancial reports and external factors are already naturally controlled by the sectors. he other variables, with their references, are displayed in Ta-ble 1.
Comparability = f (D.YEAR; Controls)
Table 1 Variables used in the model Dependent Variables
Variable Description Operation Main References
COMPM Average individual comparability
based on pairs in the sector.
ROAit = αi +
βiReturnit + εit DeFranco et al. (2011)
Independent Variables of Interest and Control
Variable Description Operation Main References
YEAR Regulatory lexibility period
occurred in Brazil.
Dummies representing the years between the period 2005 to 2012.
The base year was 2004.
Lopes (2011); Carvalho and Salotti (2013)
EARNINGS PER SHARE It serves to represent performance
for shareholders. (Net Proit)/(Shares in Circulation)
Dechow et al. (2010); Doyle, Ge and Mcvay (2007)
OPERATING LEVERAGE
Measurement of operational performance and the company
cost structure.
(Gross Proit)/(Gross Proit – Selling
Expenses and Administrative Expenses)
Sohn (2011); Francis, Hanna and Vincent (1996)
DEBT-EQUITY RATIO
It serves to measure company gross indebtedness in relation to
its equity.
(Gross Indebtedness)/(Equity) Dhaliwal, Salamon and Smith
(1982); Lilien and Pastena (1981)
GROWTH
Increased or decreased percenta-ge in company gross revenue in relation to the previous year.
(Gross Revenuet – Gross Reve
-nuet-1)/Gross Revenuet-1
Lee, Li and Yue (2006); Dechow et al. (2010); Mcvay, Nagar and
Tang (2006)
PRICE BOOK RATIO It measures business growth
expectations for the market.
(Amount of Ordinary Shares x Price)/(Equity)
Lee, Li and Yue (2006); Dechow et al. (2010); Mcvay, Nagar and
Tang (2006)
SIZE Total company assets turned into
a logarithmic base. Ln Total Assets
Watts and Zimmerman (1986); Doyle et al. (2007)
Table 1 Contin.
Source: Prepared by the authors.
Table 2 Results of individual financial functions
Variable Obs. Average S. Deviation P10% Median P90%
Intercept 486 1.427 2.667 -1.112 1.500 4.295
Coeficient 486 0.014 0.063 -0.026 0.005 0.065
R2 486 0.109 0.144 0.002 0.060 0.297
As there is no robust study addressing which are the company characteristics able to afect the comparability of inancial reports, this research resorted to papers rela-ted to accounting choices and proit quality to select its control variables.
Concerning the panel model, this may be classiied as short (larger number of individuals than years) and strongly balanced (all individuals were maintained over the years). he technique chosen in model estimation was pooled ordinary least square (POLS), since it has proved to be more suitable than the model that takes into account the existence of random efects, according to the
outcome of the Breusch-Pagan LM Test.
Before data processing, a multivariate treatment for outliers was conducted with data. he technique em-ployed was that proposed by Hadi (1992) and, as the purpose of this research is checking the behavior trend over the years measuring comparability, the existence of outliers could afect the outcomes. Even so, for compa-rative purposes, the results working with and without treatment of outliers were tabulated, as recommended by Wooldridge (2013). According to the results obtained (not shown), there was no signiicant distortion in re-gressors.
RISK Annual company beta (365 days). | Beta | Dechow et al. (2010); Watts and
Zimmerman (1986)
CAPITAL INTENSITY It measures the level of capital
tangibility. (Permanent Assets)/(Equity)
Himmelberg, Hubbard and Palia (1999)
PRESENCE It measures liquidity. (Number of days with shares
tra-ded)/( Total number of trading days) Watts and Zimmerman (1986)
GOVERNANCE
It measures if the company adhe-red to some level of corporate
governance in Bovespa.
Dummy variable with 2 categories: it has (1) or it does not have (0) a
level of governance
Doyle et al. (2007); Ashbaugh, Collins, Kinney and LaFond
(2008)
CONCENTRATION
Percentage of ordinary shares held by the company’s largest
shareholder.
% ordinary shares concentrated on the hands of the largest shareholder
LaFond and Roychowdhury (2008)
BIG4 Firm auditing the balance in the
given period.
Dummy variable with 2 categories: audited by a BIG4 (1) and not
audited by a BIG4 (0)
Lawrence, Minutti-Meza and Zhang (2011)
AUDITOR CHANGE
Dichotomous variable measuring if the company changed auditors in relation to the previous period.
Dummy variable with 2 categories: changed (1) and did not change (0)
the audit irm
Lawrence, Minutti-Meza and Zhang (2011)
SECTOR NAICS classiication level 2.
Dummies representing the eight sectors: Electric Power (Reference); Construction; Transport Equipment Ind.; Metal Products Ind.; Textile
Ind.; Chemical Ind.; Steelworks; and Telecommunications
Verrecchia and Weber (2006); Bagnoli and Watts (2010)
Obs.: For companies with negative equity, the indicators related to such data were not calculated, leaving the observation with missing value in this information. For further development in the justification and rationale behind the choice of these control variables see the thesis by Ribeiro (2014).
Source: Prepared by the authors.
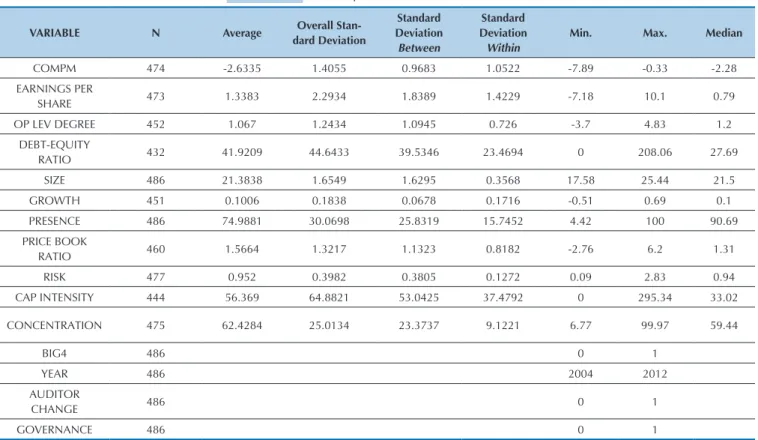
Based on Table 3, it may be initially observed that the variable related to time (YEAR) is invariant between companies (standard deviation between equal to zero), since data are shown as a strongly unbalanced panel. Furthermore, although the variations between and wi-thin have almost the same magnitude for the dependent variable, the other variables (explanatory in the model proposed) show greater variation between than within, except for the variables GROWTH and AUDITOR CHANGE. hus, POLS models were estimated and con-sidering both ixed and random efects through diferent types of estimation, because while a certain variable with higher variance within (e.g. the variable GROWTH) can lead the model estimated through ixed efects to be the most suitable, by considering that the terms of the in-tercept are correlated with this variable, another variable with greater variance between (e.g. the variable PRICE BOOK RATIO) can lead, but not necessarily, the model
estimated through random efects to be the most suita-ble, by considering that the terms of the intercept are not correlated with terms of the idiosyncratic panel error. In the end, the POLS model was more robust before the sui-tability tests and it was shown in this research.
he results obtained in this research to measure com-parability based on companies in the same sector (COM-PM = -2.634) were very similar to those obtained by stu-dies previously conducted in other countries. DeFranco et al. (2011), Fang et al. (2012), and Sohn (2011) found average values of -2.7, -2.03, and -1.907, respectively, in their analysis with U.S. companies. In turn, Peterson et al. (2012), who analyzed the European companies listed in the U.S. stock market, found an average of -2.597. hese results demonstrate that the measurement of comparabi-lity obtained in this study is in line with the same measu-rements achieved at the international level, i.e. no biases were found due to adaptations proposed in this research. Before analyzing the descriptive statistics of the
va-riables took into account in the survey, the outcomes of the elements of individual accounting functions of the companies used in this study and estimated according to Equation 1 (Table 2) were demonstrated. DeFranco et al. (2011), in a sample with 71,295 observations in the Uni-ted States, found an average R2 for individual functions of
0.1218, a value of 0.0026 for companies within the 10% percentile and a value of 0.3217 for companies within the 90% percentile. What may be drawn from such an analy-sis is that the values of individual functions of the Brazi-lian companies adopted in this study were similar to the values of elements of functions of the U.S. companies in the original paper by DeFranco et al. (2011).
Table 3 Descriptive statistics of the variables
VARIABLE N Average Overall Stan-dard Deviation
Standard Deviation Between
Standard Deviation Within
Min. Max. Median
COMPM 474 -2.6335 1.4055 0.9683 1.0522 -7.89 -0.33 -2.28
EARNINGS PER
SHARE 473 1.3383 2.2934 1.8389 1.4229 -7.18 10.1 0.79
OP LEV DEGREE 452 1.067 1.2434 1.0945 0.726 -3.7 4.83 1.2
DEBT-EQUITY
RATIO 432 41.9209 44.6433 39.5346 23.4694 0 208.06 27.69
SIZE 486 21.3838 1.6549 1.6295 0.3568 17.58 25.44 21.5
GROWTH 451 0.1006 0.1838 0.0678 0.1716 -0.51 0.69 0.1
PRESENCE 486 74.9881 30.0698 25.8319 15.7452 4.42 100 90.69
PRICE BOOK
RATIO 460 1.5664 1.3217 1.1323 0.8182 -2.76 6.2 1.31
RISK 477 0.952 0.3982 0.3805 0.1272 0.09 2.83 0.94
CAP INTENSITY 444 56.369 64.8821 53.0425 37.4792 0 295.34 33.02
CONCENTRATION 475 62.4284 25.0134 23.3737 9.1221 6.77 99.97 59.44
BIG4 486 0 1
YEAR 486 2004 2012
AUDITOR
CHANGE 486 0 1
GOVERNANCE 486 0 1
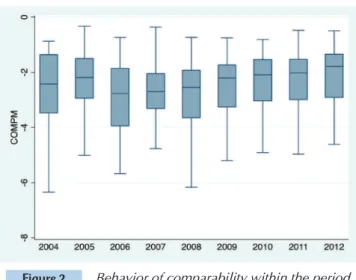
Figure 2 Behavior of comparability within the period examined in the research.
Source: Prepared by the authors.
Regarding the behavior of comparability within the transition period, as observed in Figure 2, in general terms, a slight increase was observed in average comparability be-tween the years 2004 and 2005. his growth was followed by a decline to the same extent during the early transition pe-riod reversed since 2008, a pepe-riod coinciding with the shar-pest eforts (larger number of CPC statements) to adopt the international standard in Brazil. Concerning the companies with worse comparability measurements, we noticed a gain in comparability ater 2004, remaining stable within the transition period and the introduction of the IFRS. In turn, for higher comparability, their behavior showed a decrea-se within the early years of transition and a recovery ater 2008, a behavior similar to the overall average. It is inferred, through this evaluation, that the behavior of comparability of companies with higher measurements is diferent from the behavior of companies with the worse comparability within the transition period. Comparability measurements
focused on the 90% percentile apparently sufered greater variation with regulatory changes during the years 2004 to 2012. his behavior was also observed in the overall avera-ge. For measurements focused on the 10% percentile there were no marked variations in the transition period. What may be concluded from these results is that, in general and without considering other factors that could inluence the relationship of comparability, there was a transient loss of comparability during the early regulatory transition period only for companies that have demonstrated a higher level of comparability. For the worst companies and those with average levels, these diferences were not so clear.
It is noteworthy that the subprime crisis triggered in the USA may have, in a way, impacted the outcomes of measu-ring comparability (having in mind that this measurement used market return on its composition). Although the crisis has produced a greater shock in the years 2007 and 2008 and decrease in the level of comparability has begun on ave-rage in the year 2006, Costa, Reis and Teixeira (2012) point out that in the period 2007 and 2008, in Brazil, the rele-vance of proit for the market was signiicantly lower when compared to the other years without crisis. Silva (2013) also shows in a thesis that there was a considerable increase in the exercise of discretion by managers during two periods in Brazil. he irst period was during the crisis (2007 and 2008) and the second took place in the irst year of adoption of the international standard (2010).
It becomes clear in Figure 2 that the comparability level was lower in the years 2007 and 2008, but not in the year 2010, even though this has been a period with much use of discretionary accruals (Silva, 2013). his aspect allows us to infer that perhaps there was an efect of the crisis on the measurement of comparability that coincided with the regulatory transition period. However, as described above, this efect was only observed for companies with higher le-vels of comparability. On average, it was not clear.
Table 4 Results of the multivariate model
COMPM Years Full Stepwise
Coef. t Coef. t Coef. t
2005 0.3239 2.09** 0.4079 1.86*
2006 -0.2063 -0.82 0.0467 0.14
2007 0.0001 0.00 0.4247 1.52
2008 -0.1279 -0.55 0.0068 0.03
2009 0.0135 0.06 0.4249 1.36
2010 0.2690 1.02 0.4458 1.27
2011 0.3736 1.35 0.6233 1.87* 0.4122 2.51**
2012 0.4310 1.57 0.7516 2.41** 0.5496 3.53***
EARNINGS PER
SHARE 0.0165 0.39
OP LEV DEGREE 0.2547 4.70*** 0.2719 5.16***
DEBT-EQUITY
RATIO 0.0035 1.23
SIZE 0.0364 0.40
GROWTH 0.0000 0.00
Obs.: * / ** / *** denote two-tailed significance levels at 0.10/0.05/0.01, respectively. The regressions above were estimated with OLS. In the full model we used the option with robust clustered standard errors in individuals. In the stepwise model we adopted the backward criteria with a 0.05 cutoff. The constant absorbed the following categories for dummy variables: YEAR = 2004, AUDITOR CHANGE = No and GOVERNANCE = No, BIG4 = No, SECTOR = ELECTRIC POWER. The models were obtained through the following equation and they vary according to the presence of controls:
COMPMi,t = β0 + β12005i,t + β22006i,t + β32007i,t + β42008i,t + β52009i,t + β62010i,t + β72011i,t + β82012i,t + βnControl Variablesi,t + εi,t
Source: Prepared by the authors.
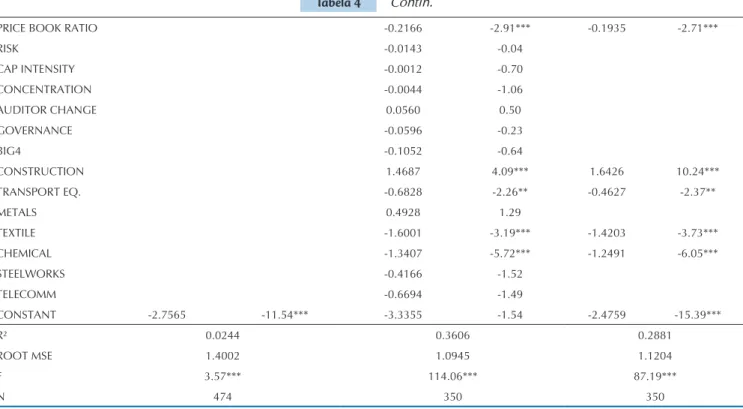
Tabela 4 Contin.
PRICE BOOK RATIO -0.2166 -2.91*** -0.1935 -2.71***
RISK -0.0143 -0.04
CAP INTENSITY -0.0012 -0.70
CONCENTRATION -0.0044 -1.06
AUDITOR CHANGE 0.0560 0.50
GOVERNANCE -0.0596 -0.23
BIG4 -0.1052 -0.64
CONSTRUCTION 1.4687 4.09*** 1.6426 10.24***
TRANSPORT EQ. -0.6828 -2.26** -0.4627 -2.37**
METALS 0.4928 1.29
TEXTILE -1.6001 -3.19*** -1.4203 -3.73***
CHEMICAL -1.3407 -5.72*** -1.2491 -6.05***
STEELWORKS -0.4166 -1.52
TELECOMM -0.6694 -1.49
CONSTANT -2.7565 -11.54*** -3.3355 -1.54 -2.4759 -15.39***
R² 0.0244 0.3606 0.2881
ROOT MSE 1.4002 1.0945 1.1204
F 3.57*** 114.06*** 87.19***
N 474 350 350
Table 4 displays the outcomes of the impact of the regulatory transition period on the average individual comparability (COMPM). As we can see, the full model has an explanatory power of 0.3606. his number is simi-lar to those obtained by studies related to this research (DeFranco et al., 2011, found an average of 20% in their models; DeFond et al., 2011, an average of 36%; and Yip & Young, 2012, an average of 34.1%). he overall signi-icance of the model was also robust at a 0.01 signiican-ce level. Ramsey’s test and VIF statistics showed that the model has no omitted variable bias (F = 1.09; Prob > F = 0.3527), nor multicollinearity problems (Fávero, 2015). he average statistics of the variance inlation factor was 2.02 and the variable with highest VIF was Size (4.38) and it was far below the 10 recommended for multicolli-nearity problems (Wooldridge, 2013).
We notice, having the outputs obtained as a basis, that there was no signiicant loss of comparability in any mo-del over the period analyzed. During the regulatory tran-sition (2005 to 2009) there were no negative signiicant diferences. Ater the IFRS adoption, in the full model and in stepwise, signiicant and positive outcomes were found for the years 2011 and, especially, 2012 (period regarded as full-IFRS due to the fact that individual inancial func-tions have been estimated only by using data since 2010). Concerning the control variables, the sectors, the degree of operational leverage, and the price-to-book indicator (PBR) were signiicant. he degree of operational
gro-wth rate or potential grogro-wth. his gives managers greater motivation to manage outcomes and it apparently afects the comparability of their inancial reports.
he last signiicant control variable were the econo-mic activity sectors. he low R2 obtained with the mo-del without controls (0.02) when compared to the momo-del with these variables and the number of sectors with sig-niicant diferences in relation to the base sector in the model constitutes strong evidence that the behavior of comparability was not homogeneous within the various economic activity sectors.
he sectors with higher average values for comparabi-lity were heavy construction, metal industry, steelworks, and electric power, respectively. he sectors of electric power, heavy construction, and metal industry showed rather concentrated values for measuring comparabili-ty. he sectors showing the less dispersed measurements were also those with higher levels of comparability (ex-cept steelworks, which had a relatively low average, but a high dispersion between quartiles). A possible reason for the existence of signiicant diferences between sectors is the level of competitiveness within them. According to Datta, Iskandar-Datta and Singh (2013), the companies operating in more competitive sectors are more likely to manage outcomes. Corroborating Datta et al. (2013), Verrecchia and Weber (2006) found evidence that the le-vel of transparency in sectors with greater competition decreases signiicantly. Besides competitiveness, Bagnoli and Watts (2010) indicate other factors related to secto-ral characteristics which could inluence the level of ma-nagement of outcomes. he researchers found empirical evidence in their study that companies having similar production technologies, whose production is governed by chemical or physical procedures (in contrast to the services sector), and the companies operating in matu-re markets amatu-re less prone manage outcomes. he authors have also found that irms with a larger product portfolio manage more their proits.
he outputs obtained in Table 4 may be associated with discoveries by Datta et al. (2013), Verrecchia and Weber (2006) and Bagnoli and Watts (2010). he sector with the smallest number of companies, i.e. lowest com-petitiveness, in this research was heavy construction (3), and it showed the highest level of comparability. Another sector regarded as having low competitiveness is elec-tric power. Although it has a larger number of compa-nies than the other sectors, the activity of generating and distributing electric power in Brazil is highly regulated and the companies are required to comply with market guidelines dictated by a regulatory agency. his aspect may decrease the level of competitiveness in the sector.
he sectors that obtained the worst average values in the levels of comparability were the clothing industry and the chemical industry. hese economic activities, unlike sectors such as electric power and heavy construction, have a large portfolio of products and they allow greater diversiication of sub-activities in the same classiication. For instance, a company that manufactures clothes has a range of options much more diversiied in its production (canvas, fabrics, clothing, etc.) than a company produ-cing and distributing electric power. his greater diversi-ty of products and activities may have reduced the level of comparability between companies in such sectors.
To inish, as noticed by Silva (2013), in the years 2007, 2008, and 2010 there was a great increase in the level of use of discretionary accruals by managers responsible for preparing the inancial reports of listed Brazilian com-panies. he results obtained having the model of Table 4 as a basis demonstrate that, although there was a higher level of subjectivity during the transition period (either due to regulatory lexibility or as a result of the crisis period), there was no signiicant loss of comparability. hese indings are consistent with outcomes obtained in previous research and they show that regulatory lexibi-lity does not have a negative impact on comparabilexibi-lity, on the contrary: their efect is seemingly positive. Agoglia et al. (2011) in their experiment regarding the standard on leasing, found a signiicantly lower variation between the decisions by preparers of inancial reports in an environ-ment with less accurate accounting standards. According to the authors, this suggests that, unlike what is advoca-ted by some parties relaadvoca-ted to the accounting regulatory process, applying accounting standards rather focused on principles instead of rules does not result in lower com-parability. In the same vein, Collins et al. (2012) found that the dispersion of leasing classiication between the IFRS and the U.S. standard is not higher. he researchers recommend, based on the results of their research, that the concerns expressed by the Securities and Exchange Commission (2003) and Sunder (2009) in relation to the increased dispersion of accounting outcomes in face of the use of regulations based on principles are unjustiia-ble. Dye and Verrecchia (1995) follow the same line and indicate that the lexibility of an accounting standard is needed so that managers can diferentiate their busines-ses and their various nuances to investors. he concept of comparability advocated for by the Financial Accounting Standards Board (2010) and the International Accoun-ting Standards Board (2010) observes these diferences and, as seen through the results of this research, the me-asurement of comparability had a signiicant gain with regulatory lexibility.
5 FINAL REMARKS
Adopting international standards in the Brazilian ac-counting context greatly increased the need for judgment
re-Agoglia, C., Doupnik, T., & Tsakumis, G. (2011). Principles-based versus rules-based accounting standards: the influence of standard precision and audit committee strength on financial reporting decisions. The Accounting Review, 86(3), 747-767. Ashbaugh, H. (2001). Non-US firms’ accounting standard choices.
Journal of Accounting and Public Policy, 20, 129-153.
Ashbaugh, H., Collins, D. W., Kinney, W. R., & Lafond, R. (2008). The effect of sox internal control deficiencies and their remediation on accrual quality. The Accounting Review, 83(1), 217-250.
Ashbaugh, H., & Pincus, M. (2001). Domestic accounting standards, international accounting standards, and the predictability of earnings. Journal of Accounting Research, 39(3), 417-434. Aylward, A., & Glen, J. (2000). Some international evidence on stock
prices as leading indicators of economic activity. Applied Financial Economics, 10, 1-14.
Bagnoli, M., & Watts, S. G. (2010). Oligopoly, disclosure, and earnings management. The Accounting Review, 85(4), 1191-1214.
Ball, R. (2006). International Financial Reporting Standards (IFRS): pros and cons for investors. Accounting and Business Research, 5-27.
Barth, M. E., Landsman, W. R., Lang, M., & Williams, C. (2012). Are IFRS-based and US GAAP-based accounting amounts comparable? Journal of Accounting and Economics, 54(1), 68-93. Barth, M. E., Landsman, W. R., Lang, M. H., & Williams, C. D. (2013).
Effects on comparability and capital markets benefits of voluntary adoption of IFRS by US firms: insights from voluntary adoption of IFRS by non-US firms (working paper). Stanford, CA: Rock Center for Corporate Governance.
Beaver, H., Lambert, R. A., & Ryan, S. G. (1987). The information content of security prices: a second look. Journal of Accounting and Economics, 9, 139-157.
Brochet, F., Jagolinzer, A. D., & Riedl, E. J. (2013). Mandatory IFRS adoption and financial statement comparability. Contemporary Accounting Research, 30(4), 1373-1400.
References
placed a standard based on rules and having a strong link with iscal accounting by a standard based on principles with an emphasis on transparency, fundamentals of the IFRS. he main objective of this research was investiga-ting how the regulatory lexibility process that culminated in IFRS adoption in Brazil afected the level of compara-bility within country in companies operating in the Bra-zilian market.
he results obtained in the study concerning compa-rability between various companies operating in the same economic activity sector (COMPM) were stable during the transition period and they increased signiicantly af-ter the adoption of inaf-ternational standards. Although this research has found various speciic behaviors for compa-nies with higher levels of comparability and between the diferent sectors of economic activities, generally no sig-niicant losses were observed in the level of comparability (COMPM) during the regulatory transition period, on the contrary: on average, there was a signiicant increase in the year 2012 (regarded as full-IFRS because it addres-ses only data ater 2010) when compared to the year 2004. he results obtained in this paper meet the research objective of investigating how comparability reacted to the lexibility process of accounting standards that took place in Brazil in recent years and empirically validate the hypothesis that increasing the discretionary power of a ma-nager does not decrease comparability of inancial reports. his research found strong empirical evidence that incre-ased lexibility in the accounting standards that took place in recent years in Brazil did not afect the comparability of inancial reports of companies evaluated now. hese in-dings are in line with Dye and Verrecchia (1995). Accor-ding to them, when accounting principles (generally ac-cepted accounting principles – GAAP) are strict, all irms should apply the same accounting procedure (e.g. resear-ch and development costs should be included in expen-ses within the period). In contrast, when the GAAP allow complete discretion, all economically viable procedure is allowed. Dye and Verrecchia (1995) highlight that when the GAAP have such a rich variety of procedures, the
pro-its of various companies, irst, should be more compara-ble than when the accounting standard is strict. his is so because, if each company selects an accounting procedure suitable to its economic circumstances, one dollar in ac-counting proit is equal to one dollar in economic gain, resulting in accounting proits more comparable between companies.
Just as in Collins et al. (2012) and Agoglia et al. (2011), this research has shown that the arguments of those advo-cating for a strict regulation to achieve comparability are refuted. he results obtained in this research legitimized this viewpoint and proved empirically that, with increa-sed regulatory lexibility, comparability has not decrea-sed, on the contrary, the increased discretionary power of a manager derived from the transition to internatio-nal standards in Brazil, in general, increased signiicantly the comparability between inancial reports of companies analyzed in this research.
Like any scientiic work, this paper also has some limi-tations. he sample is not probabilistic, something whi-ch prevents the generalization of results. he accounting efects of policies that go through the comprehensive re-sult are beyond the scope of this measurement. Although the comprehensive result may carry the efects of accoun-ting policies that are relevant to measure the performance of a company, this study chose to use proit for two main reasons. First, the empirically comprehensive result does not relect a measurement of performance higher than proit for the period (Dhaliwal, Subramanyam & Treze-vant, 1999) and second, before adopting international standards in Brazil, this was not a measure usually adop-ted.
Brugni, T. V., Fávero, L. P. L., Flores, E. S., Beiruth, A. X. (2015). O vetor de causalidade entre o lucro contábil e o preço das ações: existem incentivos para informação contábil seguir o preço no Brasil? Revista Contabilidade Vista & Revista, 26(1), 79-103. Carvalho, L. N., & Salotti, B. M. (2013). Adoption of IFRS in
Brazil and the consequences to accounting education. Issues in Accounting Education, 28(2), 235-242.
Cascino, S., & Gassen, J. (2012). What drives the comparability effect of mandatory IFRS adoption? (working paper). Rochester, NY: Social Science Research Network.
Cole, V., Branson, J., & Breesch, D. (2012). The uniformity: flexibility dilemma when comparing financial statements – views of auditors, analysts and other users. International Journal of Accounting & Information Management, 20(2), 114-141. Collins, D. L., Pasewark, W. R., & Riley, M. E. (2012). Financial
reporting outcomes under rules-based and principles-based accounting standards. Accounting Horizons, 26(4), 681-705. Costa, F. M., Reis, D. J. S., & Teixeira, A. M. C. (2012). Implicações
de crises econômicas na relevância da informação contábil das companhias brasileiras. REPeC, 6(2), 141-153.
D’Arcy, A. (2000, janeiro). The degree of determination of national accounting system: an empirical investigation. Schmalenbach Business Review, 52, 45-67.
Datta, S., Iskandar-Datta, M., & Singh, V. (2013). Product market power, industry structure, and corporate earnings management.
Journal of Banking & Finance, 37(8), 3273-3285.
Dechow, P., Ge, W., & Schrand, C. (2010). Understanding earnings quality: a review of the proxies, their determinants and their consequences. Journal of Accounting and Economics, 50(2-3), 344-401.
DeFond, M., Hu, X., Hung, M., & Li, S. (2011). The impact of mandatory IFRS adoption on foreign mutual fund ownership: the role of comparability. Journal of Accounting and Economics, 51(3), 240-258.
DeFranco, G., Kothari, S. P., & Verdi, R. S. (2011). The benefits of financial statement comparability. Journal of Accounting Research, 49(4), 895-931.
Dhaliwal, D. S., Salamon, G. L., & Smith, E. D. (1982). The effect of owner versus management control on the choice of the accounting methods. Journal of Accounting and Economics, 4, 41-53.
Dhaliwal, D., Subramanyam, K. R., & Trezevant, R. (1999). Is comprehensive income superior to net income as a measure of firm performance? Journal of Accounting and Economics, 26(1-3), 43-67.
Donelson, D. C., McInnis, J. M., & Mergenthaler, R. D. (2012). Rules-based accounting standards and litigation. The Accounting Review, 87(4), 1247-1279.
Doyle, J., Ge, W., & McVay, S. (2007). Determinants of weaknesses in internal control over financial reporting. Journal of Accounting and Economics, 44(1-2), 193-223.
Dye, R. A. (1985). Strategic accounting choice and the effects of alternative financial reporting requirements. Journal of Accounting Research, 23(2), 544-575.
Dye, R. A., & Verrecchia, R. (1995). Discretion vs. uniformity: choices among GAAP. The Accounting Review, 70(3), 389-415.
Fang, X., Li, Y., Xin, B., & Zhang, W. J. (2012). Accounting comparability and loan contracting (working paper). Rochester, NY: Social Science Research Network.
Fávero, L. P. (2015). Análise de dados: modelos de regressão com Excel, Stata e SPSS. Rio de Janeiro: Elsevier.
Financial Accounting Standards Board. (2002). Proposal for a principles-based approach to U.S. standard setting. Norwalk, CT: FASB.
Financial Accounting Standards Board. (2010, September). Statement of financial accounting concepts no. 8: conceptual framework for financial reporting. Norwalk, CT: FASB.
Francis, J., Hanna, J. D., & Vincent, L. (1996). Causes and effects of discretionary asset write-offs. Journal of Accounting Research, 34(Suplemento), 117-134.
Fundação Instituto de Pesquisas Contábeis, Atuariais e Financeiras, & Ernst & Young. (2013). Análise sobre o IFRS no Brasil (3a. ed.). São Paulo: Ernst & Young.
Hadi, A. S. (1992). Identifying multiple outliers in multivariate data.
Journal of the Royal Statistical Society, 54(3), 761-771.
Himmelberg, C. P., Hubbard, R. G., & Palia, D. (1999). Understanding the determinants of managerial ownership and the link between ownership and performance. Journal of Financial Economics, 53(3), 353-384.
Holthausen, R. W. (2009). Accounting standards, financial reporting outcomes, and enforcement. Journal of Accounting Research, 47(2), 447-458.
Iatridis, G. (2010). International financial reporting standards and the quality of financial statement information. International Review of Financial Analysis, 19(3), 193-204.
International Accounting Standards Board. (2010). The conceptual framework for financial reporting. London: IASB.
Ittner, C. D., Larcker, D. F., & Rajan, M. V. (1997). The choice of performance measures in annual bonus contracts. The Accounting Review, 72(2), 231-255.
Jamal, K., & Tan, H. (2010). Joint effects of principles-based versus rules-based standards and auditor type in constraining financial managers’ aggressive reporting. The Accounting Review, 85(4), 1325-1346.
Kim, S., Kraft, P., & Ryan, S. G. (2013). Financial statement comparability and credit risk (working paper). New York: Stern School of Business.
Kohlbeck, M., & Warfield, T. (2010). Accounting standard attributes and accounting quality: discussion and analysis. Research in Accounting Regulation, 22(2), 59-70.
Kothari, S. P., Ramanna, K., & Skinner, D. J. (2010). Implications for GAAP from an analysis of positive research in accounting. Journal of Accounting and Economics, 50(2-3), 246-286.
Lafond, R., & Roychowdhury, S. (2008). Managerial ownership and accounting conservatism. Journal of Accounting Research, 46(1), 101-135.
Lang, M. H., Maffett, M., & Owens, E. (2010). Earnings comovement and accounting comparability: the effects of mandatory IFRS adoption (working paper). Rochester, NY: Social Science Research Network.
Lawrence, A., Minutti-Meza, M., & Zhang, P. (2011). Can big 4 versus non-big 4 differences in audit-quality proxies be attributed to client characteristics? The Accounting Review, 86(1), 259-286. Lee, C.-W. J., Li, L. Y., & Yue, H. (2006, May). Performance, growth
and earnings management. Review of Accounting Studies, 11, 305-334.
Lilien, S., & Pastena, V. (1981). Intramethod comparability: the case of the oil and gas industry. The Accounting Review, 56(3), 690-703. Lopes, A. B. (2011). Teaching IFRS in Brazil: news from the front.
Accounting Education, 20(4), 1-9.
Lopes, A. B., & Walker, M. (2010). Firm-level incentives and the informativeness of accounting reports: an experiment in Brazil (working paper). Rochester, NY: Social Science Research Network. Madsen, P. E. (2011). How standardized is accounting? The Accounting
Review, 86(5), 1679-1708.
McVay, S., Nagar, V., & Tang, V. W. (2006). Trading incentives to meet the analyst forecast. Review of Accounting Studies, 11(4), 575-598. Mergenthaler, R. D. (2009). Principles-based versus rules-based
standards and earnings management (working paper). Iowa City, IA: University of Iowa.
Merino, B. D., & Coe, T. L. (1978, agosto). Uniformity in accounting: a historical perspective. The Journal of Accountancy, 62-69. Neel, M. (2013). Accounting comparability and economic outcomes of
mandatory IFRS Adoption (working paper). Rochester, NY: Social Science Research Network.
Nelson, M. W. (2003). Behavioral evidence on the effects of principles- and rules-based standards. Accounting Horizons, 17(1), 91-104. Peterson, K., Schmardebeck, R., & Wilks, J. T. (2012). Accounting
comparability and earnings attributes (working paper). Rochester, NY: Social Science Research Network.
Psaros, J. I. M., & Trotman, K. E. N. T. (2004). The impact of the type of accounting standards on preparers’ judgments. Abacus, 40(1), 76-93.
Ribeiro, A. M. (2014). Poder discricionário do gestor e comparabilidade dos relatórios financeiros: uma análise dos efeitos da convergência do Brasil às IFRS (Ph.D. Thesis). Faculdade de Economia, Administração e Contabilidade, Universidade de São Paulo, São Paulo.
Ryan, S. G. (1995). A model of accrual measurement with implications for the evolution of the book-to-market ratio. Journal of
Accounting Research, 33(1), 95-112.
Schipper, K. (2003). Principles-based accounting standards.
Accounting Horizons,17(1), 61-72.
Correspondence Address:
Alex Mussoi Ribeiro
Universidade Federal de Santa Catarina, Centro Socioeconômico – Bloco F, Departamento de Ciências Contábeis R. Eng. Agronômico Andrei Cristian Ferreira, s/n – CEP: 88040-970
Campus Universitário Trindade – Florianópolis – SC
Email: [email protected]
sec.gov/news/studies/principlesbasedstand.htm
Silva, R. L. M. (2013). Adoção completa das IFRS no Brasil: qualidade das demonstrações contábeis e o custo de capital próprio (Ph.D. Thesis). Faculdade de Economia, Administração e Contabilidade, Universidade de São Paulo, São Paulo.
Simmons, J. (1967, outubro). A concept of comparability in financial reporting. The Accounting Review, 680-692.
Sohn, B. C. (2011). The effect of accounting comparability on earnings management (working paper). Hong Kong: City University of Hong Kong.
Stolowy, H., & Ding, Y. (2003). Regulatory flexibility and
management opportunism in the choice of alternative accounting standards: an illustration based on large French groups. The International Journal of Accounting, 38, 195-213.
Sunder, S. (2009). IFRS and the accounting consensus. Accounting Horizons, 23(1), 101-111.
Taplin, R. H. (2010). Statistical inference using the T index to quantify the level of comparability between accounts. Accounting and Business Research, 40(1), 75-103.
Tweedie, S. D. (2007). Can global standards be principle based? The
Journal of Applied Research in Accounting and Finance, 2(1), 3-8. Verrecchia, R. E., & Weber, J. (2006). Redacted disclosure. Journal of
Accounting Research, 44(4), 791-814.
Watts, R. L., & Zimmerman, J. L. (1986). Positive accounting theory. New Jersey: Prentice Hall Career & Technology.
Webster, E., & Thornton, D. B. (2004). Earnings quality under rules- vs. principles-based accounting standards: a test of the Skinner hypothesis (working paper). Kingston, ON: Queen’s University School of Business.
Wooldridge, J. M. (2013). Introductory econometrics: a modern approach (5a. ed.). Mason, OH: South-Western Cengage Learning.
Yip, R. W. Y., & Young, D. (2012). Does mandatory IFRS adoption improve information comparability? The Accounting Review, 87(5), 1767-1789.