CICLO DE ESTUDOS: Doutoramento
ÁREA DE ESPECIALIZAÇÃO: Nutrição Clínica
Título: Estado nutricional de doentes com
mucopolissacaridose
Nutritional status of patients with
mucopolysaccharidosis
Autor: Ana Furtado Faria
D
2017
Nutritional status of patients with mucopolysaccharidosis
Estado nutricional de doentes com mucopolissacaridose
Academic Dissertation
To be presented to the Faculdade de
Ciências da Nutrição e Alimentação da
Universidade do Porto, for public
examination for the degree of
PhD in Clinical Nutrition
Supervisor: Luísa Maria de Abreu Freire Diogo Matos, MD, PhD
Porto
2017
This investigation was supported by: BioMarin Europe Ltd Shire
“We are guilty of many errors and many faults, but our worst crime is abandoning the children, neglecting the fountain of life. Many of the things we need can wait. The child cannot. Right now is the time his bones are being formed, his blood is being made, and his senses are being developed. To him we cannot answer ‘Tomorrow’, his name is today.” Gabriela Mistral, 1948 Aos meus filhos, Carolina, Diogo e Maria.
A
CKNOWLEDGEMENTS
À Professora Doutora Luísa Diogo, pelos ensinamentos e apoio constante e por me incentivar a nunca desistir.
À Doutora Paula Garcia, por tudo o que me transmitiu, conhecimentos e amizade.
À Doutora Maria do Carmo Macário, à Professora Doutora Esmeralda Martins, ao Professor Doutor Júlio Rocha, à Doutora Manuela Almeida, à Doutora Elisa Leão Teles, á Doutora Esmeralda Rodrigues, à Doutora Carla Vasconcelos, à Doutora Ana Gaspar e à Doutora Patrícia Janeiro, pela disponibilidade e colaboração na concretização do projeto.
À BioMarin Ltd. (nas pessoas do Doutor Tiago Barros e da Professora Doutora Sónia Albuquerque) e à Shire pelo apoio financeiro, fundamental para a realização da investigação.
À Professora Doutora Florbela Vitória, por toda a ajuda e celeridade nas respostas. À Ana Serpa Oliveira, pela ajuda na revisão e por toda a disponibilidade que sempre demonstrou. À Maria Armanda por toda a colaboração cientifica, e pelo apoio neste ultimo ano. Aos meus verdadeiros Amigos, que estão sempre lá quando grito “socorro!”. Aos meus Pais, por estarem sempre e incondicionalmente disponíveis, abdicando de tudo para tudo nos proporcionar. Ao Rui, por estar ao meu lado e dos nossos filhos, apesar de todas as horas que não estive por perto. Aos meus filhos, Carolina, Diogo e Maria, pelos momentos em que precisavam de mim, mas em que não pude estar presente. Muito Obrigada!
A
BSTRACT
Background:
Mucopolysaccharidosis (MPS) are a group of rare, genetic, multisystem, progressive diseases. They are characterized by lysosomal accumulation of glycosaminoglycans, due to congenital enzymatic deficiencies. Patients are susceptible to nutritional status deterioration as a consequence of poor quality of health (inherent to the degenerative character of the disorders), and/or inadequate food habits. Treatment, which is far from optimal, has been focused in symptoms alleviation and search for specific (“curative”) therapies. Nutritional issues have not been a major concern in the majority of the studies.
Aim:
The main objective of this study was to evaluate nutritional status of MPS patients, in relation to their food and nutritional intake and quality of health.
Methods:
This is a cross-sectional study that included patients from four Portuguese Lysosomal Disorders Treatment Centers. Demographic, recent (24-hour recall) and usual (food-frequency questionnaire) food intake data were collected. Anthropometric results (weight, height, body mass index) were compared with WHO references. Body composition was assessed by tetrapolar biompedance analysis. Plasma proteins, vitamins, minerals, lipids levels and essential fatty acids, as well as renal and liver function tests, total blood count and phosphocalcium metabolism were evaluated. The Health Assessment Questionnaire (HAQ) was applied to patients (or caregivers). The 6-minute walking test (6-MWT) was performed by a subgroup of patients. This study was approved by the Ethical Committees of each Treatment Centre, and Comissão Nacional de Proteção de Dados. Patients, parents or other legal guardians gave a written informed consent. Results: Thirty-one patients (five MPS I; four MPS II; nine MPS III; three MPS IV; nine MPS VI; one MPS VII), aged between 1.7 and 32.7 years, were included. Mean age at diagnosis was 3.2 (SD=3.0) years. Nineteen patients (nine MPS VI) were under enzyme replacement therapy (ERT). Ten were taking nutritional supplements, mainly vitamin D formulas. A high number of patients drank sugar-rich beverages on a weekly basis and/or did not eat fruits and vegetables regularly.
Caloric, protein, carbohydrates and fiber intakes were lower than estimated average requirements (EAR) in 56.0%, 32.0%, 64.0% and 76.0% of the subjects,
respectively. Fat intake was adequate in 52.0% and high in 36.0%. The intake of vitamins and minerals was high in most patients.
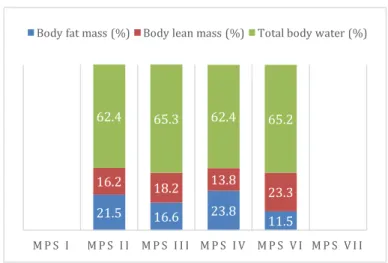
Weight z-score varied from -1.7 to 2.6, height z-score, from -10.1 to 1.5 and BMI z-score, from -4.6 to 3.4. The lowest values were observed in MPS VI, MPS IV and MPS I groups for weight, height and BMI, respectively. Two patients presented a status of severe thinness and six showed overweight, (one obese). Minimum mean body fat mass (16.6%) and body lean mass (13.8%) were displayed in MPS VI and in MPS IV groups, respectively. Phase-angle varied from 3.0 to 6.2°.
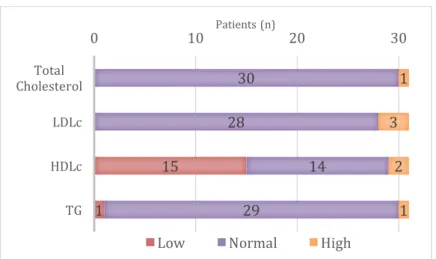
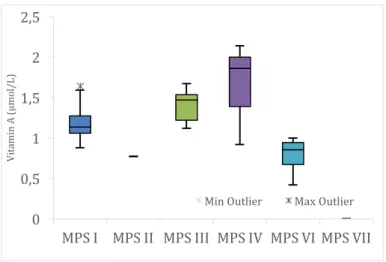
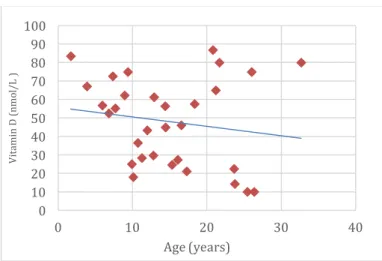
Pre-albumin, retinol binding protein (RBP), creatinine and HDL-cholesterol were low in 59.3%, 75.0%, 77.4% and 48.4%, of the patients, respectively. Vitamin D insufficiency was presented in 38.7% and deficiency in 48.4%. MPS III group showed significantly higher plasma pre-albumin RBP and vitamin A levels, than the other groups. MPS VI group exhibited lower RBP, vitamin A and vitamin E than the others. MPS IV group presented higher vitamin E levels than the remainder. Plasma pre-albumin and vitamin A were significantly lower in patients submitted to ERT, compared to others.
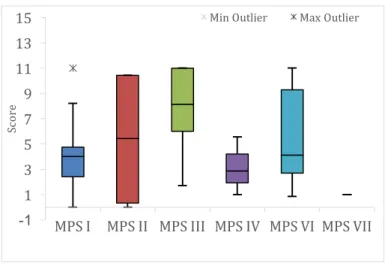
Mean total HAQ score (part I) was 6.6/11 (SD=3.8) (11=total inability). Activities related to dressing and bathing were associated with the greatest difficulties. Moderate positive correlations were detected between age and scores of: “eating and drinking” “toileting”, “mobility”, and “walking and climbing stairs”. A moderate positive and significant correlation was found between age and total HAQ score. Strong negative correlations were displayed between “walking and climbing stairs” scores and plasma creatinine and araquidonic acid levels. MPS type III patients had higher scores in “eating and drinking”, “dressing” and total HAQ than the other MPS groups. Caregiver assistance total score (HAQ - part II) presented a mean of 3.0/11 (SD=1.1). MPS type II patients showed significantly higher results in 6-MWT than the other groups. Discussion and conclusion Healthy food (fruits and vegetables) is not regularly consumed by most of the patients, whereas sugar-rich drinks are often present in the patients’ diet. The majority had lower caloric, carbohydrates and fiber intake and a great part showed lower protein and higher fat intake than recommendations.
A great number of patients presented nutritional status indicators in levels lower than normal: phase-angle, pre-albumin, RBP and creatinine. Low levels of plasma vitamin D were most prevalent.
MPS VI patients showed lower RBP, vitamin A and vitamin E. The former two were also lower in the group submitted to ERT (where about half of the patients were MPS VI).
A high level of difficulties was found in the sample, associated with high dependence scores. Older patients showed more difficulties, in general. MPS III patients were the ones were difficulties were the greatest in global test, namely
in “eating and drinking” and “dressing” domains. Higher levels of dependence were also present in patients with lower plasma creatinine and araquidonic acid levels.
A high level of disease severity was found in this group of patients. In a substantial part of them, nutritional status indicators were found to be abnormal, pointing to a hypothetical malnutrition status, which could not be proved by our results. A concurrent factor for the abnormalities found in nutritional status indicators could be the latent status of chronic inflammation, known to be associated to these diseases. Unfortunately, inflammation status of the patients was not included in the aims of the present investigation. More studies, with larger samples and including other parameters are required, in order to better clarify our results.
A protocol of nutritional surveillance for the adequate follow-up of MPS is suggested. The multidisciplinary team in charge of these patients should include a specialized nutritionist.
Keywords: mucopolysaccharidosis; nutrition; body composition; quality of health.
RESUMO
Introdução
As mucopolissacaridoses (MPS) são um grupo de doenças genéticas, raras, progressivas com envolvimento multisistémico. Caraterizam-se por uma acumulação lisosomal de glicosaminoglicanos, causada por défices enzimáticos específicos. A debilidade do estado de saúde (inerente à natureza degenerativa destas doenças) e/ou hábitos alimentares possivelmente desadequados, conferem a estes doentes grande suscetibilidade de deterioração do seu estado nutricional. O tratamento, longe de ser o mais adequado, tem-se focado essencialmente nas co-morbilidades, enquanto se investe ativamente no desenvolvimento e aperfeiçoamento de terapêuticas especificas, “curativas”. O estado nutricional destes doentes não tem, de um modo geral, sido objeto de investigação. Objetivos: O principal objetivo deste estudo foi avaliar o estado nutricional de doentes com MPS, relacionando-o com a ingestão alimentar e nutricional e com o seu estado de saúde. Métodos:
Trata-se de um estudo transversal para o qual foram convidados a participar doentes de quatro Centros de Tratamento de Doenças do Lisossoma Portugueses. Recolheu-se dados demográficos, assim como informação sobre a ingestão alimentar recente (24 horas anteriores) e habitual (questionário de frequência alimentar). Os dados antropométricos foram avaliados com recurso aos parâmetros de referencia da OMS. A composição corporal foi estimada através de bioimpedância elétrica tetrapolar. Analisou-se igualmente: proteínas, vitaminas, minerais, lípidos e ácidos gordos essenciais plasmáticos, hemograma e alguns parâmetros de função renal e hepática e do metabolismo fosfo-cálcico. O Questionário de Avaliação do Estado de Saúde (HAQ) foi igualmente respondido pelos doentes (ou cuidadores). Um subgrupo dos doentes executou o teste de caminhada de 6 minutos. Este estudo foi aprovado pelas Comissões de Ética de cada Centro de Tratamento e pela Comissão Nacional de Proteção de Dados. Todos os doentes, pais ou tutores legais deram consentimento informado escrito para a participação. Resultados: Foram avaliados trinta e um doentes (cinco MPS I; quatro MPS II; nove MPS III; três MPS IV; nove MPS VI; um MPS VII), com idades compreendidas entre 1,7 e 32,7 anos. O diagnostico foi realizado em média aos 3,2 anos (DP=3,0). Dezanove doentes (nove MPS VI) estavam sob terapia de substituição enzimática (ERT). Dez
referiram a toma de suplementos nutricionais, principalmente de fórmulas de vitamina D. Um significativo numero de doentes consumia bebidas açucaradas semanalmente e / ou não ingeria fruta e legumes regularmente. A ingestão calórica, proteica, glicídica e de fibras era inferior às recomendações (“EAR”) em 56,0%, 32,0%, 64,0% e 76,0% dos indivíduos, respetivamente. A ingestão de lípidos era adequada em 52,0% e superior ao recomendado em 36,0%. A maioria dos doentes apresentava uma ingestão de vitaminas e minerais superior às necessidades.
Os indicadores z-score do peso variaram de -1,7 a 2,6, os do, z-score da estatura, entre -10,1 e 1,5 e os do z-score do índice de massa corporal, de -4,6 a 3,4. foram os mais baixos, respetivamente Os valores mais baixos foram observados nos grupos com MPS VI, MPS IV e MPS I, respetivamente para o peso, a estatura e o índice de massa corporal. Dois doentes apresentavam magreza extrema e seis, excesso de peso (um obeso). Os grupos com MPS VI e MPS IV tinham os mínimos valores médios de massa gorda (16,6%) e de massa magra (13,8%), respetivamente. O ângulo de fase variou entre 3,0 e 6,2°. Os níveis de pré-albumina, proteína transportadora do retinol (RBP), creatinina e colesterol-HDL eram baixos em, respetivamente, 59,3%, 75,0%, 77,4% e 48,4% dos doentes. Encontrou-se insuficiência de vitamina D em 38,7% dos indivíduos e deficiência em 48,4%.
Os doentes com MPS III apresentaram valores de pré-albumina, RBP e vitamina A plasmáticos significativamente superiores aos dos restantes grupos. No grupo com MPS VI foram encontrados valores de RBP, vitamina A e vitamina E inferiores aos restantes. Os doentes com MPS IV apresentaram níveis de vitamina E plasmática superiores aos dos restantes grupos. A pré-albumina e a vitamina A plasmáticas eram significativamente inferiores nos doentes submetidos a ERT, relativamente aos restantes.
A pontuação média do questionário HAQ (parte I) foi de 6,6/11 (DP=3,8) (11=incapacidade total). As atividades relacionadas com o vestir e a higiene pessoal estavam associadas a maiores dificuldades. Foram encontradas correlações positivas moderadas entre a idade e as pontuações de: “comer e beber”, “higiene pessoal”, “mobilidade”, “caminhar e subir escadas”. Entre a idade e a pontuação média total do HAQ foi identificada uma correlação positiva e moderada, estatisticamente significativa. Foram ainda estabelecidas correlações negativas fortes entre a pontuação do domínio “caminhar e subir escadas” e os valores plasmáticos de creatinina e do ácido araquidónico. Os doentes com MPS III apresentaram pontuações mais elevadas nos domínios “comer e beber” e “vestir” e na pontuação global do HAQ, relativamente aos restantes grupos. A pontuação média relativamente à dependência do cuidador (HAQ – parte II) foi de 3,0/11 (DP=1,1). Os doentes com MPS II mostraram, em relação aos outros grupos, resultados significativamente superiores na prova da caminhada.
Discussão e conclusão
A generalidade dos doentes não consumia regularmente alimentos saudáveis, como frutas e vegetais e ingeria bebidas açucaradas com regularidade. A ingestão energética, glicídica e de fibras era inferior às recomendações na maioria dos
casos. Uma grande parte dos indivíduos tinha uma ingestão de proteínas e de lípidos, respetivamente inferior e superior às necessidades.
Alguns indicadores do estado nutricional encontravam-se baixos em muitos dos doentes analisados, nomeadamente o ângulo de fase e a pré-albumina, a RBP e a creatinina plasmáticas. Igualmente prevalentes, foram os níveis diminuídos de vitamina D no plasma. Os doentes com MPS VI apresentavam valores plasmáticos baixos de RBP, vitamina A e vitamina E. No grupo submetido a ERT (no qual cerca de metade dos doentes era MPS VI), havia igualmente valores dos dois primeiros. A amostra estudada demonstrou um alto nível de dificuldade: média de 6,6, associado com altos níveis de dependência do cuidador. Os doentes mais velhos manifestaram globalmente maiores dificuldades. Nos doentes com MPS III, estas dificuldades foram superiores às dos restantes, e particularmente nos domínios “comer e beber” e “vestir”. Nos indivíduos com baixos valores de creatinina e de ácido araquidónico plasmáticos, foram igualmente encontrados maiores níveis de dependência.
Este grupo de doentes apresenta um elevado nível de gravidade. Numa parte significativa da amostra foram encontradas alterações nos indicadores do estado nutricional, apontando para um possível estado de desnutrição, que não pudemos provar com os resultados obtidos. Concomitantemente, poderá existir um estado de inflamação crónica, reconhecidamente associado a estas doenças. No entanto, a avaliação do estado inflamatório dos doentes não foi incluída nos objetivos da presente investigação.
São necessários mais estudos, com amostras de maior dimensão e inclusão de outros parâmetros, de modo a clarificar os dados obtidos.
Propõe-se um protocolo de vigilância nutricional para o seguimento dos doentes com MPS. A equipa multidisciplinar que acompanha estes doentes deve incluir um nutricionista com formação especifica em doenças hereditárias do metabolismo.
Palavras-chave: mucopolissacaridoses; nutrição; composição corporal; estado
de saúde.
C
ONTENTS
Acknowledgements ... vii
Abstract ... ix
Contents ... xvii
Abbreviations ... xviii
List of Figures ... xix
List of Tables ... xxi
Introduction ... 1
Aims ... 7
Material and Methods ... 9
I. Patients ... 10
II. Methods ... 10
Results ... 17
I.
Characterization of the sample ... 18
II.
Food and Nutritional intake ... 21
III.
Anthropometrics and body composition ... 28
IV. Resistance test ... 33
V. Laboratorial data ... 34
VI.
Quality of health ... 47
Discussion and Conclusions ... 53
Supplements ... 71
References ... 117
A
BBREVIATIONS
BMI - body mass index EAR - estimated average requirements ERT - enzymatic replacement therapy HAQ - Health Assessment Questionnaire GAG - glycosaminoglycan MPS - mucopolysaccharidosis RBP - retinol binding protein WHO - World Health Organization 6-MWT - six-minute walking test
L
IST OF
F
IGURES
Figure 1. Characterization of the sample: distribution per gender and age group (n=31). ... 18
Figure 2. Characterization of the sample: number of patients per type of MPS (n=31). ... 18
Figure 3. Characterization of the sample: type of MPS by age group (n=31). ... 19
Figure 4. Characterization of the sample: age at diagnosis per type of MPS (n=31). ... 19
Figure 5. Characterization of the sample: enzymatic replacement therapy (ERT), per type of MPS (n=31). ... 20
Figure 6. Recent nutritional intake: mean distribution (% of total caloric intake) of macronutrients (n=31). ... 21
Figure 7. Usual nutritional intake: mean distribution (% of total caloric intake) of macronutrients (n=25). ... 23
Figure 8. Usual nutritional intake in MPS patients (energy and macronutrients): number of patients consuming lower, adequate and higher than recommendations (n=25). ... 24
Figure 9. Usual nutritional intake in MPS patients (energy, macronutrients and essential fatty acids): number of patients consuming lower, adequate and higher than recommendations, per type of MPS (n=25). ... 25
Figure 10. Usual nutritional intake in MPS patients (vitamins): number of patients consuming lower, adequate and higher than recommendations (n=25). ... 26
Figure 11. Usual nutritional intake in MPS patients (minerals and oligoelements): number of patients consuming lower, adequate and higher than recommendations (n=25). ... 27
Figure 12. Anthropometrics: weight, in z-score, according to MPS type (n=9: three MPS I; one MPS II; two MPS III; two MPS VI; one MPS VII). ... 28
Figure 13. Anthropometrics: height, in z-score, according to type of MPS (n=30: five MPS I; four MPS II; nine MPS III; three MPS IV; eight MPS VI; one MPS VII). ... 29
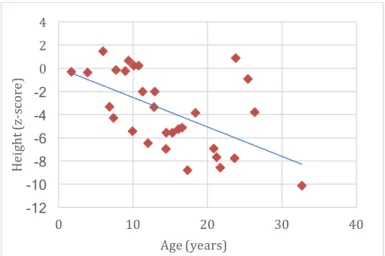
Figure 14. Anthropometrics: height, in z-score, according to age (n=30: five MPS I; four MPS II; nine MPS III; three MPS IV; eight MPS VI; one MPS VII). ... 29
Figure 15. Anthropometrics: BMI, in z-score, according to age (n=30: five MPS I; four MPS II; nine MPS III; three MPS IV; eight MPS VI; one MPS VII). ... 30
Figure 16. Anthropometrics: BMI, in z-score, per MPS type (n=30: five MPS I; four MPS II; nine MPS III; three MPS IV; eight MPS VI; one MPS VII). ... 30
Figure 17. Distribution of individuals (number of patients), according to BMI and WHO z-score tables (n=30: five MPS I; four MPS II; nine MPS III; three MPS IV; eight MPS VI; one MPS VII). ... 31
Figure 18. Body composition: mean values of body fat mass, body lean mass and total body water, in MPS types II (four patients), III (six), IV (three) and VI (five) (n=18). ... 32
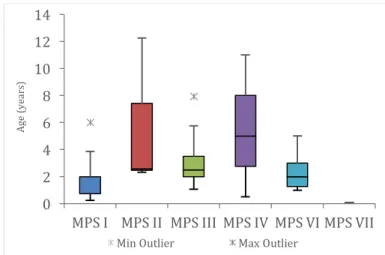
Figure 19. Phase angle: mean values (°), in MPS types I (one patient), II (four), III (seven), IV (three) and VI (six) (n=21). ... 32
Figure 20. Total distance walked (in meters): mean values for each type of MPS (n=16). ... 33
Figure 21. Plasma proteins - classification according to reference values (RBP=retinol binding protein; CrP=c-reactive protein; labels correspond to the number of patients). ... 35
Figure 22. Plasma proteins – pre-albumin levels (mg/L), according to MPS type (n= 27: five MPS I; four
MPS II; six MPS III; two MPS IV; nine MPS VI; one MPS VII). ... 35
Figure 23. Plasma pre-albumin levels of ERT patients (n=19), when compared to the group not performing this treatment (no-ERT, n=8). ... 35
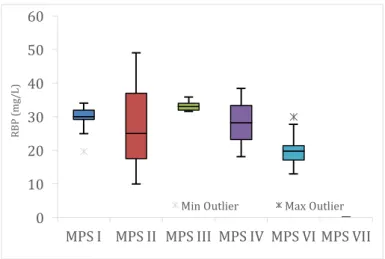
Figure 24. Plasma proteins – RBP levels (mg/L), according to MPS type (n= 24: five MPS I; three MPS II; five MPS III; two MPS IV; eight MPS VI; one MPS VII). ... 36
Figure 25. Lipid profile - classification according to reference values (n=31) ... 37
Figure 26. Plasma essential fatty acids levels in 12 MPS patients (three MPS I; four MPS III; two MPS IV; three MPS VI) - classification according to reference values (labels correspond to the number of patients) ... 38
Figure 27. Plasma essential fatty acids in 12 patients – araquidonic acid (AA) levels (μg/mL) per type of MPS (three MPS I; four MPS III; two MPS IV; three MPS VI). ... 38
Figure 28. Plasma vitamins* - classification according to reference values. ... 39
Figure 29. Plasma vitamins - vitamin A levels (µmol/L), per type of MPS (n=23: four MPS I; one MPS II; seven MPS III; three MPS IV; eight MPS VI). ... 40
Figure 30. Plasma vitamins - vitamin E levels (µmol/L), per type of MPS (n=22: four MPS I; one MPS II; seven MPS III; three MPS IV; seven MPS VI). ... 40
Figure 31. Plasma vitamins - vitamin E (µmol/L), according to age (n=22: four MPS I; one MPS II; seven MPS III; three MPS IV; seven MPS VI). ... 40
Figure 32. Plasma minerals - classification according to reference values. ... 41
Figure 33. Liver function: classification according to reference values ... 42
Figure 34. Renal function: classification according to reference values (n=31). ... 43
Figure 35. Total blood count: classification according to reference values. ... 44
Figure 36. Phosphocalcium metabolism biochemical analysis: classification according to reference values (p=plasmatic; 25 (OH) D = plasma 25-hydroxy-cholecalciferol; AP=alkaline phosphatase; PTH=parathormone; Ca / creat u= urinary calcium / creatinine ratio; TRP=tubular reabsorption of phosphate) ... 45
Figure 37. Phosphocalcium metabolism analytical indicators: plasma 25-hydroxy-cholecalciferol (nmol/L), according to age (n=31). ... 45
Figure 38. Difficulties assessment – “eating and drinking” domain, per type of MPS (n=31). ... 47
Figure 39. Difficulties assessment – “dressing” domain, per type of MPS (n=31). ... 48
Figure 40. HAQ: mean score obtained in each domain (ranging from 0 “not difficult at all” to 11 points “unable to do”) (n=31). ... 50
Figure 41. Difficulties assessment – all domains, per type of MPS (n=31). ... 51
Figure 42. HAQ (caregiver assistance): mode of answers, by domain (n=31). ... 51
L
IST OF
T
ABLES
Table 1. Biochemical defects and urinary metabolites for diagnosis of different types of MPS (adapted from Inborn metabolic diseases (1)). ... 3
Table 2. Food habits (mode): absolute and relative frequencies (n=25). ... 22
Table 3. Anthropometrics: classification of nutritional status according to BMI (n=30: five MPS I; four MPS II; nine MPS III; three MPS IV; eight MPS VI; one MPS VII). ... 31
Table 4. Nutritional follow-up protocol – a proposal for MPS patients. aDietary reference intakes; bSee growth curves appropriated to each type of MPS; cBioelectrical impedance or dual-energy X-ray absorptiometry; d from 6 years of age plasma analysis; e to screen for inflammation ... 68
Table 5. Nutritional follow-up protocol – major findings and measures ... 69
Table S1. Characterization of sample: general description per individual [* age at assessment; AE=antiepileptic drugs, MF=methylphenidate; AP=antipsychotic drugs; HP=hypnotic drugs (melatonine, HalcionÒ, antiH1); AN=analgesic drugs; GE=gastrointestinal drugs; D=diuretics; ACEI=angiotensin converting enzyme inhibitor(ACE inhibitors); OT=other] ... 72
Table S2. Characterization of sample: distribution per gender and age group. ... 73
Table S3. Characterization of sample: age at diagnosis (in years), and type of MPS (n=29). ... 73
Table S4. Recent nutritional intake of 31 patients: energy and macronutrients. ... 74
Table S5. Recent nutritional intake of 31 patients: micronutrients. ... 74
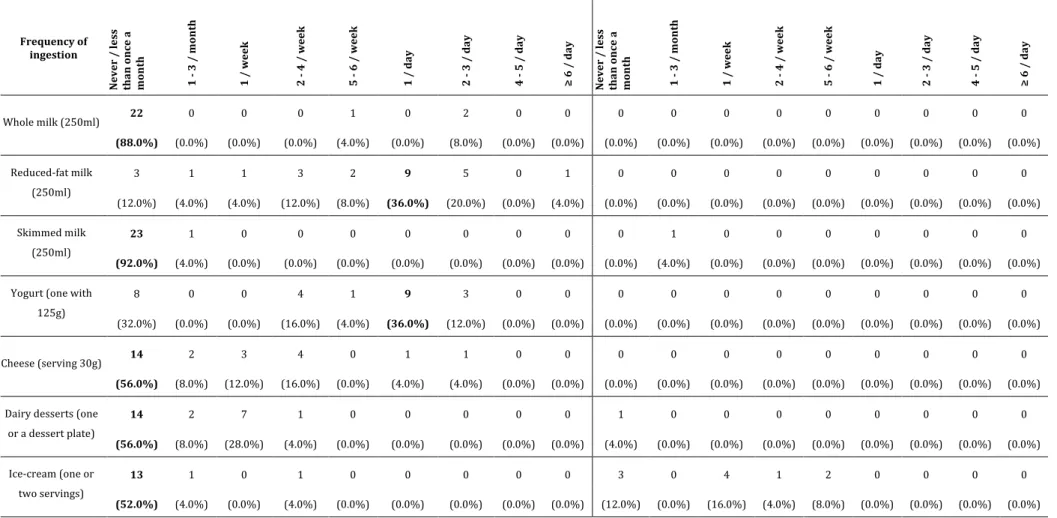
Table S6. Usual nutritional intake: distribution of frequency, annual and seasonal of dairy products. .. 75
Table S7. Usual nutritional intake: distribution of frequency, annual and seasonal of egg, meat and derivatives. ... 76
Table S8. Usual nutritional intake: distribution of frequency, annual and seasonal of fish and other sea products. ... 77
Table S9. Usual nutritional intake: distribution of frequency, annual and seasonal of oils and other fats ... 78
Table S10. Usual nutritional intake: distribution of frequency, annual and seasonal of bread, cereals and similar. ... 79
Table S11. Usual nutritional intake: distribution of frequency, annual and seasonal of sweets and pastry. ... 80
Table S12. Usual nutritional intake: distribution of frequency, annual and seasonal of vegetables. ... 81
Table S13. Usual nutritional intake: distribution of frequency, annual and seasonal of vegetables (cont.). ... 82
Table S14. Usual nutritional intake: distribution of frequency, annual and seasonal of fruits. ... 83
Table S15. Usual nutritional intake: distribution of frequency, annual and seasonal of fruits (cont.) ... 84
Table S16. Usual nutritional intake: distribution of frequency, annual and seasonal of drinks. ... 85
Table S17. Usual nutritional intake: distribution of frequency, annual and seasonal of other foods. ... 86
Table S18. Usual nutritional intake: distribution of frequency, annual and seasonal of other foods mentioned by individuals. ... 87
Table S19. Usual nutritional intake in 25 MPS patients: energy and macronutrients. ... 88
Table S20. Usual nutritional intake in 25 MPS patients: patients consuming lower, adequate and higher energy than recommendations. Mean (and SD) are presented in % of EAR. ... 88
Table S21. Usual nutritional intake in 25 MPS patients: patients consuming lower, adequate and higher energy than recommendations, according to age group. ... 88
Table S22. Usual nutritional intake: percentage adequacy of energy intake, according to age group. .... 88
Table S23. Usual nutritional intake in 25 MPS patients: patients consuming lower, adequate and higher energy than recommendations, according to MPS type. ... 89
Table S24. Usual nutritional intake: percentage adequacy of energy intake, according to MPS type (a n=1). ... 89
Table S25. Usual nutritional intake in 25 MPS patients: patients consuming lower, adequate and higher amounts of macronutrients than recommendations. Mean (and SD) are presented in % of EAR. ... 89
Table S26. Usual nutritional intake in 25 MPS patients: patients consuming lower, adequate and higher amounts of macronutrients than recommendations, according to age group. ... 90
Table S27. Usual nutritional intake: percentage adequacy of macronutrients intake, according to age group. ... 90
Table S28. Usual nutritional intake in 25 MPS patients: patients consuming lower, adequate and higher amounts of macronutrients than recommendations, according to MPS type. ... 91
Table S29. Usual nutritional intake: percentage adequacy of macronutrients intake, according to MPS type (a n=1). ... 91
Table S30. Usual nutritional intake in 25 MPS patients: vitamins (RE=retinol equivalents). ... 92
Table S31. Usual nutritional intake in 25 MPS patients: patients consuming lower, adequate and higher amounts of vitamins than recommendations. Mean (and SD) are presented in % of EAR. ... 92
Table S32. Usual nutritional intake in 25 MPS patients: patients consuming lower, adequate and higher amounts of vitamins than recommendations, according to age group. ... 93
Table S33. Usual nutritional intake: percentage adequacy of vitamins intake, according to age group. 94
Table S34. Usual nutritional intake in 25 MPS patients: patients consuming lower, adequate and higher amounts of vitamins than recommendations, according to MPS type. ... 95
Table S35. Usual nutritional intake: percentage adequacy of vitamins intake, according to MPS type (a n=1). ... 96
Table S36. Usual nutritional intake in 25 MPS patients: minerals and oligoelements. ... 96
Table S37. Usual nutritional intake in 25 MPS patients: patients consuming lower, adequate and higher amounts of minerals and oligoelements than recommendations. Mean (and SD) are presented in % of EAR. ... 97
Table S38. Usual nutritional intake in 25 MPS patients: patients consuming lower, adequate and higher amounts of minerals and oligoelements than recommendations, according to age group. ... 98
Table S39. Usual nutritional intake: percentage adequacy of minerals and oligoelements intake, according to age group. ... 99
Table S40. Usual nutritional intake in 25 MPS patients: patients consuming lower, adequate and higher amounts of minerals and oligoelements than recommendations, according to MPS type. ... 99
Table S41. Usual nutritional intake: percentage adequacy of minerals and oligoelements intake, according to MPS type (a n=1). ... 100
Table S42. Anthropometrics: weight, in Kg (z-score), according to MPS type. ... 101
Table S43. Anthropometrics: weight, in Kg (z-score) (n.d. – no determined). ... 101
Table S44. Anthropometrics: height, in cm (z-score), according to type of MPS. ... 102
Table S45. Anthropometrics: height, in cm (z-score). ... 102
Table S46. Anthropometrics: BMI, in Kg/m2 (z-score), according to MPS type. ... 103
Table S47. Anthropometrics: BMI, in Kg/m2 (z-score). ... 103
Table S48. Body composition, according to type of MPS (SD=standard deviation; Min=minimum; Max=maximum) ... 104
Table S49. Phase angle, according to type of MPS (SD=standard deviation; Min=minimum; Max=maximum) ... 104
Table S50. Six minutes walking test results. ... 105
Table S51. Plasmatic proteins - classification according to reference values; mean, standard-deviation, minimum and maximum (units mentioned in table). ... 106
Table S52. Lipid profile (mg/dL) - classification according to reference values and mean, standard-deviation, minimum and maximum (n=31). ... 107
Table S53. Plasma essential fatty acids levels, in μg/mL - classification according to reference values; mean, standard-deviation, minimum and maximum (n=12: three MPS I; four MPS III; two MPS IV; three MPS VI). ... 107
Table S54. Plasma vitamins* (units mentioned in table) - classification according to reference values; mean, standard-deviation, minimum and maximum. ... 108
Table S55. Plasma minerals (units mentioned in table) - classification according to reference values; mean, standard-deviation, minimum and maximum. ... 109
Table S56. Liver function (IU/L): classification according to reference values and mean, standard-deviation, minimum and maximum. ... 110
Table S57. Renal function: classification according to reference values; mean, standard-deviation, minimum and maximum (units mentioned in table) (n=31). ... 110
Table S58. Total blood count: classification according to reference values; mean, standard-deviation, minimum and maximum (units mentioned in table). ... 111
Table S59. Phosphocalcium metabolism analytical indicators. Classification according to reference values; mean, standard-deviation, minimum and maximum (units mentioned in table). ... 112
Table S60. HAQ: activities related to eating and drinking (ranging from 0 “not difficult at all” to 11 points “unable to do”). ... 113
Table S61. HAQ: activities related to dressing (ranging from 0 “not difficult at all” to 11 points “unable to do”). ... 113
Table S62. HAQ: activities related to bathing (ranging from 0 “not difficult at all” to 11 points “unable to do”). ... 113
Table S63. HAQ: activities related to toileting (ranging from 0 “not difficult at all” to 11 points “unable to do”). ... 114
Table S64. HAQ: activities related to mobility (ranging from 0 “not difficult at all” to 11 points “unable to do”). ... 114
Table S65. HAQ: activities related to walking and climbing stairs (ranging from 0 “not difficult at all” to 11 points “unable to do”). ... 114
Table S66. HAQ: all domains (ranging from 0 “not difficult at all” to 11 points “unable to do”). ... 115
Table S67. HAQ: relative and absolute frequency of answers about autonomy (caregiver assistance), by domain. Median is indicated and mode is evidenced in bold. ... 115
I
NTRODUCTION
Mucopolysaccharidosis
Mucopolysaccharidosis (MPS) are a group of genetic, progressive diseases, caused by enzymatic deficiencies on lysosomal degradation of glycosaminoglycans (GAGs) (1). MPS are orphan diseases, (incidence lower than 1:2 000 live births). Their global incidence ranges from 1.4/10 000 to 1/18 000 (2, 3). It is estimated to be about 1:25 000 in Portugal (4). GAGs are part of the structure of the proteoglycans, which are important components of the extracellular matrix (or connective tissue) (5, 6). They are subject to constant turnover, which is much slower in adults than in children.
Several acid hydrolases act sequentially in lysosomal degradation of GAGs. Deficiency of several of those enzymes are known to cause a block in GAGs catabolic pathways, with progressive accumulation of the respective substrate within cells of various organs. These include liver, spleen, bone, skin and central nervous system. Phenotypes vary according to the specific enzymatic deficiency and its severity, which determine the type, intensity and localization of GAGs storage (5, 7).
Seven major types of MPS are recognized, according to the enzyme defect and the glycosaminoglycans excreted in urine: Hurler-Scheie (MPS IH and MPS IS), Hunter (MPS II), Sanfilippo (MPS III; subtypes A, B, C and D), Morquio (MPS IV; subtypes A and B), Maroteaux-Lamy (MPS VI), Sly (MPS VII) and Hyaluronidase deficiency (MPS IX) (5) (Table 1). All MPS types are autosomal recessive disorders, except for MPS II, which is X-linked (8). Diagnosis of MPS is based on clinical suspicion and confirmed by urine GAGs quantification and electrophoresis analysis, enzymatic assay of lysosomal hydrolases in leucocytes or fibroblasts and genetic molecular study (1, 5) (Table 1).
GAGs accumulation affect predominantly liver and spleen (hepatosplenomegaly), skeletal structure (dysostosis multiplex) and general morphogenesis, with progressive coursing of features, specifically facial. Eye (corneal clouding and glaucoma), brain (psychomotor development delay and/or regression, intellectual deficiency, behavioural disturbances and/or dementia) and heart (cardiomyopathy and valve disease) involvement are also seen, mostly in specific types. Clinical phenotypes are protean concerning age onset, type and degree of affected organs and disease severity. In general, severity correlates inversely with age at presentation (9).
MPS type Disease name Enzymatic defect Urinary metabolites
MPS I Hurler, Scheie,
Hurler-Scheie a-L-Iduronidase Dermatan sulfate, heparan sulfate MPS II Hunter Iduronate sulfatase Dermatan sulfate, heparan sulfate MPS IIIA Sanfilippo A Heparan sulfate N-sulfatase
(sulfamidase) Heparan sulfate MPS IIIB Sanfilippo B a-N-Acetylglucosaminidase Heparan sulfate MPS IIIC Sanfilippo C Acetyltransferase Heparan sulfate MPS IIID Sanfilippo D N-Acetylglucosamine 6-sulfatase Heparan sulfate
MPS IVA Morquio A Galactosamine 6-sulfatase Keratan sulfate, chondroitin 6-sulfate MPS IVB Morquio B b-Galactosidase Keratan sulfate
MPS VI Maroteaux-Lamy N-Acetylglucosamine 4-sulfatase
(arylsulfatase B) Dermatan sulfate
MPS VII Sly b-Glucuronidase Dermatan sulfate, heparan sulfate, chondroitin 4-sulfate, chondroitin 6-sulfate
MPS IX - Hyaluronidase Hyaluronic acid
Table 1. Biochemical defects and urinary metabolites for diagnosis of different types of MPS (adapted from Inborn metabolic diseases (1)).
Usually, affected subjects seem normal in early life and develop the typical clinical phenotypes progressively after a few months or years. However, in the most severe forms, they may present typical signs in the neonatal, or even antenatal period. On the other end of the disease spectrum, manifestations emerge in youth or even adult life (10).
Characteristically, MPS IH, MPS II and MPS VI are more severe, with coarse facies and ENT obstructive disease. MPS VII is frequently associated with hydrops foetalis or neonatal massive hepatosplenomegaly and abdominal hernia, although late-onset forms are known (5).
Severe skeletal dysplasia, leading to impairment of growth (stature), and preserved intellectual function, are typically seen in MPS IV and also MPS VI (5). Cognitive impairment is variable and typical of MPS I, MPS II, all subtypes of MPS III and MPS VII patients, and progressive deterioration can occur. Behavioural disturbances and dementia occur mostly in MPS III (A, B or C) (1).
MPS IX is extremely rare, and patients commonly present with joint involvement (5).
With the improvement of diagnosis techniques, less severely affected patients are being detected, without significant dysmorphism or organomegaly and normal to borderline cognitive levels (11, 12).
In MPS patients, several issues inherent to the consequences of cell storage of GAGs, such as frequent ear infections, sleep apnoea and mechanical compression of the stomach by the
enlarged liver and spleen contribute to nutritional deficiencies and failure to thrive, commonly seen in these subjects. Behavioural disturbances with hyperkinesia and insomnia, depression, cognitive impairment/dementia and heart failure are additional risk factors to malnutrition. Treatment of MPS patients is mostly supportive, regardless the type. Hematopoietic stem cell transplantation is an available possibility. It has been used with some success in MPS IH patients, less than 2 years of age. Enzymatic replacement therapy (ERT) is accessible for patients with MPS IH/S, MPS II, MPS IVA and MPS VI, and in progress for MPS VII and MPS IIIB (5, 6, 13-15). Although some clinical improvement has been achieved with both therapeutic methods, they do not halt or revert all aspects of disease progression. In fact, none of the available therapeutic options is disease curative, but, at their best, disease modifiers.
Independently from the MPS type and available specific treatment, all patients need symptomatic treatment and support conducted by multidisciplinary teams, in order to promote well-being and improve quality of life (16-20). Adequate nutrition is one of the pillars of the therapeutic strategy.
Nutritional status and quality of life in chronic diseases
Growth and nutritional status are excellent indicators of health in children and adolescents. When a chronic disease like MPS is present, both growth and nutritional status may be impaired due to changes in metabolism secondary to disease, associated with other factors like inability to suck, chew, swallow and digest food properly, oesophageal reflux or the effects of prolonged use of medications (21-23).
Chronic symptoms (like pain, insomnia, abdominal distension, intellectual disability, feeding or mobility difficulties, to mention a few) and their negative repercussion in nutritional status may have consequences on the quality of life of patients and their families. Providing good nutritional monitoring and support, as well as careful symptomatic treatment, along with anticipation of complications, can contribute to improve patients and families’ quality of life.
Assessment of nutritional status
Assessment of nutritional status may lead to identification of the impact of the disease on nourishment, enabling a prompt intervention if needed. It can be achieved through anthropometrics, body composition and laboratorial parameters evaluation. Additionally,
information on usual food and nutritional intake may also help to identify the possible role of unhealthy food choices enhancing disease related factors in nutritional deficiency.
Growth impairment (short stature) due to skeletal dysplasia present in many patients is one of the main debated issues on MPS. However, their nutritional status is rarely discussed, literature on that subject being scarce. This occurs probably because these patients have so many other life threatening complications that nutrition comes second. On the other hand, the “puffy” appearance of most MPS patients due to skin storage may mask nutritional problems, at some extent.
A
IMS
This investigation aimed to: - Assess nutritional status of patients with MPS of different types; - Characterize food habits and usual nutritional intake in these individuals; - Evaluate their health status in association with disease type and/or progression; - Clarify the impact of disease in dietary intake and nutritional status; - Establish the link between nutritional intake and nutritional status in patients; - Correlate autonomy with dietary intake and nutritional status; - Propose a nutritional protocol to care MPS patients in daily clinics.
M
ATERIAL AND
M
ETHODS
P
ATIENTS
MPS patients from four Lysosomal Disorders Treatment Centers in Portugal were invited to participate in the present study: Centro Hospitalar Universitário de Coimbra, E.P.E., Centro
Hospitalar de São João - Porto, Centro Hospitalar do Porto, E.P.E. and Centro Hospitalar de Lisboa Norte, E.P.E..
A preliminary contact was made between the investigator and the medical teams of the Lysosomal Disorders Treatment Centers collaborating in the study. Demographic data, MPS type and age at diagnosis were collected. A code composed by MPS type and a digit (i.e. MPS III1) was attributed to each patient (Table S1).
M
ETHODSI. F
OOD AND NUTRITIONAL INTAKEThe investigator applied a 24-hour recall questionnaire, adapted to parents or patients, when possible. Information was collected using the available Manual of Quantification of Portuguese Foods (FCNAUP) (24). Data analysis, detailed by different nutrients, was done according to Portuguese Food Composition Table (INSA) (25). After accomplishing the previous assessments, in order to assess usual dietary intake over the previous 12 months, a food frequency questionnaire was delivered and its fulfilment was asked for, as recommended by the authors (26-28). Specific guidelines were explained. No intervention of the investigator occurred during the time patients or parents answered the questionnaires. Eighty-two food items were included in the questionnaire. Others were included, if consumed in a frequency higher than once per week. Nine possibilities of frequency of intake were considered, from “never or less than once per month” to “six or more times per day”, considering the medium serving size presented next to the item. When analysing data, foods with mentioned intake as “never or less than once per month” were excluded. Food intake was calculated multiplying frequencies by standard portion size of the food item. An extra seasonal factor of 0.25 was used, considering seasonality as corresponding to 3 months per year (26, 27).
Food intake conversion into nutrients was made using an adapted Portuguese version of software Food Processor Plus (ESHA Research, USA) and Portuguese Food Composition Table (INSA) (25, 29).
Nutritional intake was compared with Estimated Average Requirement (EAR), or adequate intake (AI) if EAR was inexistent (30-35). Intakes were considered adequate when found between 90 to 110% of EAR / AI, inclusive. Ingestion lower than 90% of EAR /AI and higher than 100% were considered lower and higher than recommendations, respectively (36).
II. A
NTHROPOMETRICS AND BODY COMPOSITIONIn each Hospital, patient’s weight and height were obtained by standard techniques in the same day of the remaining protocol procedures (37). For weight determination, different scales were used, according to local availability and the patient’s capacity to stand on vertical position. Equipment adapted to bed was used when ability to stand up was impaired. Weight was recorded in kilograms (Kg), adjusted to one decimal place. Height was measured by standard techniques with the stadiometers available in each centre, or estimated by wingspan, when needed. Height was recorded in centimetres (cm), adjusted to one decimal place (37). Body mass index (BMI) was calculated using the appropriate formula and data was recorded, with accuracy of one decimal place (37). Weight for age, height for age and BMI for age were coded into z-scores, according to World Health Organization standard growth references [WHO standards (birth to 60 months) and WHO reference 2007 (61 months to 19 years)] (37). For individuals older than 19 years, z-scores standardized to 19 years were given. In individuals older than 10 years, weight wasn’t analysed based on z-score, in accordance with WHO recommendations (37). In the adult group, patients were also classified according to the International Classification of BMI in underweight, overweight and obesity (adapted from WHO 1995, WHO 2000 and WHO 2004) (38). When available, disease specific growth charts were used: for MPS II (weight, stature and BMI for age), MPS III (stature for age), MPS IV (weight, stature and BMI for age) and MPS VI (stature for age) (39-42).
Body composition analysis was made using the bioelectrical impedance analyser AKERN BIA-101 Anniversary® (single frequency 50Hz). Recommendations for its use with maximum accuracy were applied: discouragement of alcohol intake and physical activity in the previous 8 hours and 4 hours fasting prior to the analysis (43).
Patients with prosthetics or catheters of unknown composition were excluded from this assessment. Resistance and reactance were recorded with accuracy of 0,1 ohms. Phase angle was calculated using the appropriate equation, like previously described in other studies, and recorded with accuracy of 0,1° (44).
III. R
ESISTANCE TESTThe six-minute walking test (6-MWT), a resistance test to assess ability to walk without support, unless mentioned, was performed in a 30 meter corridor, according to published guidelines (45). The test was accomplished after bio impedance analysis. Results were recorded with an accuracy of 0.1 m.
IV. L
ABORATORIAL ANALYSISCollection of biological samples occurred in each hospital, in the same visit as the other procedures. Morning fast was recommended.
Data of each test result was displayed with an accuracy of 0.1 and presented in international standard units, except for a few, where other units are more commonly used: cholesterol (total, LDL and HDL), triglycerides, alanine aminotransferase, aspartate aminotransferase and gamma-glutamyl transferase (46). Since reference values for some parameters were slightly different according to the diverse hospital laboratories, results are described as normal, high or low in relation to the reference values of each specific laboratory. In the case of c-reactive protein and folic acid levels, in which results were presented as higher or lower than a certain threshold, that value was used as the result for the purpose of statistical analysis.
V. Q
UALITY OF HEALTH ASSESSMENTThe MPS Health Assessment Questionnaire (HAQ), an instrument to assess functional status, capabilities and performance, was applied to patients older than 14 years of age, unless cognitive impairment was present (47, 48). In these cases, parents or legal guardians provided answers, as with children younger than 14 years of age.
The questionnaire is composed by two parts, concerning daily living activities (part I) and the need for assistance (part II). Part I consists of a series of 39 questions related to activities of daily living, grouped by domains. To each question, patients or parents should attribute, through a Likert scale type, a score according to the level of difficulty in performing the activity. It ranges from “Not difficult at all” (=0) to “Extremely difficult” (=10). When the patient cannot complete the task, a check box with the mention “Unable to do” is available to point out. Part II of the questionnaire corresponds to a series of 13 items related to categories of assistance. Each present four options according to the level of caregiver assistance needed, from “independent” to “need of complete assistance”.
Respecting data analysis of Part I, it was considered the desirable age of competence acquisition the one established in the Vineland Scale (49). When it is presented as a range (example: 2 to 3 years), maximum age was considered for the analysis. When the activities needed competences of ages higher than the present age of the individual, the associated question was not considered because it was found not appropriate or expected for that age. In the case of a patient who has already acquired the competence although it wasn’t expected for that age, it was still considered for total score calculation.
For each domain of Part I, a score was obtained by the sum of all responses (varying from 0 to 11, which was credited when the “unable to do” box was marked), divided by the number of answered questions. Each category can be compared to each other since all have the same metrics, as well as total score does.
Part II score was obtained by the sum of scores (1=independent; 2=minimal assistance required; 3=moderate assistance required; 4=complete assistance required) of all 13 domains, divided by number of domains.
S
TATISTICAL ANALYSIS
Mean (M), standard deviation (SD), minimum and maximum are presented for ordinal variables. Nominal variables results are presented in absolute and relative frequencies (n and %).
The significance level of 0.05 was considered, when inferential statistics was performed (51).
The small sample size and the distribution of the subjects by the categories of nutritional intake, with a substantial proportion in only one option, determined the selection of nonparametric statistical tests (52, 53). When it was intended to compare the scores obtained by two groups, the Mann-Whitney U test was calculated. Kruskal-Wallis test was calculated to compare three groups. In both cases, to accommodate the effects of a reduced sample and considering that some groups had a very small number of subjects, the exact p value was calculated (54). If Kruskal-Wallis results were significant, post hoc tests were calculated using the pairwise comparisons procedure of SPSS 22.0 (Dunn-Bonferroni).
Inferential statistics was not calculated when only one group obtained more than one observation. Also, in cases where one of the three cells obtained only one observation this was not considered to the inferential analysis. Spearman correlations (rho) were calculated in it was intended to test associations between variables. Spearman's correlation is the nonparametric alternative to Pearson's correlation (51). The option for this non-parametric test had to do with the small sample size. The interpretation of the Spearman correlation is identical to that of Pearson, and its significance (p<0.05), its signal (positive or negative) and its magnitude (-1 to 1) were considered. In the interpretation of the magnitude was considered the proposal of Cohen (1988): between 0.10 and 0.29 the correlation is weak; between 0.30 and 0.49 moderate; and between 0.50 and 1.0 strong. The magnitudes of the correlations were interpreted even when this was not significant, taking this information as merely descriptive of the relationship between the variables in the study sample. Some variables have missing data. In order to preserve as much as possible the sample size, the pairwise method was used, which consists of using all the available information for each pair of variables. In this way, the n varies in each cross between variables (correlation or test of differences). Considering that this is an exploratory study of a rare population, this method allows optimizing the data collected (55). To test the independence of two nominal variables in the distribution, the Fisher Exact test was performed as an alternative to the Chi-square test (56).
Each MPS type group (except MPS VII) and patients submitted to ERT were compared to others as a set, in what concerns to age at diagnosis, selected nutritional status parameters (BMI z-score; phase angle; plasma pre-albumin, retinol binding protein (RBP), creatinine, essential fatty acids and vitamins D, E and A levels), nutritional intake, HAQ scores (by domain and total score) and 6-MWT results. MPS patients were also assembled according to skeleton versus central nervous system major involvement in two groups: MPS I, II, III and MPS VII (central nervous system) and MPS IV and MPS VI (skeleton). Both groups were compared for the same parameters mentioned above.
Differences were tested in the categories of nutritional intake (energy and macronutrients) in percentage of EAR (< 90%, 90 to 110%, > 110%), according to patients age. This parameter was also correlated with selected nutritional status parameters (BMI z-score; plasma pre-albumin, RBP, creatinine, essential fatty acids and vitamins D, E and A levels), HAQ scores (by domain and total score) and total distance walked in 6-MWT. Categories of nutritional intake in percentage of EAR (< 90%, 90 to 110%, > 110%) were also correlated with results from HAQ (scores by domains and total).
E
THICAL APPROVALThis study was submitted to the ethical committees of each Centre, according to the established rules. In one of the centres included in the study (CHSJ), it was mandatory that the investigator didn’t have a personal contact with patients, so there was a need to present the protocol to the nutritionist in that team, and monitor its application. After invitation, each patient and/or his legal guardian (parent or other) met the investigator in order to clarify all the protocol procedures and every possible doubt. Parents or other legal guardians gave a written informed consent; the patient himself, when aged more than 16-year-old and with no mental impairment, gave the consent. An appropriate consent form with a comprehensive description of the protocol, signed by the investigator, was distributed. This investigation was also approved by the Comissão Nacional de Proteção de Dados.
R
ESULTS
I. C
HARACTERIZATION OF THE SAMPLEMPS patients included in this study (31 individuals) were recruited from four national treatment centres: sixteen (51.6%) were followed in Centro Hospitalar Universitário de Coimbra, E.P.E., eight (25.8%) in Centro Hospitalar de São João - Porto, four (12.9%) in Centro Hospitalar do Porto, E.P.E. and three (9.7%) in Centro Hospitalar de Lisboa Norte. The 31 patients, 17 males (54.8%), were aged between 1.7 and 32.7 years (mean 15.0; SD=7.5; median 14.4) (Figure 1; Table S2). Figure 1. Characterization of the sample: distribution per gender and age group (n=31). The sample included five MPS I (16.1%), four MPS II (12.9%), nine MPS III (29.0%; six subtype B and three subtype C), three MPS IV (9.7%), nine MPS VI (29.0%) and one MPS VII (3.2%) patients (Figure 2 and Figure 3). Figure 2. Characterization of the sample: number of patients per type of MPS (n=31). 2 6 5 4 0 5 4 5 0 1 2 3 4 5 6 7
0-4 years 5-11 years 12-18 years >18 years
Nu m be r of p at ie nt s Male Female 5 4 9 3 9 1 MPS I MPS II MPS III MPS IV MPS VI MPS VII
Figure 3. Characterization of the sample: type of MPS by age group (n=31). Patients were diagnosed with MPS at a mean age of 3.2 (SD=3.0; median 2.3) years, ranging from 1 month (0.1 years) to 12.3 years (Table S3). Diagnosis occurred earlier in the MPS VII patient (0.1 years) and in MPS I (2.2 ± 2.3 years; median 2.0) and MPS VI (2.3 ± 1.3 years; median 2.0) patient groups. MPS IV and MPS II patients were diagnosed later, at 5.5 (SD=5.3; median 5.0) and 5.7 (SD=5.7; median 2.6) years, respectively (Table S3). MPS types (except MPS VII) were compared according to mean age at diagnosis (Figure 4). No statistical significant difference was found. Figure 4. Characterization of the sample: age at diagnosis per type of MPS (n=31). 0 1 2 3 4 5
MPS I MPS II MPS III MPS IV MPS VI MPS VII
Nu m be r of p at ie nt s
0-4 years 5-11 years 12-18 years >18 years
0 2 4 6 8 10 12 14
MPS I MPS II MPS III MPS IV MPS VI MPS VII
Ag e (y ea rs ) Min Outlier Max Outlier
Twenty-six patients (83.9%) in this study were under chronic pharmacological treatment (Table S1). Anti-epileptic drugs were regularly used by ten. Nineteen patients were under enzymatic replacement therapy (Figure 5 and Table S1). Figure 5. Characterization of the sample: enzymatic replacement therapy (ERT), per type of MPS (n=31).
Ten patients were taking nutritional supplements. Six were submitted to vitamin D supplements, isolated (MPS I2, MPS I5, MPS II1, MPS VI4 and MPS VI6) or associated with calcium (MPS VI7). This patient was also taking an iron supplement. Folic acid was used by two patients (MPS I2 and MPS I4). Three patients (MPS I5, MPS III1 and MPS III7) mentioned the use of a “complete nutritional supplement” (Table S1). 0 2 4 6 8 10
MPS I MPS II MPS III MPS IV MPS VI MPS VII
Nu m be r of p at ie nt s No-ERT ERT
II.
F
OOD ANDN
UTRITIONAL INTAKEA. R
ECENT NUTRITIONAL INTAKERecent nutritional intake data, based upon the information collected with the 24-hour recall questionnaire, was applied in all cases. A mean caloric intake of 65.4 Kcal/Kg/day was found (SD=29.5; median 52.5), with a minimum of 20.2 Kcal/Kg/day in patient MPS VI5 and a maximum of 133.5 Kcal/Kg/day in patient MPS I5. Macronutrients distribution is present in Figure 6. Additional data, concerning energy, macronutrients and micronutrients is displayed in Table S4 and Table S5 (Supplements). Figure 6. Recent nutritional intake: mean distribution (% of total caloric intake) of macronutrients (n=31).
21.7% 31.0% 44.1% ProteinFat Carbohydrate
B. F
OOD HABITS AND USUAL NUTRITIONAL INTAKETwenty-five individuals (81% of the sample) answered the food-frequency questionnaire on the day nutritional assessment was done. Data is summarized in Table 2 and presented in detail in supplements section (Table S6 to Table S18). Frequency of intake Food / group of food Absolute frequency (relative frequency) Daily Reduced fat milk Yogurt Vegetables soup 15 (60.0%) 12 (48.0%) 11 (44.0%) Weekly Chicken Turkey, rabbit Cow, pork and goatling meats Ham and sausage Sausages Fatty fish such as sardines, mackerel, horse mackerel, salmon, etc. Lean fish such as hake, pouting, gold, etc. Cod Olive oil Butter White bread or toast Rice Pasta like spaghetti, macaroni, etc. Boiled potatoes, baked, stewed and pureed Maria type crackers, water and salt or full Carrots Apple and pear Ice tea 18 (72.0%) 14 (56.0%) 17 (68.0%) 12 (48.0%) 14 (56.0%) 14 (56.0%) 17 (68.0%) 10 (40.0%) 12 (48.0%) 11 (44.0%) 11 (44.0%) 20 (80.0%) 20 (80.0%) 22 (88.0%) 13 (52.0%) 13 (52.0%) 9 (36.0%) 10 (40.0%) Monthly Eggs Other soft drinks, fruit juices or nectars packed Hamburger 10 (40.0%) 7 (28.0%) 11 (44.0%) Never (or less than once a month) Other food 10 (40.0%) - 25 (100.0%) Table 2. Food habits (mode): absolute and relative frequencies (n=25). Data concerning energy and macronutrients, obtained through food-frequency questionnaire results, is shown in Figure 7 and in Table S19 in supplements section.
Figure 7. Usual nutritional intake: mean distribution (% of total caloric intake) of macronutrients (n=25). A mean caloric intake of 77.5 Kcal/Kg/day was found (SD=38.7; median 72.6), ranging from 395.2 Kcal in a 12-year-old MPS III boy (MPS III6) to 3910.1 Kcal in an 11- years-old MPS II boy (MPS II4) (Table S19).
Fifty six percent of the subjects showed a lower caloric intake than recommendations. In 28.0% the intake was higher than recommended. In 4 patients (MPS I1, MPS I3, MPS II2, MPS VI2), caloric intake was considered adequate (Figure 8; Table S20 to Table S22).
Data related to energy intake adequacy per type of MPS is displayed in Figure 9 and Table S23.
Protein intake was considered adequate in 44.0% of the subjects, with a mean ingestion of 97.8 grams per day (Table S25). A minimum intake of 23.5g and a maximum of 160.6g were found in the same patients in whom caloric intake was the lowest and the highest, respectively MPS III6 and MPS II4 (Table S19).
Eight patients showed inadequate intake of this nutrient; in the total sample, adequacy was 102.6%. Inadequate intake was more prevalent in patients with 5 to 11 years of age (55.6%) and in MPS VI patients (55.6%) (Figure 8; Table S26 to Table S29).
Concerning carbohydrates, 64.0% of the subjects had an intake lower than recommendations (Table S25). The lowest was 44.6g and the highest was 626.6g, in the same patients mentioned above (MPS III6 and MPS II4, respectively) (Table S19).
Mean adequacy was 87.9% in the total sample (Table S25). Inadequate intake of carbohydrates was of 77.8% among patients aged between 12 and 18 years, and 100.0% in adults (Table S26 and Table S27). All MPS I patients and 66.7% of MPS VI showed an inadequate carbohydrate intake (Figure 8; Table S28 and Table S29). 20.5% 32.4% 48.3% Protein Fat Carbohydrate
Fiber intake ranged from 5.1 to 76.2 grams per day (mean 20.6; SD15.8) (Table S19). Nineteen patients (76.0%) showed lower intake than recommendations. The mean adequacy of fat intake was 110.6 % (SD 20.0) in the total sample tested (25 patients) (Table S25 to Table S29). It was adequate in 52.0% (mean 69.9g; SD 24.5g) (Table S19). The lowest intake (11.3g) was found in MPS III6, the boy mentioned above, which was considered adequate in percentage of the caloric intake. The highest (364.4g) was observed in a 6-year-old MPS I girl (MPS I2). Regarding omega 3 fatty acids, 18 patients (63.8%) showed an inadequate intake, reaching the lowest mean of adequacy in MPS VI patients group. Two patients showed adequate intake of omega 6 fatty acids (MPS VI7 and MPS VI9), whereas 23 had an intake lower than EAR (Figure 8 and Table S25). Figure 8. Usual nutritional intake in MPS patients (energy and macronutrients): number of patients consuming lower, adequate and higher than recommendations (n=25).
In Figure 9, presented next, adequacy of energy and macronutrients intake is displayed according to type of MPS. No statistical significant differences were found in energy and macronutrients intake between different groups of MPS types. More detailed data is showed in Table S24 and Table S28. Adequacy of energy and macronutrients intake was similar in MPS patients with major central nervous system involvement (MPS I, II, III and VII) and major skeleton involvement (MPS IV and VI). 16 23 18 3 8 14 7 2 6 13 11 4 2 1 9 6 7 0 10 20 Carbohydrate Omega 6 fatty acid Omega 3 fatty acid Fat Protein Energy Number of patients Low Adequate High