DETERMINANTS OF WEIGHT AND HEALTH STATUS
PERCEPTION AMONG PORTUGUESE ADULTS
Poínhos RI, Correia FI,II, Durão CII, Franchini BI,II, Rodrigues SI,II, Afonso CI,II, Moreira PI,II, Teixeira VHI,II, Pinho OI,II, Silva DI,II, Lima
Reis JPII, Veríssimo MTII, de Almeida MDVI,II
Abstract
The aims of this research were to evaluate BMI categories, discrepancies between measured and reported BMI, health status’ perception and factors perceived as having the greatest importance in health, as well as to relate them with potencial determinants among the Portuguese adult population. Data from the study “Por-tuguese Population’s Food Habits and Lifestyles” were used (national representative sample of 3529 subjects). Although the prevalence of obesity seems to be decreasing, overweight is still observed in about half of the Por-tuguese adults; furthermore, its proportion may even be increasing in men. There was a positive association between age and BMI and the highest proportions of overweight were found in subjects with lower education levels. Values of measured BMI were higher than refered BMI. Older and less educated men underestimated more their BMI, as well as subjects with higher BMI. Portuguese adults showed a high health status perception and selected “food”, “stress”, “practicing exercise”, “smoking” or “drinking alcohol” as factors with greater importance in health. These factors were also associated with higher health status’ perception.
Key-words:
Weight; Health; Determinants; Adults; Portuguese.
Resumo
Foi objectivo deste trabalho avaliar na população adulta portuguesa as categorias de IMC, discrepâncias entre o IMC reportado e medido, percepção do estado de saúde e factores referidos como tendo maior impor-tância na saúde, bem como relacioná-los com os seus potenciais determinantes. Foram analisados dados do estudo “Alimentação e Estilos de Vida da População Portuguesa” (amostra de 3529 indivíduos representativa da população portuguesa). Apesar de a prevalência de obesidade parecer estar a diminuir, metade dos portugueses adultos apresentam excesso de peso; para além disso, a sua proporção poderá estar a aumentar nos homens. Verificou-se uma associação positiva entre a idade e o IMC, e as maiores proporções de excesso de peso foram encontradas nos indivíduos menos escolarizados. Os valores de IMC medidos foram superio-res aos reportados. Os homens mais velhos e menos escolarizados subestimaram mais o seu IMC, tal como os indivíduos com maior IMC. A população adulta portuguesa mostrou uma elevada percepção do seu estado de saúde e seleccionou “a alimentação”, “o stresse”, “praticar actividade física”, “fumar” e “o consumo de bebidas alcoólicas” como os factores com maior importância na saúde. Estes factores estavam também as-sociados a uma percepção mais favorável do estado de saúde.
Palavras-chave:
Peso; Saúde; Determinantes; Adultos; Portugueses.
INTRODUCTION
The influence of lifestyles on the incidence and prevalence of non-transmissible chronic diseases, and their impact on public and individual health, justifies the importance of studying their distribution in the population and to identify the relationships between them. The prevalence of overweight/obesity is a major public health
I Universidade do Porto – Faculdade de Ciências da Nutrição e Alimentação. II Sociedade Portuguesa de Ciências da Nutrição e Alimentação.
prevent and revert this pandemia. Health status perception is a general indicator of physical and psychological well-being and reflects different lifestyles’ variables. The knowledge about the factors perceived to have major influence in health, and their relation with health status, are key factors to tailor public health interventions according to the population characteristics and to the success of these interventions.
The main aims of this research were: (1) to evaluate BMI categories’ among the Portuguese adult population; (2) to compare BMI assessed by measured and self-reported weight and height in Portuguese adults; (3) to relate the discrepancies between measured and reported BMI with socio-demographic variables and measured BMI; (4) to evaluate the determinants of health status perception among the Portuguese adult population; (5) to evaluate the factors perceived by the Portuguese adult population as having the greatest importance in health; (6) to relate the selection of factors perceived by the Portuguese adult population as having the greatest importance in health with socio-demographic and health characteristics; and (7) to compare health status’ perception among Portuguese adults who identify different factors as main influences in health.
PARTICIPANTS AND METHODS
Data from the study “Portuguese Population’s Food Habits and Lifestyles” were used. This epidemiological cross-sectional study was designed and promoted by the Portuguese Society of Nutrition and Food Sciences with the support of Nestlé, within a protocol of scientific sponsorship between the two institutions. Its main aim is to evaluate the nutritional status, food intake, health-related variables and other lifestyles’ dimensions of the portuguese population. The data used in this paper refers to the first phase of the study, which evaluated Portuguese adults. A national representative sample of 3529 subjects (52.2% females; ages between 18 and 93 years-old) was interviewed at home from February to April 2009. Due to incompleteness of some records, the number of subjects used in each analysis may vary but this is indicated in the corresponding table. The number of subjects in each group is not presented, because the sub-samples were weighted to assure national representativeness.
The general methodological aspects of the study “Portuguese Population’s Food Habits and Lifestyles” are
presented elsewhere1. We present below the methodological aspects directly related to the results presented
in this paper.
Participants were first asked about their current weight and height and subsequently these measurements were done according to standardized procedures. Fifty-five subjects refused to be weighted and/or to have their height measured. BMI was calculated, as well as the percentual discrepancies between measured and reported
BMI ([measured – refered] / [measured x 100]). BMI was categorized according to WHO2. Health status was
evaluated by the EQ-5D3. The EQ visual analogue scale rates the subject’s own assessment of health status (0
= worst imaginable health; 100 = best imaginable health). Subjects were asked to select (from a list of nine)
the two factors which had the greater importance in health4. Physical activity was evaluated by the International
Physical Activity Questionnaire (IPAQ)5.
Descriptive statistical analyses consisted of the calculation of means and standard deviations (cardinal variables) or frequencies (ordinal and nominal variables). Means were compared using independent-samples t tests and univariate ANOVA. Mean ranks were compared using Mann-Whitney and Kruskal-Wallis tests. The association be-tween variables was measured using Pearson’s and Spearman’s correlation coeficients. Binary logistic regression models were computed to estimate the odds of lower perception of own health status (EQ visual analogue scale under the median) among Portuguese adults according to their sex, age and education levels, civil status, professional occupation, region of residence, BMI category, physical activity level, smoking habits and problems identificated in each of the EQ-5D dimensions (mobility, self-care, usual activities, pain/discomfort and anxiety/ depression) (OR adjusted for all other variables). Binary logistic regression models were computed to estimate the odds of selecting each of the factors with greater importance in health according to sex, age, education level, civil status, professional occupation, region of residence, BMI category, physical activity level and smoking hab-its (OR adjusted for all other variables). Health status’ perception was compared between subjects who did or
didn’t identify each of the factors with influence in health. Statistical analysis was performed with SPSS version 14.0 (SPSS, Inc., Chicago, USA) for Windows. A p-value below 0.05 was considered to be statistically significant.
RESULTS
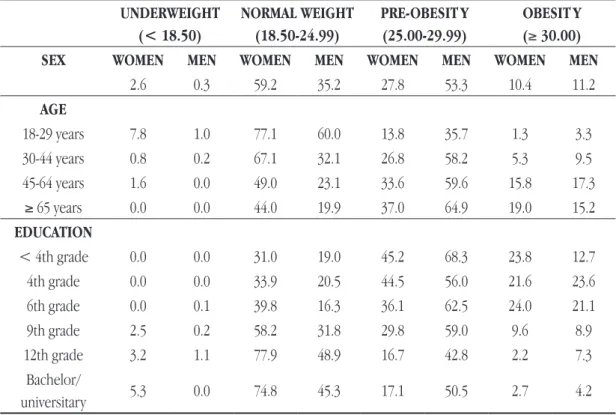
Table 1 shows the distribution of subjects by BMI categories according to sex, age and education level. Most women have BMI in the range corresponding to normal-weight, while 64.5% of men have BMI equal to or great-er than 25. In all age groups thgreat-ere was a highgreat-er prevalence of ovgreat-erweight in men. Thgreat-ere was a significant positive association between age and BMI in both women (r = 0.399, p <0.001) and men (r = 0.354, p <0.001). The prevalence of underweight was highest among women between 18 and 29 years (7.8%). The highest propor-tions of overweight were found in subjects with lower education levels.
Table 1 — BMI categories’ (%) by sex, age and education level (n=3474)
UNDERWEIGHT (< 18.50) NORMAL WEIGHT (18.50-24.99) PRE-OBESIT Y (25.00-29.99) OBESIT Y (≥ 30.00)
SEX WOMEN MEN WOMEN MEN WOMEN MEN WOMEN MEN
2.6 0.3 59.2 35.2 27.8 53.3 10.4 11.2 AGE 18-29 years 7.8 1.0 77.1 60.0 13.8 35.7 1.3 3.3 30-44 years 0.8 0.2 67.1 32.1 26.8 58.2 5.3 9.5 45-64 years 1.6 0.0 49.0 23.1 33.6 59.6 15.8 17.3 ≥ 65 years 0.0 0.0 44.0 19.9 37.0 64.9 19.0 15.2 EDUCATION < 4th grade 0.0 0.0 31.0 19.0 45.2 68.3 23.8 12.7 4th grade 0.0 0.0 33.9 20.5 44.5 56.0 21.6 23.6 6th grade 0.0 0.1 39.8 16.3 36.1 62.5 24.0 21.1 9th grade 2.5 0.2 58.2 31.8 29.8 59.0 9.6 8.9 12th grade 3.2 1.1 77.9 48.9 16.7 42.8 2.2 7.3 Bachelor/ universitary 5.3 0.0 74.8 45.3 17.1 50.5 2.7 4.2
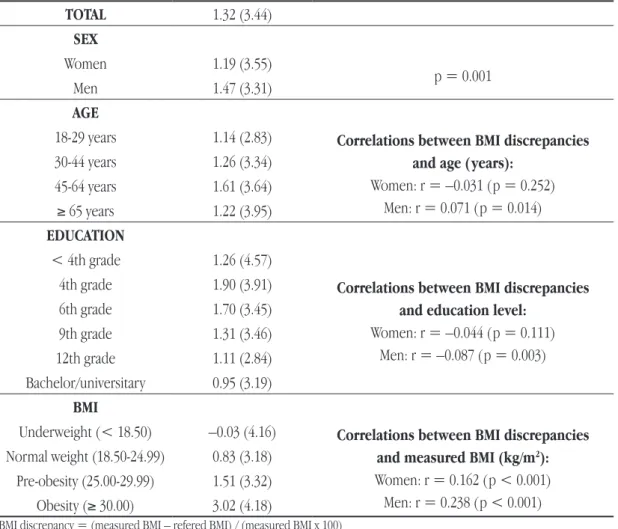
Table 2 presents the mean BMI discrepancies by sex, age, education level and measured BMI category. Globally, values of measured BMI were significantly higher than refered BMI. However, the associations between refered and measured weight, height and BMI were very strong (r > 0.97 and p < 0.001 for all). The discrepancy between them was lower in women compared to men (1.19 vs. 1.47%). Significant correlations between the percentual discrepancy between measured and refered BMI and age and education level showed greater un-derestimation in older and less educated men, although being very weak (|r| < 0.1). BMI was significantly associated with its percentual underestimation.
Table 3 shows mean values on the EQ visual analogue scale, as well as the determinants of lower (below median) health status perception. Portuguese adults showed high health status perception, with a median of 80 on the EQ visual analogue scale. Only 7.0% of the Portuguese adult population rated their health status below the middle point of the scale. Older, underweight (vs. normal weight), widowed (vs. married), unemployed (vs. active) and living in any region except the North were found to have a lower perception of health status. The presence of problems in three of the five EQ-5D dimensions (mobility, pain/discomfort and anxiety/depression) was also associated with lower perception of health status.
Table 2 — Mean (sd) BMI discrepancies by sex, age, education level and measured BMI category
(n=3474)
TOTAL 1.32 (3.44) SEX Women 1.19 (3.55) p = 0.001 Men 1.47 (3.31) AGE18-29 years 1.14 (2.83) Correlations between BMI discrepancies
and age (years): Women: r = –0.031 (p = 0.252) Men: r = 0.071 (p = 0.014) 30-44 years 1.26 (3.34) 45-64 years 1.61 (3.64) ≥ 65 years 1.22 (3.95) EDUCATION < 4th grade 1.26 (4.57)
Correlations between BMI discrepancies and education level:
Women: r = –0.044 (p = 0.111) Men: r = –0.087 (p = 0.003) 4th grade 1.90 (3.91) 6th grade 1.70 (3.45) 9th grade 1.31 (3.46) 12th grade 1.11 (2.84) Bachelor/universitary 0.95 (3.19) BMI
Underweight (< 18.50) –0.03 (4.16) Correlations between BMI discrepancies
and measured BMI (kg/m2):
Women: r = 0.162 (p < 0.001) Men: r = 0.238 (p < 0.001)
Normal weight (18.50-24.99) 0.83 (3.18)
Pre-obesity (25.00-29.99) 1.51 (3.32)
Obesity (≥ 30.00) 3.02 (4.18)
BMI discrepancy = (measured BMI – refered BMI) / (measured BMI x 100)
Table 4 presents the proportion of subjects who selected each factor as having greater importance in health, as well as the determinants of this choice. Most of the sample considered “food” as one of the most important health determinants, followed by 27.9% who identified their health to be influenced by “stress”. Due to their importance for the design of health promotion interventions, we highlight the relationships between sex, age and BMI category and factors perceived as influent in health. Men selected more often “practicing exercise” and “smoking”, while women selected more often “the support from family and friends”. Younger subjects selected more often “stress”, “practicing exercise” and “drinking alcohol”, while older subjects selected more often “smoking”, “genetic factors” and “the support from family and friends”. Compared to normal weight subjects, overweight and/or obese subjects selected less “food” and “the environment”, and selected more “the weight”.
Table 3 — Determinants of lower health status perception (n=2811)
HEALTH STATUS
Mean OR OR adj
SEX p=0.001 p=0.520
Female 74.8 1 (reference) 1 (reference)
Male 77.9 0.786 (p=0.001) 0.935 (p=0.520)
AGE p<0.001 p<0.001
18-29 years 85.6 1 (reference) 1 (reference)
30-44 years 80.9 1.972 (p<0.001) 1.691 (p=0.002) 45-64 years 72.7 4.726 (p<0.001) 2.987 (p<0.001) ≥ 65 years 62.6 14.300 (p<0.001) 4.389 (p<0.001) EDUCATION LEVEL p<0.001 p=0.495 < 4th grade 59.1 14.024 (p<0.001) 1.863 (p=0.042) 4th grade completed 66.2 4.025 (p<0.001) 1.224 (p=0.255) 6th grade completed 73.4 2.369 (p<0.001) 1.143 (p=0.473) 9th grade completed 79.3 1.261 (p=0.044) 1.079 (p=0.580) 12th grade completed 81.9 0.823 (p=0.078) 1.098 (p=0.486)
Bachelor/universitary 80.0 1 (reference) 1 (reference)
CIVIL STATUS p<0.001 p=0.028
Married 75.7 1 (reference) 1 (reference)
Single 83.7 0.393 (p<0.001) 0.895 (p=0.464)
Separated/divorced 73.1 1.455 (p=0.005) 1.323 (p=0.079)
Widowed 61.2 5.000 (p<0.001) 1.590 (p=0.019)
PROFESSIONAL OCCUPATION p<0.001 p<0.001
Active 79.1 1 (reference) 1 (reference)
Student 87.3 0.353 (p<0.001) 0.981 (p=0.922)
Unemployed 74.4 1.923 (p<0.001) 2.570 (p<0.001)
Housewife/househusband 67.1 3.636 (p<0.001) 1.217 (p=0.402)
Retired 64.1 4.609 (p<0.001) 0.905 (p=0.607)
REGION OF RESIDENCE p<0.001 p<0.001
Norte 82.9 1 (reference) 1 (reference)
Centro 72.6 3.091 (p<0.001) 4.364 (p<0.001) LVT 72.1 2.559 (p<0.001) 3.657 (p<0.001) Alentejo 74.0 1.940 (p<0.001) 1.792 (p=0.009) Algarve 70.7 3.061 (p<0.001) 4.744 (p<0.001) Madeira 71.2 3.050 (p<0.001) 4.177 (p<0.001) Açores 76.7 1.862 (p=0.020) 2.157 (p=0.017) BMI CATEGORY p<0.001 p=0.042 Underweight (< 18.50) 75.0 1.371 (p=0.300) 2.201 (p=0.028)
Normal (18.50-24.99) 80.0 1 (reference) 1 (reference)
Pre-obesity (25.00-29.99) 73.9 1.878 (p<0.001) 1.208 (p=0.081)
Obesity (≥ 30.00) 68.7 3.571 (p<0.001) 1.304 (p=0.127)
PHYSICAL ACTIVIT Y LEVEL p<0.001 p=0.155
High 79.0 1 (reference) 1 (reference)
Moderate 76.7 1.240 (p=0.013) 1.241 (p=0.053)
Low 72.2 2.071 (p<0.001) 1.149 (p=0.304)
SMOKING HABITS p<0.001 p=0.370
Never smoked 76.1 1 (reference) 1 (reference)
Ex-smoker 72.8 1.338 (p=0.007) 0.999 (p=0.996)
Smoker 78.8 0.750 (p=0.001) 1.161 (p=0.178)
MOBILIT Y p<0.001 p<0.001
No problems 79.0 1 (reference) 1 (reference)
Some/severe problems 55.1 23.755 (p<0.001) 5.027 (p<0.001)
SELF-CARE p<0.001 p=0.340
No problems 77.2 1 (reference) 1 (reference)
Some/severe problems 52.6 19.874 (p<0.001) 1.603 (p=0.340)
USUAL ACTIVITIES p<0.001 p=0.794
No problems 78.1 1 (reference) 1 (reference)
Some/severe problems 56.1 10.844 (p<0.001) 1.075 (p=0.794)
PAIN/DISCOMFORT p<0.001 p<0.001
No problems 81.2 1 (reference) 1 (reference)
Some/severe problems 62.9 7.525 (p<0.001) 2.699 (p<0.001)
ANXIET Y/DEPRESSION p<0.001 p<0.001
Table 4 — Determinants of factors perceived as influent in health (n=2855)
Food Str ess Practicing exer cise Smoking The weight The environment Genetic factors Drinking alcoholThe support from family and friends
57.5% 27.9% 20.5% 19.5% 15.6% 13.5% 10.3% 8.6% 5.9% OR adj p OR adj p OR adj p OR adj p OR adj p OR adj p OR adj p OR adj p OR adj p SEX (vs. F emale) 0.526 0.255 0.017 0.007 0.136 0.432 0.716 0.213 < 0.001 Male 1.057 0.526 0.896 0.255 1.289 0.017 1.345 0.007 0.840 0.136 0.907 0.432 0.950 0.716 1.208 0.213 0.492 < 0.001 AGE (vs. 18-29 years) 0.948 < 0.001 0.008 0.014 0.699 0.072 0.011 0.001 0.005 30-44 years 1.057 0.710 1.150 0.361 0.883 0.447 1.070 0.718 1.028 0.895 1.671 0.022 1.690 0.041 0.357 < 0.001 1.103 0.780 45-64 years 1.082 0.616 0.658 0.012 0.581 0.003 1.590 0.018 1.165 0.484 1.849 0.009 2.336 0.001 0.466 0.004 1.707 0.125 ≥ 65 years 1.022 0.920 0.498 0.006 0.523 0.032 1.890 0.027 0.988 0.965 1.774 0.068 2.663 0.005 0.395 0.011 3.995 0.002 EDUCA
TION LEVEL (vs. Bachelor/
universitar y) 0.102 0.105 < 0.001 0.056 0.055 0.026 0.047 0.203 < 0.001 < 4th grade 0.773 0.214 0.489 0.013 0.168 < 0.001 0.670 0.165 0.761 0.323 0.506 0.030 0.684 0.231 1.773 0.118 0.742 0.507 4th grade 1.208 0.209 0.677 0.025 0.353 < 0.001 0.760 0.157 0.816 0.307 1.080 0.708 0.549 0.013 1.688 0.042 1.508 0.207 6th grade 0.866 0.374 0.943 0.738 0.271 < 0.001 0.909 0.637 1.321 0.177 0.715 0.169 0.911 0.708 1.515 0.138 3.313 < 0.001 9th grade 0.903 0.394 0.904 0.428 0.645 0.001 1.241 0.131 0.872 0.419 0.836 0.308 0.850 0.403 1.202 0.389 1.417 0.239 12th grade 1.003 0.978 0.885 0.324 0.479 < 0.001 0.912 0.530 1.216 0.226 1.158 0.378 1.188 0.358 0.912 0.676 1.592 0.101 CIVIL ST ATUS (vs. Married) 0.053 < 0.001 0.083 0.217 0.829 0.689 0.894 0.438 0.242 Single 0.993 0.960 0.879 0.353 1.433 0.016 1.399 0.038 0.855 0.386 0.889 0.535 0.979 0.919 0.820 0.398 1.172 0.566 Separated/divorced 0.919 0.544 1.271 0.097 1.097 0.606 1.057 0.751 1.030 0.872 1.071 0.718 0.873 0.536 1.176 0.515 0.768 0.405 Widowed 0.670 0.006 0.441 < 0.001 0.838 0.468 1.122 0.563 0.949 0.777 1.204 0.356 0.881 0.580 0.736 0.241 1.532 0.095 PROFESSIONAL OCCUP ATION (vs. Active) 0.359 0.001 0.069 0.034 0.047 0.016 0.494 0.189 0.243 Student 0.936 0.681 0.802 0.193 1.231 0.225 1.307 0.165 1.333 0.203 1.157 0.566 0.857 0.606 0.930 0.783 1.250 0.534 Unemployed 0.725 0.039 0.497 < 0.001 1.139 0.479 0.979 0.914 1.601 0.017 1.898 0.001 1.130 0.625 1.448 0.138 1.447 0.223 Housewife/househusband 0.922 0.669 1.420 0.094 1.924 0.009 0.357 0.005 1.097 0.703 1.390 0.184 1.425 0.192 0.583 0.158 0.750 0.406 Retired 0.926 0.631 1.075 0.702 1.035 0.883 0.783 0.256 1.504 0.042 0.957 0.845 0.906 0.682 1.181 0.533 0.547 0.069 REGION OF RESIDENCE (vs. Norte) < 0.001 0.004 0.582 0.002 0.027 < 0.001 < 0.001 0.001 0.015 Centro 1.101 0.397 0.998 0.985 0.871 0.329 0.688 0.014 0.607 0.002 2.928 < 0.001 1.917 < 0.001 0.332 < 0.001 1.076 0.780 LV T 0.712 < 0.001 1.218 0.064 0.891 0.329 1.186 0.147 1.032 0.799 1.757 < 0.001 0.539 < 0.001 0.830 0.240 1.853 0.003 Alentejo 0.883 0.505 1.831 0.002 1.040 0.871 0.607 0.068 0.758 0.287 1.413 0.219 0.361 0.018 0.486 0.051 1.879 0.070 Algar ve 0.703 0.132 0.820 0.472 1.340 0.285 0.797 0.468 1.019 0.952 1.633 0.154 0.661 0.343 0.765 0.511 2.755 0.011 Madeira 0.394 0.001 1.275 0.384 0.956 0.892 1.452 0.217 1.122 0.723 2.178 0.030 1.220 0.610 0.986 0.973 2.030 0.150 Açores 0.762 0.322 2.130 0.008 1.377 0.335 1.522 0.189 0.551 0.153 1.114 0.823 0.680 0.454 1.120 0.777 2.232 0.098 BMI CA TEGORY (vs. Nor mal 18.50-24.99) < 0.001 0.619 0.669 0.853 < 0.001 0.024 0.314 0.071 0.063 Under weight (< 18.50) 1.313 0.404 1.140 0.683 0.734 0.386 0.865 0.717 2.040 0.050 0.512 0.236 1.185 0.757 0.596 0.436 1.780 0.300 Pre-obesity (25.00-29.99) 0.634 < 0.001 0.894 0.268 0.901 0.359 1.037 0.755 1.406 0.006 0.991 0.942 1.202 0.202 1.134 0.440 1.084 0.683 Obesity ( ≥ 30.00) 0.441 < 0.001 1.021 0.895 0.977 0.908 1.149 0.429 2.412 < 0.001 0.544 0.007 0.820 0.428 1.748 0.013 1.826 0.016 PHYSICAL ACTIVIT Y LEVEL (vs. High) < 0.001 < 0.001 0.038 0.213 0.057 0.001 0.359 0.981 0.580 Low 1.131 0.272 1.629 < 0.001 0.703 0.016 1.266 0.098 1.208 0.199 0.681 0.016 0.808 0.238 0.964 0.855 0.789 0.318 Moderate 1.560 < 0.001 1.323 0.008 0.953 0.669 1.178 0.163 0.890 0.367 0.624 < 0.001 0.812 0.178 0.993 0.967 0.940 0.753
SMOKING HABITS (vs. Never smoked)
< 0.001 < 0.001 0.087 < 0.001 0.008 0.003 0.046 0.117 0.035 Ex-smok er 0.862 0.201 1.037 0.782 0.919 0.577 1.880 < 0.001 0.929 0.624 1.257 0.136 0.867 0.448 1.130 0.530 0.470 0.010 Smok er 0.631 < 0.001 1.562 < 0.001 0.776 0.027 3.074 < 0.001 0.652 0.002 0.689 0.013 0.660 0.013 0.741 0.085 0.842 421
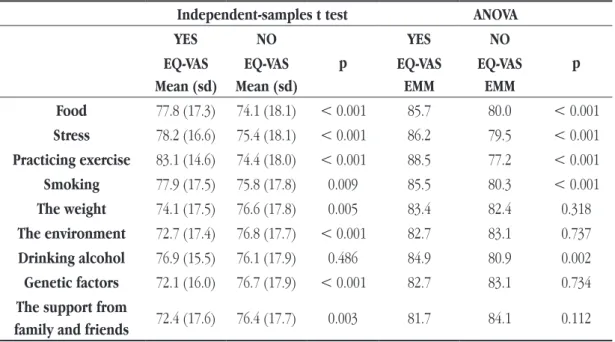
Table 5 compares health status perception between subjects who refered or not each of the factors perceived as influent in health. Health status’ perception was significantly different between subjects who refered or not each of the health determinants, except “drinking alcohol”. Participants who indicated “food”, “stress”, “practicing exercise” or “smoking” as main influences in health reported higher health status’ perception. On the contrary, those who referred “the weight”, “the environment”, “genetic factors” or “support from family and friends” reported lower health status’ perception. Considering all the nine factors in the ANOVA model, the ones with significant influence in health status’ perception were “food”, “stress”, “practicing exercise”, “smoking” and “drinking alcohol”. Participantes who indicated these factors reported higher health status’ perception.
Table 5 — Health status’ perception and factors perceived as influent in health (n=2835)
Independent-samples t test ANOVA
YES NO p YES NO p EQ-VAS Mean (sd) EQ-VAS Mean (sd) EQ-VAS EMM EQ-VAS EMM Food 77.8 (17.3) 74.1 (18.1) < 0.001 85.7 80.0 < 0.001 Stress 78.2 (16.6) 75.4 (18.1) < 0.001 86.2 79.5 < 0.001 Practicing exercise 83.1 (14.6) 74.4 (18.0) < 0.001 88.5 77.2 < 0.001 Smoking 77.9 (17.5) 75.8 (17.8) 0.009 85.5 80.3 < 0.001 The weight 74.1 (17.5) 76.6 (17.8) 0.005 83.4 82.4 0.318 The environment 72.7 (17.4) 76.8 (17.7) < 0.001 82.7 83.1 0.737 Drinking alcohol 76.9 (15.5) 76.1 (17.9) 0.486 84.9 80.9 0.002 Genetic factors 72.1 (16.0) 76.7 (17.9) < 0.001 82.7 83.1 0.734 The support from
family and friends 72.4 (17.6) 76.4 (17.7) 0.003 81.7 84.1 0.112
EMM = Estimated marginal mean
DISCUSSION
To our knowledge this is the first study to assess the health status perception of a representative sample of Portuguese adults. Although the cross-sectional nature of this study doesn’t allow us to conclude on the direction of causality, the knowledge on the association between the studied variables is certainly valuable to maximize the results of public health interventions. The fact that data from a nationally representative sample were analysed regarding such a broad set of variables contributes to the importance of the findings.
When compared with previous results6, the prevalence of obesity between 2003-05 and 2009 in the portuguese
adult population reduced from 14.2 to 10.8%. This reduction was observed both for women (13.4 to 10.4%) and men (15.0 to 11.2%). Although the prevalence of obesity seems to be decreasing, overweight is still observed in about half of the Portuguese adults. Furthermore, its proportion may even be increasing in men: while in women the global prevalence of overweight decreased from 47.8 to 38.2%, in men it increased from 60.2 to 64.5%. The higher proportions of overweight in older and less educated subjects found in this work also was
found in 2003-056.
The underestimation of BMI has been found in other studies, namely in a sample of Portuguese adults7 and in
a review by Gorber et al.8. However, Ramos et al.7 report greater discrepancy between measured and estimated
BMI in women, while our findings indicate the opposite. Regarding the association between BMI discrepancy
and age or BMI, our results are in line with those of Ramos et al.7; although Gorber et al.8 don’t quantitatively
combine the results from the works reviewed, their data show the same trend regarding BMI. Finally, although both studies found an association between education and BMI only for males, our results indicate a greater BMI
Portuguese adults showed a high health status perception and selected “food”, “stress”, “practicing exercise”, “smoking” or “drinking alcohol” as factors with greater importance in health. These factors were also associated with higher health status’ perception. Overall, “food” was the factor more often selected as one of the most important health determinants. It is interesting to notice that overweight subjects tended to select less often “food” than normal weight subjects.
When these results are compared to those from a previous nationally representative sample4,9, it is worth noticing
that “practicing exercise”, “stress” and “genetic factors” are those which are increasingly referred as having greater importance in health. On the other hand, the importance of “drinking alcohol”, “the environment” and “smoking” seems to be decreasing.
The knowledge on factors perceived as major health determinants is useful to design effective health promotion interventions. Our results contribute to understand the determinants of health status’ perception, which may assist the use of motivational strategies in those interventions, specially in groups with lower perception of health status. Future research should explore the causes of lower health status perception being associated with demographic characteristics, as well as the reasons underlying the perception of which factors are more influent in health.
REFERENCES
1 Poínhos R, Franchini B, Afonso C, Correia F, Teixeira VH, Moreira P, et al. Alimentação e estilos de vida da população portuguesa. Alim Hum. 2009; 15(3):43-60.
2 WHO. Obesity: preventing and managing the global epidemic. Report of a WHO consultation on obesity. Geneva: World Health Organisation; 1998.
3 Szende A, Oppe M, Devlin N, editors. EQ-5D Value Sets: Inventory, Comparative Review and User Guide. Dordrecht: Springer; 1997. 4 Kafatos A, Manios Y, Markatji I, Giachetti I, de Almeida MDV, Engstrom LM. Regional, demographic and national influences on atti-tudes and beliefs with regard to physical activity, body weight and health in nationally representative sample in the European Union. Public Health Nutr. 1999; 2(1a):87-95.
5 Craig CL, Marshall AL, Sjöström M, Bauman AE, Booth ML, Ainsworth BE, et al. International physical activity questionnaire: 12-country reliability and validity. Med Sci Sports Exerc. 2003; 35:1381-95.
6 Carmo I, Santos O, Camolas J, Vieira J, Carreira M, Medina L, et al. Overweight and obesity in Portugal: national prevalence in 2003-2005. Obesity Res. 2008; 9:11-9.
7 Ramos E, Lopes C, Oliveira A, Barros H. Unawareness of weight and height - The effect on self-reported prevalence of overweight in a population-based study. J Nutr Health Aging. 2009; 13:310-4.
8 Gorber SC, Tremblay M, Moher D, Gorber B. A comparison of direct vs. self-report measures for assessing height, weight and body mass index: A systematic review. Obes Rev. 2007; 8:307-26.
9 Afonso C. Saúde, actividade física e peso corporal: Contributo para o seu conhecimento numa amostra da população adulta portu-guesa. Tese de Mestrado em Saúde Pública apresentada à Faculdade de Medicina da Universidade do Porto e Instituto de Ciências Biomédicas Abel Salazar. 1999.