ABSTRACT: The objective of this work was to estimate the predicted genetic gains with the simultaneous selection of agronomic and technological traits from elite cotton lines using selection indexes. Data from the evaluation of 36 elite lines were evaluated in three trials located in Apodi-RN in 2013 and 2014 and Santa Helena, GO, Brazil in 2013, in a randomized block design with two replicates. The agronomic traits evaluated were: plant height (PH), average boll weight (ABW), percentage of fibers (PF) and seed cotton yield (YIE). In 20 bolls from each experimental unit, the following technological fiber traits were evaluated: fiber length (UHM), fiber uniformity (UNIF), short fiber index (SFI), fiber strength (FS), elongation (ELON), micronaire (MIC), reflectance (RD) and degree of yellowing (+b). Smith and Hazel, Pesek and Baker and Mulamba and Mock selection indexes were
PLANT BREEDING -
Article
Genetic gains in agronomic and technological
traits of elite cotton genotypes
Larissa Pereira Ribeiro1, Luiz Paulo de Carvalho2, Francisco José Correia Farias2, Josiane Isabela da
Silva Rodrigues2, Paulo Eduardo Teodoro3*, Leonardo Lopes Bhering1
1.Universidade Federal de Viçosa - Viçosa (MG), Brazil.
2.Embrapa Algodão - Centro Nacional de Pesquisa de Algodão - Campina Grande (PB), Brazil. 3.Universidade Federal de Mato Grosso do Sul - Chapadão do Sul (MS), Brazil
*Corresponding author: [email protected]
Received: Sep. 26, 2017 – Accepted: Nov. 30, 2017
tested for selection of the seven superior genotypes, assigning the coefficients of genetic variation (CVg) as economic weight. There were no interaction between genotypes and environments for any of the evaluated traits. Smith and Hazel index resulted in negative gains for fiber length and positive for the traits whose reduction is of interest, such as plant height, micronaire and degree of yellowing. Pesek and Baker index provided positive predictive gains for all traits of interest. However, it promoted reduction only to the degree of yellowing. Mulamba and Mock presented satisfactory gains, being the most suitable for selecting genotypes aiming at simultaneous gains in yield and fiber technological components.
INTRODUCTION
Upland cotton (Gossypium hirssutum L.r. latifolium Hutch.) produces one of the most important world’s textile fibers, being one of the main crops of economic importance in Brazil (Carvalho et al. 2015a). In the globalized scenario, Brazil is the third largest exporter of this commodity and the fifth largest producer of seed cotton, with 2.3 million tons produced in the crop in 2016 and 2017 (Conab 2017).
Aiming at becoming competitive in the global cotton market, dominated by the United States, whose fiber is of excellent quality, Brazilian breeding programs seek the selection of genotypes with longer fibers, greater resistance during spinning and baling, decreasing of the short fibers content, greater uniformity of length and mature fibers. All these traits are desirable for increasing processing speed in the textile industry (Smith et al. 2008).
Thus, cotton breeding programs aim to develop genotypes that simultaneously meet a series of attributes of economic interest. However, selection based on one or a few traits may result in unfavorable changes in others, due to the presence of negative genetic correlations between them. Shen et al. (2006) reported negative correlations among agronomical and quality traits, such as fiber length with lint percent and lint yield, and among seed cotton yield with fiber strength and fiber length. Lin et al. (2005), when working with linkage mapping of cotton for assessing cotton fiber quality, found that fiber length was negatively correlated with micronaire values. Negative correlation among fiber strength and short fiber content were also reported by Ulloa (2006). This suggests that it is not satisfactory to improve one variable through indirect selection in another.
Several others authors have reported the existence of negative correlations between agronomic and technological characters in cotton (Carvalho et al. 2005; Hoogerheide et al. 2007; Farias et al. 2016), so that direct selection in one trait will bring unwanted gains to others. To mitigate this problem, breeders utilize selection indexes as a strategy, making it possible to aggregate the multiple information contained in the experimental unit, aiming at selection based on a set of variables that brings together several traits of economic interest (Baxevanos et al. 2008; Cruz et al. 2012; Resende et al. 2014). Technological fiber traits of cotton, such as fiber percentage, fiber length, fiber
uniformity, fiber strength and micronaire are important for breeding of cotton, thus making ordering the best genotypes based on a selection index combining all these characteristics of interest relevant (Resende et al. 2014). As originally defined by Smith (1936), selection indexes attribute subjective economic weights to each trait and are relatively simple to analyze. However, economic weights are a difficult assignment, which has limited the use of selection index. Cruz et al. (2012) suggests that the establishment of economic weights can be performed from their own experimental data and that the coefficient of genetic variation can be a good reference, since it is dimensionless and directly proportional to the genetic variance available, keeping the proportionality between traits.
Currently, there are several proposals for obtaining indexes. Selection index proposed by Smith (1936) and Hazel (1978) consists of a linear combination of economically important traits, whose weighting coefficients are estimated so that the correlation between the index and the aggregate is maximized. Pesek and Baker (1969) proposed an index in which economic weights can be replaced by the desired gains for each trait, which, according to the authors, are easier to determine. Another commonly used index is the sum of posts, proposed by Mulamba and Mock (1978), which consists of classifying the genotypes in relation to each one of the traits in order favorable to improvement, and subsequently, the orders of each genotype referring to each trait are summed, resulting in an additional measurement taken as selection index (Cruz et al. 2012).
Research using selection indexes has been carried out with different crops and has helped the development of superior genotypes (Wells and Meredith 1984; Culp and Green 1992; Santos et al. 2007). However, there is a scarcity of studies about cotton still especially considering agronomic and technological traits simultaneously. The objective of this work is to estimate the predicted genetic gains with the simultaneous selection of agronomic and technological traits from elite cotton lines, using selection indexes.
MATERIAL AND METHODS
Deployment of the trials
fiber were used. To obtain these lines, the seeds from this cross were multiplied from F2 to F4 in greenhouse conditions. Genealogical selection procedure was adopted from generation F4, and in this last generation 271 plants were obtained and 51 plants F4:5 with fiber length ≥ 31 mm were selected. These lines were evaluated by the method proposed by Carvalho et al. (2015a) and 34 plants with fiber length above 32 mm were selected, which were evaluated in the next generation (F5:F6). From these, 32 lines were also selected with fiber length over 32 mm.
These lines were evaluated in three trials located in Apodi, RN, in the northeast region of Brazil, between the years of 2013 and 2014, and Santa Helena,GO, in the central region of Brazil, in 2013, in a randomized block design with two replicates. The trials in Apodi were installed under irrigation regime and in Santa Helena, without irrigation. The plot had two rows of 5 m spaced 0.80 m from each other, leaving up to 60 plants per row. Cultural treatments applied were those normally used for cotton cultivation, being the herbicide and insecticide application performed according to the integrated pest management recommended for the crop in the region.
Traits evaluated
Agronomic traits evaluated were: plant height (PH, cm), average boll weight (ABW, g), percentage of fibers (PF, %) and seed cotton yield (YIE, kg·ha-1). In 20 bolls from each experimental unit, the following technological fiber traits were evaluated: fiber length (UHM, mm), fiber uniformity (UNIF, %), short fiber index (SFI, %), fiber strength (FS, gf·tex-1), elongation (ELON, %), micronaire (MIC, ug·pol-1), reflectance (RD, %) and degree of yellowing (+b) using the HVI (High volume instrument) equipment from the Fibers Laboratory of Embrapa Algodão.
Statistical analysis
Initially, individual analyses of variance were performed for each trait and, after detecting that the relation between the largest and the smallest mean square error of environ-ments did not exceed the 7:1 ratio (Pimentel-Gomes 2009), joint analysis of variance was performed according to the statistical model described in Eq, 1:
Yijk = µ + B/Ejk + Gi + Ej + GEij + eijk (1)
where : Yijk is the observation in the k-th block evaluated in the i-th genotype at the j-th environment; µ is the overall mean of the trials; B/Ejk is the effect of k-block within the j- environment; Gi is the effect of the i-th genotype considered as random; Ej is the effect of the j-th environment considered to be fixed; GEij is the random effect of the interaction between i-genotype and j-environment; eijk is the random error associated with the observation Yijk.
Selection indexes used to predict the gains were the methodologies proposed by Smith (1936) and Hazel (1978), Pesek and Baker (1969) and Mulamba and Mock (1978). Coefficient of genetic variation (CVg) was adopted as the economic weight for all methodologies.
Smith (1936) and Hazel (1978) index was based on the solution of the matrix system, as shown on Eq. 2:
b = P-1Ga (2)
where: b is a vector of 12 × 1 dimension of the index weighting coefficients to be estimated; P-1 is the inverse of the 12 × 12 matrix of phenotypic variances and covariates between the traits; G is the 12 × 12 matrix of genetic variance and covariance among the traits; and a is a 12 × 1 vector of economic weights.
Pesek and Baker (1969) index is based on the desired gains to avoid the inaccuracy of assigning values to economic weights and is defined by Eq. 3:
b = G-1Ägd (3)
where: Ägd is the vector of desired gains; G-1 is the inverse matrix of genetic variance and covariance.
Mulamba and Mock (1978) index initially ranks the geno-types for each trait by assigning higher absolute values to those of better performance. Finally, the values assigned to each trait are summed, obtaining the sum of the ranks, which indicates the genotypes classification (Cruz et al. 2012). All statistical analyses were performed with Genes software (Cruz 2013).
RESULTS AND DISCUSSION
Joint analysis of variance
of genetic variability in the population, which is a favorable indicative for the improvement of the traits. Coefficient of variation (CVe) was less than 20% for all evaluated traits, similar to those obtained in other studies with the cotton crop (Freitas et al. 2007; Martins et al. 2012; Araújo et al. 2013; Jerônimo et al. 2014; Carvalho et al. 2015a, b). There was no significant GxE interaction for any trait, which indicates similar expression of the genes that control these traits in the three environments. Therefore, phenotypic and genotypic covariances used in the indexes were estimated with the genotypes means in the three environments (Tables 1 and 2).
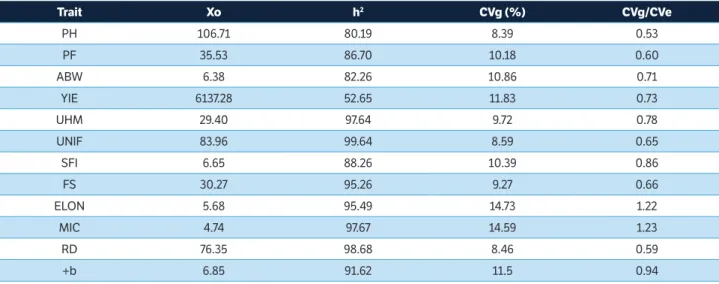
Estimates of genetic parameters allow to better understand the genetic structure of the population and to infer about the genetic variability present in them, providing subsidies to predict the genetic gains and the possible success in the breeding program (Cruz et al. 2012). Except for YIE, whose heritability was 52.65%, while all the other traits evaluated had heritability above 80%, considered high (Table 3). This allows to infer about the predominance of the genetic effect
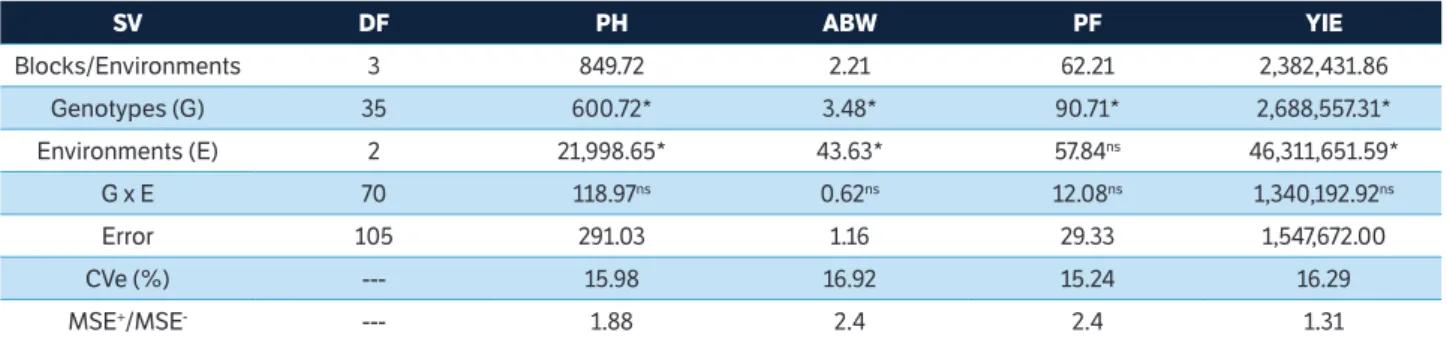
Table 1. Summary of the joint analysis of variance for the agronomic traits plant height (PH), average boll weight (ABW), percentage of fibers (PF) and seed cotton yield (YIE) evaluated in 36 cotton genotypes grown in three environments.
SV DF PH ABW PF YIE
Blocks/Environments 3 849.72 2.21 62.21 2,382,431.86
Genotypes (G) 35 600.72* 3.48* 90.71* 2,688,557.31*
Environments (E) 2 21,998.65* 43.63* 57.84ns 46,311,651.59*
G x E 70 118.97ns 0.62ns 12.08ns 1,340,192.92ns
Error 105 291.03 1.16 29.33 1,547,672.00
CVe (%) --- 15.98 16.92 15.24 16.29
MSE+/MSE- --- 1.88 2.4 2.4 1.31
ns and *: not significant and significant at 5% probability by the F test, respectively; SV: sources of variation; DF: degrees of freedom; CVe: coefficient of variation;
MSE+/MSE-: ratio between the largest and smallest mean square error of the individual analysis.
Table 2. Summary of the joint analysis of variance for the technological traits fiber length (UHM), fiber uniformity (UNIF), short fiber index (SFI), fiber strength (FS), elongation (ELON), micronaire (MIC), reflectance (RD) and degree of yellowing (+b) evaluated in 36 cotton genotypes grown in three environments.
SV DF UHM FS MIC SFI UNIF ELON RD +b
Blocks/Environments 3 12.18 9.31 0.01 0.77 85.88 0.71 0.14 88.77
Genotypes (G) 35 50.18* 49.66* 0.03* 3.25* 313.46* 4.40* 3.39* 253.97*
Environments (E) 2 188.81* 28.41ns 0.01ns 7.77* 48.51ns 2.24ns 0.50ns 90.76ns
G x E 70 1.18ns 2.35ns 0.01ns 0.38ns 1.13ns 0.20ns 0.30ns 3.34ns
Error 105 13.30 16.07 0.01 0.87 99.61 0.66 1.65 88.60
CVe (%) --- 12.41 13.24 12.05 14.05 11.89 14.29 5.44 12.26
MSE+/MSE- --- 1.05 1.18 1.01 1.01 1.01 1.57 3.27 1.03
ns and *: not significant and significant at 5% probability by the F test, respectively; SV: sources of variation; DF: degrees of freedom; CVe: coefficient of variation;
MSE+/MSE-: ratio between the largest and smallest mean square error of the individual analysis.
on the total variation of these traits (Falconer and Mackay 1996), especially of fiber quality, for which the values of heritability ranged from 88.26 (SFI) to 99.64 (UNIF).
Coefficient of genetic variation (CVg) presented a low amplitude, ranging from 8.39% to 14.73% (PH and ELON, respectively), being the highest CVg values obtained for ELON (14.73%) and MIC (14.59%), indicating that among all the traits studied, they showed greater variability, favoring the selection (Carvalho et al. 2005). The CVg/CVe ratio assumed values close to or greater than the unity for the traits MIC, ELON, +b and SFI, which are considered ideal values for selection (Cruz et al. 2012).
The selection based on decreasing PH resulted in negative selection gains for all the other traits, due to decreasing of the variables means (Table 4). Although selecting smaller plants is of interest for the crop, the selection targeting plants of lower PH results in a decrease in all yield and fiber quality traits and, therefore, it is not recommended. In the same way, selection both in ABW and PF offer disadvantages, resulting from negative gains for UHM and PF, which are the main variables of interest in improving the technological traits of cotton.
Selection based on YIE, widely used in most crops, provided positive selection gains for all traits. However, it is of interest for the cotton crop to reduce the variables PH, SFI, MIC and + b, which is not possible with the selection in YIE. Therefore, the selection carried out on any of the main yield components of cotton (PH, SFI, PF and YIE) discourages other traits of interest and/or provides gains in variables whose interest is its reduction.
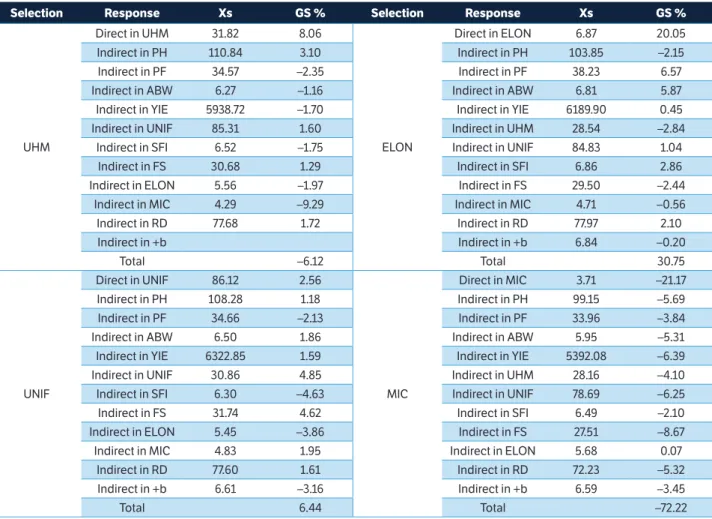
Similarly, to selection based on yield components, selecting any of the fiber technology components promoted undesirable selection gains (Table S1). When the selection is made based on UHM, for example, individuals with lower PF are selected, the same occurring for the selection in UNIF, SFI, FS, MIC and +b.
This allows to infer that selecting any of the fiber technological traits, undesirable selection gains in other traits will occur, since a genotype that presents high means for a given trait may present lower means for another. Thus,
establishing selection indexes involving agronomic and technological traits may be the most promising strategy for the selection of cotton genotypes that simultaneously exibit high seed cotton yield and percentage of fibers and long, uniform and resistant fibers.
Smith (1936) and Hazel (1978) index allowed positive gains for the traits ELON, YIE, ABW, FS, PF, RD and UNIF (Table 5), highlighting the high gains in ELON and YIE (4.68 and 4.88%). However, there were positive selection gains for the traits whose reduction is of interest (PH, MIC and + b), and in the case of MIC, a high selection gain was obtained (11.91). In addition to the undesired increase in PH, SFI, MIC and +b, Smith (1936) and Hazel (1978) index provided negative selection gains for UHM, trait of great importance to the textile industry and one of the main target traits of breeding programs. These results are undesirable for the improving fiber technological traits of the cotton, which allows the inference that selection based on the Smith (1936) and Hazel (1978) index was inefficient in obtaining simultaneous gains in technological and agronomic components.
Studies involving technological traits have been the main research focus of many cotton breeders (Ng et al. 2015). Among the technological traits that still need to be improved, fiber length stands out, since the world market demand for fibers classified as long and extra-long (above 28 and 32 mm, respectively) is increasing. Average fiber length of the upland cotton grown in Brazil in 2013 was 28 mm, classified as medium, with little production of cotton of long
Table 3. Original means (Xo), heritability (h2), coefficient of genetic variation (CVg) and CVg/CVe ratio for agronomic and technological traits,
evaluated in 36 cotton genotypes.
Trait Xo h2 CVg (%) CVg/CVe
PH 106.71 80.19 8.39 0.53
PF 35.53 86.70 10.18 0.60
ABW 6.38 82.26 10.86 0.71
YIE 6137.28 52.65 11.83 0.73
UHM 29.40 97.64 9.72 0.78
UNIF 83.96 99.64 8.59 0.65
SFI 6.65 88.26 10.39 0.86
FS 30.27 95.26 9.27 0.66
ELON 5.68 95.49 14.73 1.22
MIC 4.74 97.67 14.59 1.23
RD 76.35 98.68 8.46 0.59
+b 6.85 91.62 11.5 0.94
PH: plant height (cm); ABW: average boll weight (g); PF: percentage of fibers (%); YIE: seed cotton yield (kg ha-1); UHM: fiber length (mm); UNIF: fiber uniformity
Table 4. Gains estimates based on the direct and indirect selection of agronomic traits in seven of the 36 cotton genotypes evaluated.
Selection Response Xs GS (%) Selection Response Xs GS (%)
PH
Direct in PH 92.59 –10.61
PF
Direct in PF 39.66 10.07
Indirect in PF 34.58 –2.31 Indirect in AP 106.23 –0.36
Indirect in ABW 5.73 –8.06 Indirect in PMC 6.75 5.10
Indirect in YIE 5.503.37 –5.44 Indirect in PROD 6265.83 1.10
Indirect in UHM 26.59 –9.34 Indirect in CF 27.91 –4.93
Indirect in UNIF 78.48 –6.5 Indirect in UNIF 84.96 1.19
Indirect in SFI 6.61 –0.49 Indirect in IFC 6.85 2.64
Indirect in FS 28.00 –7.14 Indirect in RF 29.76 –1.60
Indirect in ELON 5.60 –1.29 Indirect in AL 6.52 14.17
Indirect in MIC 4.56 –3.65 Indirect in MIC 5.32 11.96
Indirect in RD 71.57 –6.18 Indirect in RD 77.90 2.01
Indirect in +b 6.66 –2.49 Indirect in +b 7.10 3.37
ABW
Direct in PMC 7.22 11.11
YIE
Direct in PROD 7402.10 12.17
Indirect in AP 108.90 1.65 Indirect in AP 110.63 5.01
Indirect in PF 37.38 4.52 Indirect in PF 37.20 6.66
Indirect in PROD 6.827.08 5.92 Indirect in PMC 6.72 8.05
Indirect in CF 29.13 –0.88 Indirect in CF 29.48 12.17
Indirect in UNIF 84.92 1.13 Indirect in UNIF 85.22 4.98
Indirect in IFC 6.90 3.31 Indirect in IFC 6.78 5.67
Indirect in RF 29.80 –1.46 Indirect in RF 30.45 6.12
Indirect in AL 6.33 10.96 Indirect in AL 5.86 6.84
Indirect in MIC 4.81 1.41 Indirect in MIC 5.01 6.1
Indirect in RD 78.06 2.21 Indirect in RD 77.97 10.04
Indirect in +b 7.04 2.51 Indirect in +b 6.83 6.02
Xs: mean of selected individuals; PH: plant height (cm); ABW: average boll weight (g); PF: percentage of fibers (%); YIE: seed cotton yield (kg·ha-1); UHM: fiber
length (mm); UNIF: fiber uniformity (%); SFI: short fiber index (%); FS: fiber strength (gf·tex-1); ELON: elongation (%); MIC: micronaire (ug·pol-1); RD: reflectance
(%); +b: degree of yellowing (+b).
or extra-long fiber during the last 10 years (Carvalho et al. 2015a). With the need to improve fiber length in mind, several studies have been carried with the objective of obtaining genetic gains for this variable. Wells and Meredith (1984) and Culp and Green (1992) reported little or no genetic gain for UHM, similar to the results obtained in this study for the Smith (1936) and Hazel (1978) index.
Pesek and Baker (1969) index provided positive predictive gains for all traits of interest (PF, ABW, YIE, UHM, UNIF, FS, ELON and RD), highlighting the high gains in YIE, ABW and ELON (9.40, 4.11 and 4.11%, respectively). However, there was reduction only to + b, so that MIC and SFI presented positive gains, rendering the results obtained by this index unsatisfactory.
Mulamba and Mock (1978) index presented satisfactory selection gains, since negative gains were obtained for PH, MIC
and +b and positive for all other variables, especially the results observed for ELON, ABW and YIE, whose gains were 6.28, 6.02 and 5.02%, respectively. Santos et al. (2007), evaluating the prediction of genetic gains in popcorn using the Smith (1936) and Hazel (1978), Pesek and Baker (1969), Williams (1962) and Mulamba and Mock (1978) indexes, also obtained better results for the selection of half-sib families when using the Mulamba and Mock index (1978), which provided satisfactory gains both for traits whose interest was the increase in gains, and for those in which the achievement of gains were desirable.
Table 5. Means of selected genotypes (Xs) and original (Xo), heritability (h2) and percentage selection gains based on the selection on
the Smith (1936) and Hazel (SH), Mulamba and Mock (MM) and Pesek and Baker (PB) indexes for agronomic and fiber technological traits, evaluated in 36 cotton genotypes.
Trait Xo Xs-SH Xs-MM Xs-PB h2 GS-SH GS-SH (%) GS-PB GS-PB (%) GS-M GS-M (%)
PH 106.71 109.51 106.21 109.24 80.19 2.24 2.10 2.03 1.90 –0.40 –0.38
PF 35.53 36.91 36.54 35.86 86.70 1.19 3.36 0.29 0.81 0.88 2.47
ABW 6.38 6.69 6.82 6.68 82.26 0.27 4.27 0.26 4.11 0.38 6.02
YIE 6137.28 6683.29 6722.57 7243.62 52.65 287.46 4.68 582.47 9.49 308.14 5.02
UHM 29.40 28.84 30.37 29.64 97.64 –0.54 –1.84 0.24 0.81 0.95 3.24
UNIF 83.96 84.93 85.44 85.26 99.64 0.97 1.15 1.30 1.54 1.47 1.75
SFI 6.65 6.78 6.67 6.74 88.26 0.12 1.85 0.08 1.19 0.02 0.24
FS 30.27 31.51 30.42 30.60 95.26 1.18 3.91 0.31 1.04 0.15 0.49
ELON 5.68 5.97 6.05 5.92 95.49 0.28 4.88 0.23 4.11 0.36 6.28
MIC 4.74 5.32 4.38 4.98 97.67 0.56 11.91 0.23 4.94 –0.35 –7.48
RD 76.35 77.77 78.77 77.51 98.68 1.40 1.83 1.15 1.50 2.39 3.13
+b 6.85 6.96 6.51 6.80 91.62 0.10 1.49 –0.04 –0.61 –0.31 –4.59
Total
Gain 295.25 39.59 588.55 30.83 313.67 16.19
PH: plant height (cm); ABW: average boll weight (g); PF: percentage of fibers (%); YIE: seed cotton yield (kg·ha-1); UHM: fiber length (mm); UNIF: fiber uniformity
(%); SFI: short fiber index (%); FS: fiber strength (gf·tex-1); ELON: elongation (%); MIC: micronaire (ug·pol-1); RD: reflectance (%); +b: degree of yellowing (+b).
Table S1. Gains estimates based on the direct and indirect selection of technological traits in seven of the 36 cotton genotypes evaluated.
Selection Response Xs GS % Selection Response Xs GS %
UHM
Direct in UHM 31.82 8.06
ELON
Direct in ELON 6.87 20.05
Indirect in PH 110.84 3.10 Indirect in PH 103.85 –2.15
Indirect in PF 34.57 –2.35 Indirect in PF 38.23 6.57
Indirect in ABW 6.27 –1.16 Indirect in ABW 6.81 5.87
Indirect in YIE 5938.72 –1.70 Indirect in YIE 6189.90 0.45
Indirect in UNIF 85.31 1.60 Indirect in UHM 28.54 –2.84
Indirect in SFI 6.52 –1.75 Indirect in UNIF 84.83 1.04
Indirect in FS 30.68 1.29 Indirect in SFI 6.86 2.86
Indirect in ELON 5.56 –1.97 Indirect in FS 29.50 –2.44
Indirect in MIC 4.29 –9.29 Indirect in MIC 4.71 –0.56
Indirect in RD 77.68 1.72 Indirect in RD 77.97 2.10
Indirect in +b Indirect in +b 6.84 –0.20
Total –6.12 Total 30.75
UNIF
Direct in UNIF 86.12 2.56
MIC
Direct in MIC 3.71 –21.17
Indirect in PH 108.28 1.18 Indirect in PH 99.15 –5.69
Indirect in PF 34.66 –2.13 Indirect in PF 33.96 –3.84
Indirect in ABW 6.50 1.86 Indirect in ABW 5.95 –5.31
Indirect in YIE 6322.85 1.59 Indirect in YIE 5392.08 –6.39
Indirect in UNIF 30.86 4.85 Indirect in UHM 28.16 –4.10
Indirect in SFI 6.30 –4.63 Indirect in UNIF 78.69 –6.25
Indirect in FS 31.74 4.62 Indirect in SFI 6.49 –2.10
Indirect in ELON 5.45 –3.86 Indirect in FS 27.51 –8.67
Indirect in MIC 4.83 1.95 Indirect in ELON 5.68 0.07
Indirect in RD 77.60 1.61 Indirect in RD 72.23 –5.32
Indirect in +b 6.61 –3.16 Indirect in +b 6.59 –3.45
Total 6.44 Total –72.22
Selection Response Xs GS % Selection Response Xs GS %
SFI
Direct in SFI 5.77 –11.64
RD
Direct in RD 79.10 3.55
Indirect in PH 101.44 –3.96 Indirect in PH 108.68 1.48
Indirect in PF 31.62 –9.55 Indirect in PF 36.19 1.60
Indirect in ABW 5.83 –6.88 Indirect in ABW 6.43 0.97
Indirect in YIE 6249.10 0.96 Indirect in YIE 6397.34 2.23
Indirect in UHM 28.86 –1.78 Indirect in UHM 30.84 4.80
Indirect in UNIF 79.68 –5.08 Indirect in UNIF 85.08 1.33
Indirect in FS 30.02 –0.79 Indirect in SFI 6.78 1.76
Indirect in ELON 4.73 –15.95 Indirect in FS 30.43 0.50
Indirect in MIC 4.43 –6.30 Indirect in ELON 5.96 4.71
Indirect in RD 71.46 –6.31 Indirect in MIC 4.33 –8.51
Indirect in +b 6.10 –10.07 Indirect in +b 6.48 –4.91
Total –77.35 Total 9.51
FS
Direct in FS 32.91 8.30
+b
Direct in +b 5.81 –13.89
Indirect in PH 108.47 1.32 Indirect in PH 104.67 –1.54
Indirect in PF 33.80 –4.24 Indirect in PF 32.14 –8.27
Indirect in ABW 6.48 1.52 Indirect in ABW 5.73 –8.09
Indirect in YIE 6549.43 3.54 Indirect in YIE 5605.74 –4.56
Indirect in UHM 30.45 3.49 Indirect in UHM 29.21 –0.62
Indirect in UNIF 85.81 2.19 Indirect in UNIF 79.18 –5.68
Indirect in SFI 6.32 –4.37 Indirect in SFI 5.98 –8.83
Indirect in ELON 5.00 –11.35 Indirect in FS 28.73 –4.84
Indirect in MIC 5.08 7.10 Indirect in ELON 5.13 –9.14
Indirect in RD 76.79 0.57 Indirect in MIC 4.07 –13.81
Indirect in +b 6.81 –0.52 Indirect in RD 72.59 –4.86
Total 7.55 Total –84.13
Xs: mean of selected individuals; UHM: fiber length (mm); UNIF: fiber uniformity (%); SFI: short fiber index (%); FS: fiber strength (gf·ex-1); ELON: elongation (%);
MIC: micronaire (ug·pol-1); RD: reflectance (%); +b: degree of yellowing (+b).
Table S1. Continuation...
CONCLUSION
The Mulamba and Mock (1978) was the index that provided more satisfactory gains, being the most suitable for selecting genotypes aiming at simultaneous gains in yield and fiber technological components of the upland cotton.
ORCID IDs
L. P. Ribeiro
https://orcid.org/0000-0002-8121-0119
L. P. Carvalho
https://orcid.org/0000-0002-8601-5857
F. J. C. Farias
https://orcid.org/0000-0002-7213-0694
J. Rodrigues
https://orcid.org/0000-0003-2703-8079
P. E. Teodoro
https://orcid.org/0000-0002-8236-542X
L. L. Bhering
Araújo, W. P., Pereira, J. R., Almeida, E. S. A. B., Araújo, V. L., Lima, F. V. and Sobrinho, F. P. C. (2013). Componentes da fibra de cultivares de algodoeiro herbáceo sob lâminas de água. Revista Educação
Agrícola Superior, 28, 78-81. https://doi.org/10.12722/0101-756x.
v28n01a13.
Baxevanos, D., Goulasb, C., Rossic, J., and Braojosc, E. (2008). Separation of cotton cultivar testing sites based on representativeness
and discriminating ability using GGE biplots. Crop Science, 100,
1230-1236. https://doi.org/10.2134/agronj2007.0363.
Carvalho, L. P., Baroso, P. A. V., Santos, J. A. T. and Alves, H. S. (2005). Seleção massal e porcentagem de fibra em cultivar de algodoeiro
colorido. Pesquisa Agropecuária Brasileira, 40, 895-898. https://
doi.org/10.1590/s0100-204x2005000900009.
Carvalho, L. P., Farias, F. J. C. and Rodrigues, J. I. S. (2015a). Selection for increased fiber lenhgt in cotton progenies from Acala and
Non-Acala types. Crop Science, 55, 1-7. https://doi.org/10.2135/
cropsci2014.08.0547.
Carvalho, L. P., Farias, F. J. C., Morello, C. L., Rodrigues, J. I. S. and Teodoro, P. E., (2015b). Agronomic and technical fibers traits in elite genotypes of cotton herbaceous. African Journal of Agricultural
Research, 10, 4882-4887. https://doi.org/10.5897/ajar2015.10515.
CONAB. Companhia Nacional de Abastecimento. Acompanhamento de safra brasileira: grãos, safra 2016/2017, 11.º levantamento, agosto/2017. [accessed 2017 Nov. 7 ] http://www.conab.gov.br/ OlalaCMS/uploads/arquivos/17_08_10_09_00_19_boletim_ graos_agosto_2017-.pdf.
Cruz, C. D. (2013). GENES - a software package for analysis in experimental statistics and quantitative genetics. Acta Scientiarum
Agronomy, 35, 271-276. https://doi.org/10.4025/actasciagron.
v35i3.21251.
Cruz, C. D., Carneiro, P. C. S. and Regazzi, A. J. (2012). Modelos
biométricos aplicados ao melhoramento genético. 3rd ed. Viçosa:
Editora UFV.
Culp, T. W. and Green, C.C. (1992). Performance of obsolete and current cultivars and Pee Dee germplasm lines of
cotton. Crop Science, 32, 35-41. https://doi.org/10.2135/
cropsci1992.0011183x003200010008x.
Falconer, D. S. and Mackay, T. F. C. (1996). Introduction to Quantitative
Genetics. 4th ed. Longmans Green: Harlow, Essex.
REFERENCES
Farias, F. J. C., Carvalho, L. P., Silva Filho, J. L. and Teodoro, P. E. (2016). Correlations and path analysis among agronomic and technological traits of upland cotton. Genetics and Molecular
Research, 15, gmr.15038239. https://doi.org/10.4238/gmr.15038239.
Freitas, R. J., Leandro, W. M. and Carvalho, M. C. S. (2007). Efeito da adubação potássica via solo e foliar sobre a produção e a qualidade da fibra em algodoeiro (Gossypium hirsutum L.). Pesquisa Agropecuária Tropical, 37, 106-112.
Hazel, L. N. (1978). The genetic basis for constructing selection indexes. Genetics, 28, 476-490.
Hoogerheide, E. S. S., Vencovsky, R., Farias, F. J. C., Freire, E. C. and Arantes, E. M. (2007). Correlações e análise de trilha de caracteres tecnológicos e produtividade de fibra de algodão. Pesquisa
Agropecuária Brasileira, 42, 1401-1405. https://doi.org/10.1590/
s0100-204x2007001000005.
Jerônimo, J. F., Almeida, F. A. C., Silva, O. R. F. F., Brandão, Z. N., Sofiatti, V. and Gomes, J. P. (2014). Qualidade da semente e fibra de algodão na caracterização do descaroçador de 25 serras. Revista
Brasileira de Engenharia Agrícola e Ambiental, 18, 664-671. https://
doi.org/10.1590/s1415-43662014000600015.
Lin, Z., He, D., Zhang, X., Nie, Y., Guo, X., Feng, C. and Stewart, J. McD. (2005) Linkage map construction and mapping QTL for cotton fibre quality using SRAP, SSR and RAPD. Plant Breeding,
124, 180-187. https://doi.org/10.1111/j.1439-0523.2004.01039.x.
Martins, I. S., Silva, I. M., Camargo, J. M., Melo, L. F., Vieira Junior, H. C. and Santos, A. S. (2012). Avaliação de características da fibra de genótipos de algodoeiro cultivados em sistemas
ultra-adensado, adensado e convencional. Nucleus, 9, 17-23. https://
doi.org/10.3738/1982.2278.653.
Mulamba, N. N. and Mock, J. J. (1978). Improvement of yield potential of the Eto Blanco maize (Zea mays L.) population by breeding for plant traits. Egypt Journal of Genetics and Cytology, 7, 40-51.
Ng, E. H, Smith, C. W., Hequet, E., Hague, S. and Dever, J. (2015). Generation mean analysis for fiber elongation in upland
cotton. Crop Science, 54, 1347-1353. https://doi.org/10.2135/
cropsci2013.07.0490.
Pimentel-Gomes, F. (2009). Curso de Estatística Experimental. 15 ed. Piracicaba: ESALQ.
Resende, M. A. V., Freitas, J. A., Lanza, M. A., Resende, M. D. V. and Azevedo, C. F. (2014). Divergência genética e índice de seleção via
BLUP em acessos de algodoeiro para características tecnológicas
da fibra. Pesquisa Agropecuária Tropical, 44, 334-340. https://doi.
org/10.1590/s1983-40632014000300006.
Santos, F. S., Amaral Júnior, A. T., Freitas Junior, S. P., Rangel, R.
M. and Pereira, M. G. (2007). Predição de ganhos genéticos por índices de seleção na população de milho-pipoca unb-2u sob
seleção recorrente. Bragantia, 66, 389-396. https://doi.org/10.1590/
s0006-87052007000300004.
Shen, X., Guo, W., Lu, Q., Zuo, X., Yuan, W. and Zhang, T. (2006).
Genetic mapping of quantitative trait loci for fiber quality and yield
trait by RIL approach in Upland cotton. Euphytica, 155, 371-380.
https://doi.org/10.1007/s10681-006-9338-6.
Smith, C. W., Hague, S, Hequet, E., Thaxton, S. and Brown, N. (2008).
Development of extra-long staple upland cotton. Crop Science, 48,
1823-1831. https://doi.org/10.2135/cropsci2008.01.0052.
Smith, H. F. (1936). A discriminant function for plant selection. Annals
of Eugenics, 7, 240-250. https://doi.org/10.1111/j.1469-1809.1936.
tb02143.x.
Ulloa, M. (2006). Heritability and correlations of agronomic and
fiber traits in an okra-leaf upland cotton population. Crop Science,
46, 1508-1514. https://doi.org/10.2135/cropsci2005.08-0271.
Wells, R. and Meredith Junior, W.R. (1984). Comparative growth
of obsolete and modern cotton cultivars: III. Relationship of yield
to observed growth characteristics. Crop Science, 24, 868-872.
https://doi.org/10.2135/cropsci1984.0011183x002400050010x.
Williams, J. S. (1962). The evaluation of a selection index. Biometrics,