ABSTRACT: Estimating stability and adaptability parameters of cultivars is a widely used study to access the genotype × environment interaction, in order to identify the best genotypes for each cultivation area. In this study, the adaptability and stability parameters were estimated in eight high-oleic lines and two peanut cultivars in 11 experiments in the State of São Paulo, Brazil, from 2008 to 2013, based on the data of the plots mean productivity (Kg.ha–1), with the objective of recommending the most productive genotypes in peanut producing regions in the State of São Paulo. The design used for these experiments was the randomized complete blocks, with four replications. Lines L. 599 and L. 551 were the best genotypes
PLANT BREEDING -
Article
Productivity, adaptability and stability of
high-oleic peanut lines in the State of São Paulo
João Francisco dos Santos1*, Ignácio José de Godoy1, Andrea Rocha Almeida de Moraes1,
Marcos Doniseti Michelotto2, Rogério Soares de Freitas3, Denizart Bolonhezi4,
José Carlos Cavichioli5, Antônio Lúcio Mello Martins2
1.Instituto Agronômico - Centro de Grãos e Fibras - Campinas (SP), Brazil.
2.Agência Paulista de Tecnologia dos Agronegócios - Polo Regional de Desenvolvimento dos Agronegócios do Centro Norte - Pindorama (SP), Brazil. 3.Instituto Agronômico - Centro de Seringueira e Sistemas Agroflorestais - Votuporanga (SP), Brazil.
4.Agência Paulista de Tecnologia dos Agronegócios - Polo Regional Centro Leste - Ribeirão Preto (SP), Brazil. 5.Agência Paulista de Tecnologia dos Agronegócios - Polo Regional Alta Paulista - Adamantina (SP), Brazil.
*Corresponding author: [email protected]
Received: May 7, 2017 – Accepted: Sept. 18, 2017
regarding overall adaptability and stability in yield, considering the methods of Eberhart and Russell and of Lin and Binns modified by Carneiro. Results produced by both methods were convergent as for the classification of the lines, and the use of one of them would not be detrimental to the recommendation of productive lines associated to production adaptability and stability. The overall adaptability in addition to the stability in the productivity of the lines here evaluated showed outstanding performance in relation to the cultivars IAC Caiapó and Runner IAC 886.
INTRODUCTION
The productivity of peanut (Arachis hypogaea L.) crop in São Paulo, the main producer State in Brazil, has increased significantly within the last 15 years due to the introduction of runner cultivars with high productive potential (Martins 2013). However, the expression of the productive potential is highly influenced by the environment, and depends on the genetic and environmental components and on the interaction between them (Santos et al. 2013). Consequently, it is necessary to perform an extensive evaluation in order to identify genotypes that are superior in productivity and production stability in a given range of environments considering the limiting effects of climate, soil, pests and diseases, etc.
The adaptability and stability analyses are statistical procedures that allow identifying more stable behavior of the genotypes and which one responds predictably to environmental variations, often being used by breeders for cultivar recommendation (Silva and Duarte 2006). The stability in the production of a crop is an important attribute, once it defines the good productive performance of the cultivar in various environments.
The breeding program of the Agronomic Institute (Instituto Agronômico – IAC) released the IAC Caiapó cultivar, a cultivar of runner growing habit whose main characteristic is its partial and multiple resistance to foliar diseases, especially late leaf spot and rust (Godoy et al. 1999; 2005). The productivity of this cultivar, with or without disease control, was evaluated and compared to the Florunner cultivar, susceptible, in several experiments in the State of São Paulo, Brazil. Its productive stability and resistance were evidenced by its better performance in environments where the pressure by diseases was higher (Godoy et al. 1999). Because of its stability characteristic, this cultivar started being used as the genitor of many crossings in order to obtain productive lines of greater stability.
Oliveira et al. (2006), in several experiments conducted with control of foliar disease, evaluated productive stability and productivity of a series of breeding lines descended from a cross between the IAC Caiapó and the Runner IAC 886 cultivars (the later, a population derived from cv. Florunner). The authors observed that several lines showed stable and predictable behavior, overcoming cultivar Runner IAC 886, and proving to have inherited these characteristics of the resistant cultivar.
Recently, the peanut market started demanding cultivars carrying the high-oleic trait. This characteristic (recessive
and transmitted by oligogenes) refers to the lipid portion of the peanut with 80% oleic acid, against 40% to 50% oleic acid in regular peanuts. The higher content of oleic acid grants the product greater resistance to oxidation, resulting in greater peanut durability in storage (Holbrook and Stalker 2003).
Due to this demand for high-oleic peanut, the breeding program of the Agronomic Institute (IAC) has prioritized the production of cultivars with this characteristic (Godoy et al. 2014). Among the program objectives is the obtaining of high-oleic cultivars that associate high productivity. In this case, the IAC Caiapó cultivar, of regular oleic acid content, has also been used as a donor of these characteristics associated to adaptability and stability.
Thus, this study had the objective of evaluating the productive potential, the adaptability and production stability of eight high-oleic breeding lines descendants from the IAC Caiapó cultivar in peanut producing regions in the State of São Paulo, Brazil, using the methods of Eberhart and Russell (1966) and of Lin and Binns (1988) modified by Carneiro (1998)6.
MATERIAL AND METHODS
Eight lines of outstanding agronomic performance and moderate resistance to leaf spots were selected from the cross between the high-oleic accession 2562 and the advanced line L65/3-1, component of cultivar IAC Caiapó, which stands out due to its production stability and moderate and multiple resistance to leaf spots.
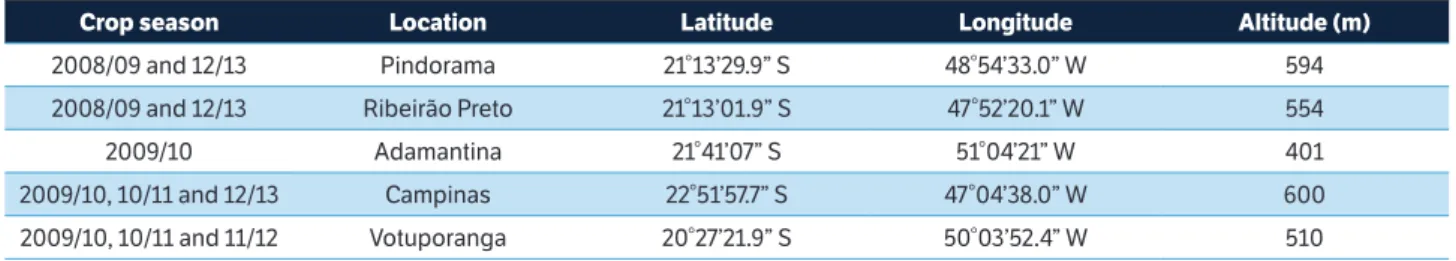
Eleven field trials were conducted in the spring/summer growing season in various locations in the State of São Paulo, Brazil (Table 1).
Each field trial was carried out in a randomized complete blocks design, with four replications, with plots containing four rows of 3 m length and 0.9 m between rows, considering both lateral rows as borders. Cultivars IAC Caiapó and Runner IAC 886 were used as controls. In all experiments, the area had the soil pH corrected with limestone, and fertilized with
250 kg.ha–1of NPK 4-14-8. The phytosanitary procedures
were applied according to technical recommendations for peanut cropping (Godoy et al. 2005).
6Carneiro, P. C. S. (1998). Novas metodologias de análise da adaptabilidade
Harvesting was made between 130 and 135 days after sowing, the plants were dug and left sun drying in the field. After drying, the pods were manually detached from the plants and packed in polypropylene bags. The production of each plot was weighed and the yield of each genotype was estimated, in Kg.ha–1 of unshelled peanuts.
The joint analysis of variance and test F were performed in order to test the effects of genotypes (G), environments (E) and G × E interaction for yield variable. Treatment means were compared by the Scott-Knott test (α = 0.05).
The study of adaptability and stability of genotypes (lines and cultivars) used the methods of Eberhart and Russell (1966) and the method of Lin and Binns (1988) modified by Carneiro (1998). Eberhart and Russell (1966) method has been used in this study as a classical method for estimating stability. Lin and Binns (1988) modified by Carneiro (1998) was also used due to its simplicity of utilization and identification of the stable and adapted genotypes.
In the method of Eberhart and Russell (1966) the parameters that express stability and adaptability are mean, linear response, environmental variation and regression deviation for each genotype, obtained by the model (Eq. 1):
Yij = μ + β1ilj+ δij + εij (1)
where: Yij is the mean of genotype i in the environment j; µ is the
overall mean of genotype i, β1i is the linear response of genotype i to the environmental variation j; Ij is the environmental index
of environment j; δij is the regression deviation of genotype i
in environment j; and εijis the mean experimental error. The
stability can also be evaluated based on the linear determination coefficient(R2
i)of the regression model (Eq. 2):
R2
i = [(SQRegression)i/SQ(E/Gi)] × 100 (2)
where: SQRegressioni is the square sum of the linear
regression of genotype i; and SQ(E / Gi) is the square sum
of environments within the genotype i. To evaluate the null
(βi = 1) versus the alternative (βi ≠ 1) hypothesis, t test was
applied (α = 0.05).
The coefficients of regression of each genotype in relation to the environmental index and the regression deviations allowed the estimates of adaptability (βi) and stability (δij) parameters.
In order to recommend the genotype, productivity, regression coefficient and regression deviation were taken into account. According to Eberhart and Russell (1966), the ideal cultivar is the one with high productivity, regression coefficient equal to one and non-significant regression deviation.
In the method by Lin and Binns (1988) modified by Carneiro (1998), the estimate for Pi parameter for favorable
environments is obtained based on Eq. 3:
Pif = ∑ 1
f (Xij – Mj)
2/2f (3)
where: Pif is the BASM parameter (behavioral adaptability and
stability measure) for a favorable environment; Xij is the unshelled
grain yield in the i – th genotype and j – th site; Mj is the maximum
response observed among all genotypes in sites j; and f is the number of favorable environments. The BASM parameter for unfavorable environments is estimated based on Eq. 4:
Piu = ∑ 1
f (Xij – Mj)
2/2u (4)
where u is the number of unfavorable environments. In the original method of Lin and Binns (1988), the stable genotype is the one with the lowest Pi index.
All statistical analyses were performed using the GENES computer program (Cruz 2013).
RESULTS AND DISCUSSION
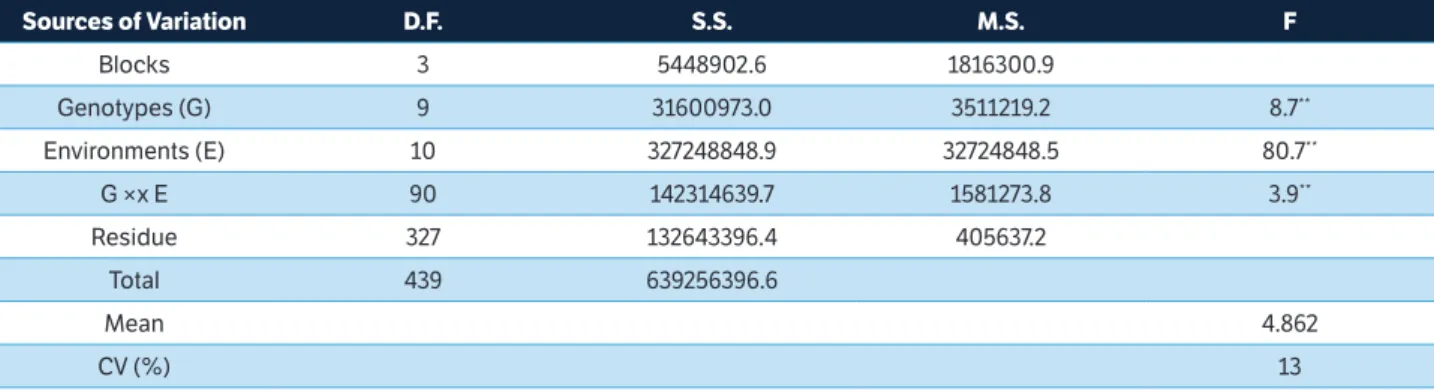
According to the results of the combined analysis of variance and F test for productivity of the eight lines and two peanut controls, for all trials, it is observed that the effects of the (G × E) interaction were highly significant,
Crop season Location Latitude Longitude Altitude (m)
2008/09 and 12/13 Pindorama 21°13’29.9” S 48°54’33.0” W 594
2008/09 and 12/13 Ribeirão Preto 21°13’01.9” S 47°52’20.1” W 554
2009/10 Adamantina 21°41’07” S 51°04’21” W 401
2009/10, 10/11 and 12/13 Campinas 22°51’57.7” S 47°04’38.0” W 600
2009/10, 10/11 and 11/12 Votuporanga 20°27’21.9” S 50°03’52.4” W 510
indicating that genotypes performed differently according to the environment where they were evaluated (Table 2). It was also verified that the isolated genotype and environment sources of variation presented significant effects (p ≤ 0.01) according to the F test (Table 2), indicating that at least one genotype differs significantly of the others, and that at least one environment is significantly different in relation to the other environments. The overall productivity mean of the trials along the five years of evaluation was 4862 Kg.ha–1, showing lines as productive as the most recently released cultivars, IAC OL 3 and IAC OL 4 (Godoy et al. 2014).
The productivity means of the lines were evaluated according to the favorable environment classification by Eberhart and Russell (1966) method (Table 3). Significant
statistical differences were observed for productivity
(Kg.ha–1) among the genotypes evaluated by the
Scott-Knott test only in the locations of Adamantina in the 2009/2010 growing season, Pindorama 2008/2009, and Votuporanga 2010/2011. In Adamantina 2009/2010, only lines L. 506 and L. 507 were significantly less productive than the IAC Caiapó resistant control. In Pindorama 2008/2009, lines L. 506 and L. 551 were as productive as the IAC Caiapó control (p > 0.05); and in Votuporanga 2010/2011, lines L. 501, L. 506, L. 551 and L. 599 showed higher productivity than the resistant control (Table 3). In these locations, the mean for the control Runner IAC 886 was always lower than the ones for the control IAC Caiapó.
Sources of Variation D.F. S.S. M.S. F
Blocks 3 5448902.6 1816300.9
Genotypes (G) 9 31600973.0 3511219.2 8.7**
Environments (E) 10 327248848.9 32724848.5 80.7**
G ×x E 90 142314639.7 1581273.8 3.9**
Residue 327 132643396.4 405637.2
Total 439 639256396.6
Mean 4.862
CV (%) 13
Table 2. Combined analysis of variance and F test for productivity of unshelled peanuts (Kg.ha–1) of ten genotypes evaluated in 11 environments
(combinations among five locations in the State of São Paulo in growing seasons from 2008/2009 to 2012/2013).
Genotypes
Adamantina Pindorama Votuporanga Votuporanga Votuporanga 2009/10 2008/09 2009/10 2010/11 2011/12
Means (Kg∙ha–1)(1)
L. 501 5588 a 5872 b 5886 5987 b 5592
L. 504 5159 a 5175 c 5509 5613 c 6062
L. 506 3842 b 6532 a 6801 5984 b 6931
L. 507 4407 b 5592 b 6226 5492 c 6236
L. 516 6891 a 4953 c 4803 5057 c 5976
L. 551 5717 a 6370 a 6224 6420 a 6687
L. 573 5919 a 4915 c 5194 5462 c 5590
L. 599 6576 a 6103 b 5680 6782 a 7083
Runner IAC 886 2861 c 3236 d 5833 4139 d 6569
IAC Caiapó 5983 a 6805 a 4898 5407 c 6382
F test 9.9** 24.7** 2.5ns 14.3** 1.2ns
CV (%) 15.0 7.5 13.6 6.8 14.9
(1)Means followed by the same letter in the column do not differ from each other by the Scott-Knott test (α = 0.05). ns, ** non significant (p > 0.05) and significant
(p ≤ 0.01), respectively, according to the F test.
Table 3. Mean productivity of unshelled peanuts (Kg ha–1) of eight lines and two controls in favorable environments, by definition of Eberhart
and Russell (1966).
In Votuporanga 2009/2010 and 2011/2012, there was no significant difference between means of productivity (Table 3). The coefficients of variation of the locations ranged from 6.8% to 14.9%, thus indicating a good control of the causes of variation of systematic order in these trials (Table 3). Differences in behavior of the genotypes between locations and/or years were attributed to environmental differences between them. The lower productivities observed in Campinas in 2009/2010, 2010/2011 and 2012/2013, as compared to other locations, might be attributed to the lower amount of rain during the flowering period in these experiments. In Ribeirão Preto 2008/2009, and Ribeirão Preto and Pindorama in 2012/2013, the higher disease pressure of foliar diseases (late leaf spot) may have been the cause for yield reduction in these experiments.
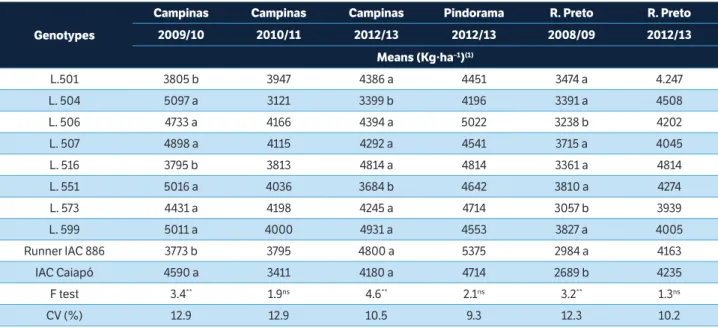
Table 4 shows the productive performance of peanut lines in unfavorable locations according to the definition of unfavorable environment by Eberhart and Russell (1966) method. It was verified that in Campinas 2009/2010, only lines L. 501 and L. 516 were lower yielding than the cv. IAC Caiapó (Table 4). In Campinas 2012/2013, lines L. 504 and L. 551 showed lower yield performance than IAC Caiapó. In Ribeirão Preto 2008/2009, six lines have proved to be significantly superior in productivity in relation to that cultivar. For the remaining environments (e.g. Campinas 2010/2011, Pindorama 2012/2013 and Ribeirão Preto
2012/2013), there was no significant means difference for productivity among the genotypes evaluated (Table 4). The coefficients of variation in the studied locations ranged from 9.3% to 12.9%, indicating good control of the variation causes of systematic order of the trials (Table 4).
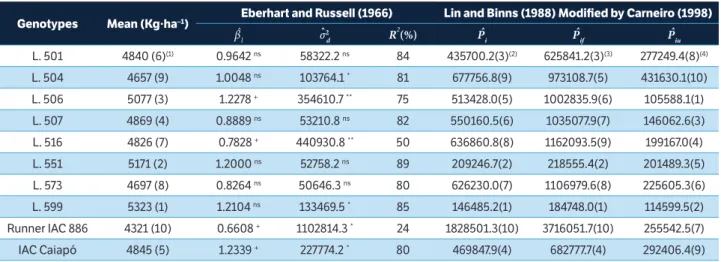
In the adaptability and stability study for the set of environments, only the lines with unshelled grain yield means estimates equal or higher than the overall mean
estimate (4862 Kg.ha–1), in terms of absolute values,
were considered. Of the eight lines evaluated, only four were considered more productive and stable: line L. 599, the most productive in the overall classification of the lines, producing 5323 Kg.ha–1; line L. 551, with mean of 5171 Kg.ha–1; line L. 506, with a mean of 5077 Kg.ha–1
and L. 507, with a mean of 4869 Kg.ha–1 (Table 5).
The commercial cultivars IAC Caiapó and Runner IAC 886 were ranked, respectively, in the fifth (4845 Kg.ha–1) and in the 10th (4321 Kg.ha–1) positions in terms of productivity averages.
The coefficient of regression estimates for lines L. 599, L. 551 and L. 507 did not differ significantly from 1 (Table 5), therefore, these lines should be recommended for favorable and unfavorable environments, and the coefficients of determination (R2) estimates associated to them were higher than 80%, indicating their general adaptability and stability of production in the set of evaluated environments.
(1)Means followed by the same letter in the column do not differ from each other by the Scott-Knott test (α = 0.05). **non significant (p > 0.05) and significant (p
≤ 0.01), respectively, according to the F test.
Table 4. Mean productivity of unshelled peanuts (Kg.ha–1) of eight lines and two controls in unfavorable environments, by definition of
Eberhart and Russell (1966).
Genotypes
Campinas Campinas Campinas Pindorama R. Preto R. Preto 2009/10 2010/11 2012/13 2012/13 2008/09 2012/13
Means (Kg∙ha–1)(1)
L.501 3805 b 3947 4386 a 4451 3474 a 4.247
L. 504 5097 a 3121 3399 b 4196 3391 a 4508
L. 506 4733 a 4166 4394 a 5022 3238 b 4202
L. 507 4898 a 4115 4292 a 4541 3715 a 4045
L. 516 3795 b 3813 4814 a 4814 3361 a 4814
L. 551 5016 a 4036 3684 b 4642 3810 a 4274
L. 573 4431 a 4198 4245 a 4714 3057 b 3939
L. 599 5011 a 4000 4931 a 4553 3827 a 4005
Runner IAC 886 3773 b 3795 4800 a 5375 2984 a 4163
IAC Caiapó 4590 a 3411 4180 a 4714 2689 b 4235
F test 3.4** 1.9ns 4.6** 2.1ns 3.2** 1.3ns
The high value of the coefficient of determination in the linear model for each line indicates that the model was efficient in explaining the variations observed in productivity data. The linear model was not efficient only in the case of two of the genotypes evaluated (e.g. Runner IAC 886 and L. 506), which presented low productivity, and therefore are not recommended (Table 5).
It was observed that line L. 506, one of which achieved best overall performance in productivity, had a regression coefficient higher than 1, and therefore was considered as adaptable in favorable environments, but its coefficient of determination estimate (lower than 80%) indicated that this line has low predictability and stability of production. Thus, across the environments evaluated here, the predictability of behavior of L. 506 was low.
Based on the results of the modified method of Lin and Binns (1988), it was observed that line L. 599 has the lowest overall value estimate, i.e., this line has high adaptability and stability of production in favorable and unfavorable environments (Table 5). Line L. 551 presented the second best overall value, the second best for favorable environments and the fifth among unfavorable environments (Table 5).
In unfavorable environments, it was verified that line L. 506 had the lowest Pi value estimate, and was classified as the third overall most productive line, indicating that this line holds high adaptability and stability in this environment (Table 5).
When comparing the studies between the lines evaluated and the method to evaluate adaptability and stability in production, it was verified that the method of Lin and Binns (1988) highlighted line L. 506 as apt for unfavorable environments, and that this same line was considered inapt to cultivation in favorable environments by the method of Eberhart and Russell (1966) (significant regression deviation and low value) (Table 5). Line L. 507 was classified as of overall adaptability in the method of Eberhart and Russell (1966) and, in the method of Lin and Binns (1988), their value indicates that their stability is higher in unfavorable environments. Thus, in this work, in cases where the regression model was not explanatory, Lin and Binns (1988) modified by Carneiro (1998) was more informative in relation to adaptability and stability of the most productive lines.
According to the method of Eberhart and Russell (1966), the IAC Caiapó cultivar was characterized as of good yield adaptability and stability in favorable environments, with the same classification for the method of Lin and Binns (1988), losing only to the most productive lines. This is in disagreement with Godoy et al. (1999), who has observed that the IAC Caiapó cultivar is a stable variety in different production environments, and with Oliveira et al. (2006), who also concluded that the IAC Caiapó has overall adaptability and stability of production.
It is observed that cultivar Runner IAC 886 presented low productivity, not being possible to recommend it
Genotypes Mean (Kg∙ha–1) Eberhart and Russell (1966) Lin and Binns (1988) Modified by Carneiro (1998)
β ˆl σ ˆ2
d R
2
(%) P ˆi P ˆif P ˆiu
L. 501 4840 (6)(1) 0.9642 ns 58322.2 ns 84 435700.2(3)(2) 625841.2(3)(3) 277249.4(8)(4)
L. 504 4657 (9) 1.0048 ns 103764.1 * 81 677756.8(9) 973108.7(5) 431630.1(10)
L. 506 5077 (3) 1.2278 + 354610.7 ** 75 513428.0(5) 1002835.9(6) 105588.1(1)
L. 507 4869 (4) 0.8889 ns 53210.8 ns 82 550160.5(6) 1035077.9(7) 146062.6(3)
L. 516 4826 (7) 0.7828 + 440930.8 ** 50 636860.8(8) 1162093.5(9) 199167.0(4)
L. 551 5171 (2) 1.2000 ns 52758.2 ns 89 209246.7(2) 218555.4(2) 201489.3(5)
L. 573 4697 (8) 0.8264 ns 50646.3 ns 80 626230.0(7) 1106979.6(8) 225605.3(6)
L. 599 5323 (1) 1.2104 ns 133469.5 * 85 146485.2(1) 184748.0(1) 114599.5(2)
Runner IAC 886 4321 (10) 0.6608 + 1102814.3 * 24 1828501.3(10) 3716051.7(10) 255542.5(7)
IAC Caiapó 4845 (5) 1.2339 + 227774.2 * 80 469847.9(4) 682777.7(4) 292406.4(9)
Table 5. Adaptability and stability parameters estimates for mean productivity of unshelled peanuts (Kg.ha–1) of eight lines and two controls,
using the methods of Eberhart and Russell (1966) and of Lin and Binns (1988), modified by Carneiro (1998).
(1)Genotypes ranked by productivity; ns, + non significant (p > 0.05) and significant (p ≤ 0.05), respectively, according to the t test; *, ** significant (p ≤ 0.05)
and (p ≤ 0.01), respectively, according to F test; (2) genotypes ranked by P
i, estimated value for broad adaptability and stability;
(3) genotypes ranked by P if,
esti-mated values for adaptability and stability parameters for favorable environments; (4) genotypes ranked by P
iu, estimated values for adaptability and stability
based on the models of adaptability and stability. It was observed, in the method of Eberhart and Russell (1966), that the linear regression did not explain the variation in productivity observed in the trials, and that the coefficient of determination R2estimated for this cultivar was 24%,
while the minimum to ensure the precision of the linear model was 80% (Table 5). In the method of Lin and Binns (1988) modified by Carneiro (1998), there were also high Pi estimated values verified in both favorable and unfavorable environments for this cultivar, in agreement with Oliveira et al. (2006), who verified, for cultivar Runner IAC 886, productivity below the overall mean and low production stability in the study of adaptability and stability based on the methods of Lin and Binns and of ecovalence. Godoy et al. (1999) concluded that cultivar Runner IAC 886 had low performance when the chemical control of foliar diseases is not complete, since this cultivar is susceptible to cercosporioses. Thus, the adaptability of cultivar Runner IAC 886 was not as good as the lines, as indicated by their low relative adaptability in the trials.
The lines evaluated by Oliveira et al. (2006) were obtained from crosses involving cultivars Runner IAC 886 and IAC Caiapó, and did not present the high-oleic characteristic. The lines presented in this work were also derived from the cv. IAC Caiapó, but have the high-oleic trait. Based on the results achieved in these studies, it is possible to infer that genotypes descending from the cultivar IAC Caiapó have allowed gains in productivity, adaptability and stability of production.
CONCLUSION
Lines L. 599 and L. 551 are the best ones regarding their productivity and overall yield adaptability and stability, considering the method of Eberhart and Russell (1966) and of Lin and Binns (1988) modified by Carneiro (1998). Genotypes descending from the cultivar IAC Caiapó have allowed gains in productivity, adaptability and stability of production.
ORCID IDs
J. F. Santos
https://orcid.org/0000-0001-9481-4547
I. J. Godoy
https://orcid.org/0000-0002-2728-6104
A. R. A. Moraes
https://orcid.org/0000-0001-9262-0159
M. D. Michelotto
https://orcid.org/0000-0002-2381-2090
R. S. Freitas
https://orcid.org/0000-0003-2720-5244
D. Bolonhezi
https://orcid.org/0000-0003-3084-8427
J. C. Cavichioli
https://orcid.org/0000-0003-4432-3648
A. L. M. Martins
https://orcid.org/0000-0002-4378-9414
Cruz, C. D. (2013). GENES – A software package for analysis in
experimental statistics and quantitative genetics. Acta Scientiarum.
Agronomy, 35, 271-276. http://dx.doi.org/10.4025/actasciagron.
v35i3.21251.
Eberhart, S. A. and Russell, W. A. (1966). Stability parameters for
comparing varieties. Crop Science, 6, 36-40. http://doi.org/10.2135/
cropsci1966.0011183X000600010011x.
Godoy, I. J., Moraes, S. A., Siqueira, W. J., Pereira, J. C. V. N. A.,
Martins, A. L. M. and Paulo, E. M. (1999). Produtividade, estabilidade
e adaptabilidade de cultivares de amendoim em três níveis de
controle de doenças foliares. Pesquisa Agropecuária Brasileira, 34,
1183-1191. http://dx.doi.org/10.1590/S0100-204X1999000700010.
REFERENCES
Godoy, I. J., Moraes, S. A., Zanotto, M. D. and Santos, R. C. (2005).
Melhoramento do amendoim. In Borém A. (Ed.), Melhoramento
de espécies cultivadas. 2. ed. (p. 51-94). Viçosa: Editora da UFV.
Godoy, I. J., Santos, J. F., Carvalho, C. R. L., Michelotto, M.
D., Bolonhezi, D., Freitas, R. S., Kasai, F. S., Ticelli, M., Finoto,
E. L. and Martins, A. L. M. (2014). IAC OL 3 and IAC OL 4:
new Brazilian peanut cultivars with the high-oleic trait. Crop
Breeding and Applied Biotechnology, 14, 200-203. http://dx.doi.
org/10.1590/1984-70332014v14n3a30.
Holbrook, C. C. and Stalker, H. T. (2003). Peanut breeding and
genetic resources. In Janick, J. (Ed.), Plant Breeding Reviews, 22
Lin, C. S. and Binns, M. R. (1988). A superiority measure of cultivar
performance for cultivar × location data. Canadian Journal of
Plant Science, 68, 193-198. https://doi.org/10.4141/cjps88-018.
Martins, R. (2013). Amendoim: o mercado brasileiro no período
de 2000 a 2011. In: Santos, R. C., Freire, R. M. M. and Lima, L. M.
(Eds.), O agronegócio do amendoim no Brasil. 2. ed. (p. 19-44).
Brasília: EMBRAPA.
Oliveira, E. J., Godoy, I. J., Moraes, A. R. A., Martins, A. L. M., Pereira,
J. C. V. N. A., Bortoletto, N. and Kasai, F. S. (2006). Adaptabilidade
e estabilidade de genótipos de amendoim de porte rasteiro.
Pesquisa Agropecuária Brasileira, 41, 1253-1260.
Santos, R. C., Godoy, I. J. and Fávero, A. P. (2013). Melhoramento
do amendoim e cultivares comerciais. In Santos, R. C., Freire, R.
M. M. and Lima, L. M. (Eds.), O agronegócio do amendoim no
Brasil. 2. ed. (p. 115-184). Brasília: EMBRAPA.
Silva, W. C. J. and Duarte, J. B. (2006). Métodos estatísticos
para estudo de adaptabilidade e estabilidade fenotípica em
soja. Pesquisa Agropecuária Brasileira, 41, 23-30. http://dx.doi.