Munich Personal RePEc Archive
An approach to the structural features of
the socio-economic activity of a country
based on a Social Accounting Matrix.
Evidences and multiplier effects on
distribution of income.
Susana Santos
ISEG - Lisbon School of Economics and Management, Universidade
de Lisboa, UECE (Research Unit on Complexity and Economics)
and DE (Department of Economics)
June 2017
Online at
https://mpra.ub.uni-muenchen.de/79742/
An approach to the structural features of the socio-economic activity of a
country based on a Social Accounting Matrix.
Evidences and multiplier effects on distribution of income.
SUSANA SANTOS*
ISEG - Lisbon School of Economics and Management, Universidade de Lisboa UECE (Research Unit on Complexity and Economics) and DE (Department of Economics)
(June 2017)
The financial support from national funds by FCT (Fundação para a Ciência e a Tecnologia) is gratefully
acknowledged. This paper is part of the Strategic Project UID/ECO/00436/2013.
An approach to the structural features of the socio-economic activity of a country based on a Social Accounting Matrix. Evidences and multiplier effects on distribution of income. SSantos
Abstract
A Social Accounting Matrix (SAM) is presented as a tool to study the socio-economic activity of a country. This activity involves the monetary or nominal flows that are measured by the National Accounts, as well as production (organized in factors, industries and goods and services) and institutions (organized in households, general government, non-financial and financial corporations, non-profit institutions serving households, and rest of the world).
In order to contribute to the definition of a methodology that can contribute to improving the knowledge of the different aspects of this activity, the potentialities of a SAM for its reading and interpreting are explored, as well as for carrying out experiments regarding its functioning.
Through a SAM-based approach, how to construct more or less complex networks of linkages of the above-mentioned flows is shown, from which structural features can be evidenced and the associated multiplier effects studied.
Following an application to Portugal, it is shown that a numerical version of a SAM, enables an empirical description of the origin, use, and distribution of income, whereas, an algebraic version of a SAM allows one to carry out, for example, a deeper study of the multiplier effects associated with the institutional distribution of income. The crucial role of the factors of production accounts is identified in this study, namely when they establish the link between the generation and the distribution and use of income. In this process, the important role the complementary details that the Input-Output Matrix (IOM) can add is also identified. Thus, being the generation of income the result of the output of goods and services and the associated costs, on the one hand, an industry by industry IOM can add details regarding domestic and imported intermediate consumption by and between industries and, on the other hand, a product by product IOM can add details regarding the domestic and imported intermediate consumption of goods and services.
Keywords: Social Accounting Matrix; National Accounts; SAM-based approach; socio-economic
structure; Input-Output Matrix; Income Distribution.
Abbreviations
ESA – European System of National and Regional Accounts in the European Community
CPC – Central Product Classification
DI – Disposable Income
GAV – Gross Added Value
GDP – Gross Domestic Product at market prices
GNI – Gross National Income
IEA – Integrated Economic Accounts
IO – Input-Output
IOM – Input-Output Matrix
ISIC – International Standard Industrial Classification of All Economic Activities ISWGNA – Inter-Secretariat Working Group on National Accounts
NACE – Nomenclature Statistique des Activités Économiques dans la Communauté Européenne
(Statistical Classification of Economic Activities in the European Community)
NB – Net Borrowing
NL – Net Lending
NPISH – Non-Profit Institutions Serving Households
S – Gross Savings
SAM – Social Accounting Matrix
An approach to the structural features of the socio-economic activity of a country based on a Social Accounting Matrix. Evidences and multiplier effects on distribution of income. SSantos
CONTENTS
1. Introduction ... 1
2. A SAM base form ... 2
2.1. Schematic representation ... 3
2.2. Application ... 6
2.3. Macroeconomic aggregates and types of income ... 9
3. SAM accounts - disaggregation, extension and complements ... 11
3.1. Production accounts and the IOMs ... 12
3.2. Domestic institutions and rest of the world accounts ... 14
4. Evidences on the structural features of the socio-economic activity of a country ... 20
5. Multiplier effects associated with the institutional distribution of income ... 39
5.1. Methodology ... 39
5.2. Analysis ... 43
6. Summary and concluding remarks ... 52
References ... 56
Appendices ... 59
A.1. Integrated Economic Accounts Table of Portugal in 2013 ... 60
A.2. Supply Table of Portugal in 2013 – level of disaggregation 1 ... 62
A.3. Use Table of Portugal in 2013 – level of disaggregation 1 ... 63
A.4. Accounting multipliers for Portugal in 2013 - level of disaggregation 1 ... 64
A.4.1. SAM by endogenous and exogenous accounts ... 64
A.4.2. Average expenditure propensities matrices ... 66
A.4.3. Accounting multipliers matrix ... 67
A.4.4. Additional intragroup or direct effects matrix (M1 - I) ... 67
A.4.5. Additional intergroup or indirect effects matrix (M2 - I). M1 ... 67
List of Tables
1. A SAM base form (level of disaggregation 0) ... 3
2. A SAM base form (level of disaggregation 0) – accounts and totals description ... 3
3. A SAM base form (level of disaggregation 0) – nominal transactions description ... 4
4. A SAM of Portugal in 2013 - level of disaggregation 0 ... 7
5. Products (or goods and services) and activities (or industries) description for the level of disaggregation 1 ... 13
6. Domestic institutions description for the level of disaggregation 1 ... 15
7. A SAM of Portugal in 2013 - level of disaggregation 1 ... 16
8. The intermediate consumption of an activity by activity (or industry by industry) IOM of Portugal in 2013 - level of disaggregation 1 ... 18
9. The intermediate consumption of a product by product IOM of Portugal in 2013 - level of disaggregation 1 ... 19
10. Functional distribution of generated income in Portugal in 2013 ... 22
11. Institutional distribution of generated income in Portugal in 2013 ... 23
12. Output of industries (at basic prices) in Portugal in 2013 by goods and services ... 25
13. Output of institutions (at basic prices) in Portugal in 2013 ... 26
14. Costs with the output of industries in Portugal in 2013 ... 27
15. Decomposition of intermediate consumption costs with the output of industries in Portugal in 2013 ... 28
16. Aggregate demand of goods and services in Portugal in 2013 ... 30
17. Decomposition of intermediate consumption of goods and services in Portugal in 2013 ... 31
18. Aggregate supply of goods and services in Portugal in 2013 ... 32
19. Decomposition by goods and services of Gross Domestic Product of Portugal in 2013 ... 33
20. Origin of aggregate income of institutions in Portugal in 2013 ... 34
21. Use of aggregate income of institutions in Portugal in 2013 ... 35
22. Distribution and use of disposable income among institutions in Portugal in 2013 ... 36
23. Investment funds in Portugal in 2013 ... 37
24. Aggregate investment in Portugal in 2013 ... 38
25. The SAM in endogenous and exogenous accounts ... 40
An approach to the structural features of the socio-economic activity of a country based on a Social Accounting Matrix. Evidences and multiplier effects on distribution of income. SSantos
28. Global effects decomposition of unitary exogenous changes in the aggregate income received as
compensation of the factors of production ... 47
29. Initial direct effects of unitary exogenous changes in the aggregate income received by domestic institutions ... 49
30. Global effects of unitary exogenous changes in the aggregate income received by domestic institutions ... 50
31. Global effects decomposition of unitary exogenous changes in the aggregate income received by domestic institutions ... 51
A.1. Integrated Economic Accounts Table of Portugal in 2013 ... 60
A.2. Supply Table of Portugal in 2013 - level of disaggregation 1 ... 62
A.3. Use Table of Portugal in 2013 - level of disaggregation 1 ... 63
A.4.1. (Accounting multipliers for Portugal in 2013) SAM by endogenous and exogenous accounts. ... 64
A.4.2. (Accounting multipliers for Portugal in 2013) Average expenditure propensities matrices. . 66
A.4.3. (Accounting multipliers for Portugal in 2013) Accounting multipliers matrix ... 67
A.4.4. (Accounting multipliers for Portugal in 2013) Additional intragroup or direct effects matrix (M1 - I) ... 67
A.4.5. (Accounting multipliers for Portugal in 2013) Additional intergroup or indirect effects matrix (M2 - I). M1 ... 67
1. Introduction
The activity of a country that involves monetary or nominal flows is complex and its knowledge depends on the use of tools, or working instruments. In this paper this activity, which involves production and institutions, will be designated as “socio-economic activity”, these flows will be all the measured by the National Accounts, and a Social Accounting Matrix (SAM) will be the working instrument, or tool. The research on the potentialities of this tool will be oriented in such a way as to show that it enables the reading and interpretation the multiple aspects of the reality under study, as well as carry out experiments with its functioning.
The option of working with the National Accounts has behind a research purpose of defining a methodology that could be adopted by as many users as possible, and which could contribute to improving the knowledge about different aspects of the so-called socio-economic activity of a country. This resulted from the perception that the National Accounts, on one hand, are aligned to a system that has progressively been adjusted, although with limitations and inaccuracies, with the aim of being improved, which conveys some confidence, mainly regarding alternative sources of information. On the other hand, the National Accounts have been produced in a more-or-less complete and adapted way, by almost every country in the world. Thus, since its disclosure is regular, (or at least partially) free, and credible, its adoption becomes accessible to a greater number of users and uses.
Therefore, the adoption of National Accounts as a base source of information of the SAM could contribute to produce better studies in different areas, as well as useful results for the process of policy evaluation and decision making.
This explains why the rules and the nomenclatures of the latest version of the SNA (ISWGNA, 2009) will underlie the methodology proposed for a work at a macroeconomic level of analysis. As done previously, I will present this methodology in this paper always from a progressively better-systematized perspective. This methodology is my own version, and is a result of research based on the studies of R. Stone, G. Pyatt, and J. Round1, which started with Santos (1999).
A SAM-based approach will be adopted, according to which empirical and theoretical descriptions of the activity of a country are possible with, respectively, numerical and algebraic versions of the SAM. Each cell of a SAM will be a number if it is in a numerical version, and will be an equation or system of equations, if it is in and algebraic version, or SAM-based model.
1 Among the works of those authors I would like to highlight the following: Pyatt (1991, 1991a, 1988); Pyatt and Round
An approach to the structural features of the socio-economic activity of a country based on a Social Accounting Matrix. Evidences and multiplier effects on distribution of income. SSantos
- 2 -
I recognize that the adoption of the SNA rules and nomenclatures implicitly implies the adoption of the SNA underlying theoretical model, however, I realized that this would be the best way to pursue the above-mentioned research purpose.
As will be seen in Chapter 2, the SAM is a square matrix, in which the sum of the rows is equal to the corresponding sum of the columns. These rows and columns represent, respectively, the inflows and outflows of accounts in which production and institutions are worked together at a level of detail that depends on the corresponding disaggregation, extension, and complements [namely, the Input-Output Matrix (IOM)]. Thus, more or less complex networks of linkages of flows with different intensities can be constructed for specific periods and geographical areas, as will be seen in Chapter 3. Structural features of the underlying activity of that network of linkages can be evidenced, and the associated multiplier effects can be studied, as will be seen in Chapters 4 and 5, respectively. Chapters 2 and 3 will show that with the SAM, the value of production and the associated costs as well as the demand and supply of goods and services can be worked together with various types of income, namely, generated, disposable, and accumulated income. This work, which involves production and institutions and a matrix format when based in a numerical version of a SAM, enables an empirical description of the origin, use, and distribution of this income, as will be shown in Chapter 4. In Chapter 5, an algebraic version will be used to illustrate a possible deeper study of the institutional distribution of income, using some of the potentialities of the SAM.
A summary and some concluding remarks are presented in Chapter 6, which will systematize how a matrix form and a specific organisation of the National Accounts, materialized in a SAM, can evidence and provide conditions for research on the structural features of the socio-economic activity of a country.
2. A SAM base form
In a SAM, the monetary or nominal flows between production and institutions, occurring in a particular geographical space, in a given time period are represented and can be studied.
The SAM is a square matrix, in which the sum of the rows is equal to the corresponding sum of the columns. The entries in rows represent resources, incomes, receipts or changes in liabilities, and net worth. In the columns the entries are outlays, expenditures or changes in assets.
2.1. Schematic representation
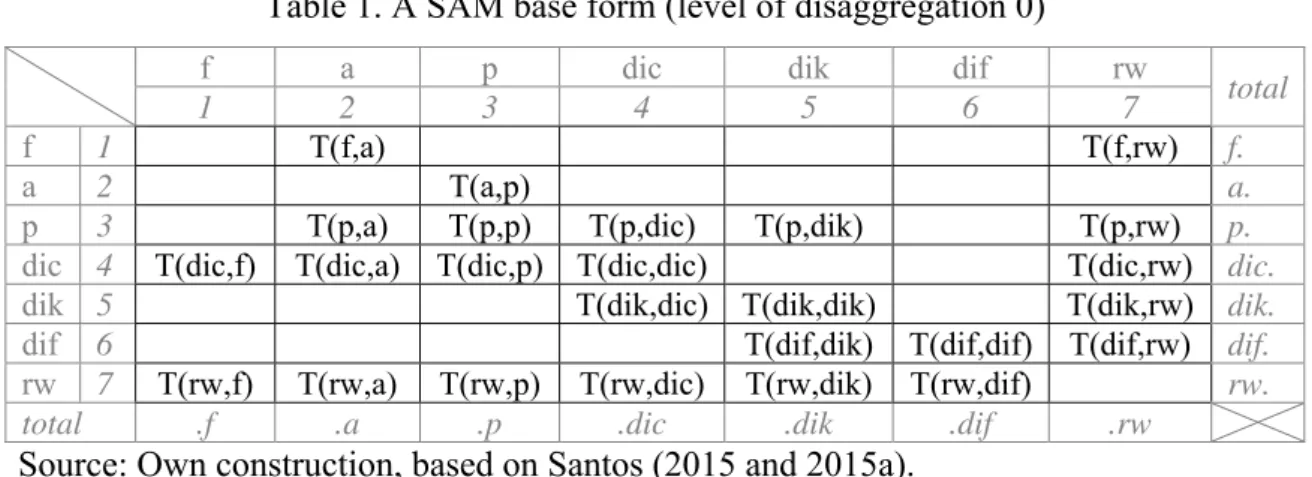
Using a top-down methodology, I will first present a SAM base form, associated to a zero level of disaggregation, which is a summary of the flows measured by the National Accounts. Table 1 shows that form, with seven rows and columns (1 to 7), each of which represent the main SAM accounts – described by the corresponding initials, and the cells represent the above mentioned monetary or nominal flows (also mentioned as transactions) “T”. The location of “T” is described by two initials between brackets, the first of which represents the row account, whilst the second represents the column account. Table 2 identifies and describes these accounts and the corresponding totals, and Table 3 identifies and describes these flows and the corresponding codes in the latest version of the SNA (ISWGNA, 2009).
Table 1. A SAM base form (level of disaggregation 0)
f a p dic dik dif rw total
1 2 3 4 5 6 7
f 1 T(f,a) T(f,rw) f.
a 2 T(a,p) a.
p 3 T(p,a) T(p,p) T(p,dic) T(p,dik) T(p,rw) p.
dic 4 T(dic,f) T(dic,a) T(dic,p) T(dic,dic) T(dic,rw) dic.
dik 5 T(dik,dic) T(dik,dik) T(dik,rw) dik.
dif 6 T(dif,dik) T(dif,dif) T(dif,rw) dif.
rw 7 T(rw,f) T(rw,a) T(rw,p) T(rw,dic) T(rw,dik) T(rw,dif) rw. total .f .a .p .dic .dik .dif .rw
Source: Own construction, based on Santos (2015 and 2015a).
Table 2. A SAM base form (level of disaggregation 0) – accounts and totals description
Accounts
(row and column) row total column SNA accounts (correspondence)
Production
f – factors of production 1
f. - aggregate income, received as
compensation of the factors of production
.f - aggregate income, paid as compensation of the factors of production
primary distribution of income
a – activities
(industries) 2 a. - production value .a - total costs production
p – products
(goods and
services) 3 p. - aggregate demand .p - aggregate supply goods and services
(domestic) Institutions
dic - current 4
dic. - aggregate
income, received by domestic institutions
.dic - aggregate
income, paid by domestic institutions
secondary distribution of income, redistribution of income in kind and use of income
An approach to the structural features of the socio-economic activity of a country based on a Social Accounting Matrix. Evidences and multiplier effects on distribution of income. SSantos
- 4 -
Accounts
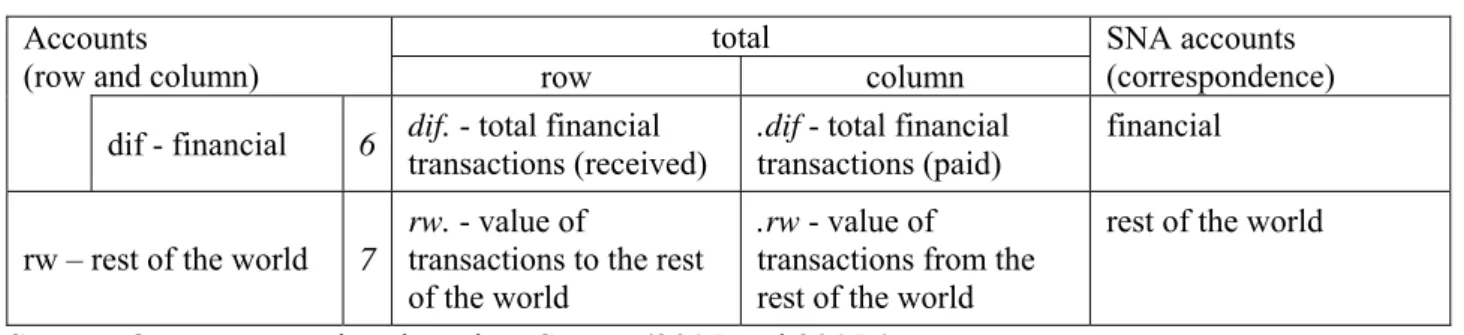
(row and column) row total column SNA accounts (correspondence) dif - financial 6 dif.transactions (received) - total financial .diftransactions (paid) - total financial financial
rw – rest of the world 7
rw. - value of
transactions to the rest of the world
.rw - value of
transactions from the rest of the world
rest of the world
Source: Own construction, based on Santos (2015 and 2015a).
Table 3. A SAM base form (level of disaggregation 0) – nominal transactions description
Flows Description SNA Code T(f,a) compensation of factors of production2
consists of the income of the institutional sectors originating from the compensation of employees and the compensation of employers and own-account (or self-employed) workers, as well as the compensation of capital, including property income
D1 D4 B2g B3g T(f,rw) T(dic,f) T(rw,f)
T(a,p) production (basic prices)
represents the output of goods and services P1
T(p,a) intermediate consumption (purchasers’ prices)
consists of the value of the goods and services consumed as inputs of the process of production, excluding those fixed assets whose consumption is recorded as consumption of fixed capital
P2
T(p,p) trade and transport margins
amount to zero and, when it is disaggregated and takes the form of a submatrix, it allocates the output of the trade and transport services used in the domestic trade to the supplied products
T(p,dic) final consumption (purchasers’ prices)
consists of the expenditure incurred by resident institutional units on goods or services which are used for the direct satisfaction of individual needs or wants, or the collective needs of members of the community
P3
T(p,dik) gross capital formation (purchasers’ prices)
includes gross fixed capital formation, changes in inventories, and acquisitions less
disposals of valuables P5
T(p,rw) exports (purchasers’ prices)
include the transactions in goods and services from residents to non-residents P6 (part of)
T(rw,p) imports (purchasers’ prices) include the transactions in goods and services from non-residents to residents P7
T(dic,p) net taxes on products
represent the taxes on products minus the subsidies on products D21- D31
(part of)
T(rw,p)
T(dic,a) net taxes on production
represent the (other) taxes on production minus the (other) subsidies to production D29- D39 T(rw,a)
T(dic,dic) current transfers3
include: current taxes on income, wealth, etc.; net social contributions; social benefits other than social transfers in kind; other current transfers, and; the adjustment made for the change in pension entitlements
D5 D61 D62 D7 D8 T(dic,rw) T(rw,dic)
2 Also referred to as gross added value in T(f,a).
3 The adjustment made for the change in pension entitlements (D8), included in T(dic,dic), is not a current transfer but,
Flows Description SNA Code T(dik,dik) capital transfers
include: capital taxes; investment grants; and other capital transfers
D91
T(dik,rw) D92
T(rw,dik) D99
T(dik,dic) gross saving
measures the portion of aggregate income that is not used for final consumption expenditure and current transfers to domestic institutions or to the rest of the world B8g
T(dif,dik) net lending(+) /borrowing(-)
the net lending or borrowing of the total economy is the sum of the net lending or borrowing
of the institutional sectors B9
T(dif,dif) financial transactions
include: monetary gold and special drawing rights; currency and deposits; debt securities; loans; equity and investment fund shares or units; insurance, pension and standardised guarantee schemes; financial derivatives and employee stock options; and other accounts receivable/payable F1 to F8 T(dif,rw) T(rw,dif)
Source: Own construction, based on Santos (2015 and 2015a).
Note: A description on the levels of valuation of the flows associated to the production accounts can be found in the Appendix of Santos (2012).
An approach to the structural features of the socio-economic activity of a country based on a Social Accounting Matrix. Evidences and multiplier effects on distribution of income. SSantos
- 6 -
Outline 1. A SAM base form (level of disaggregation 0) – schematic representation of the nominal flows between the accounts, presented and described in Tables 1 and 3.
Source: Own construction, based on Santos (2012a)
2.2. Application
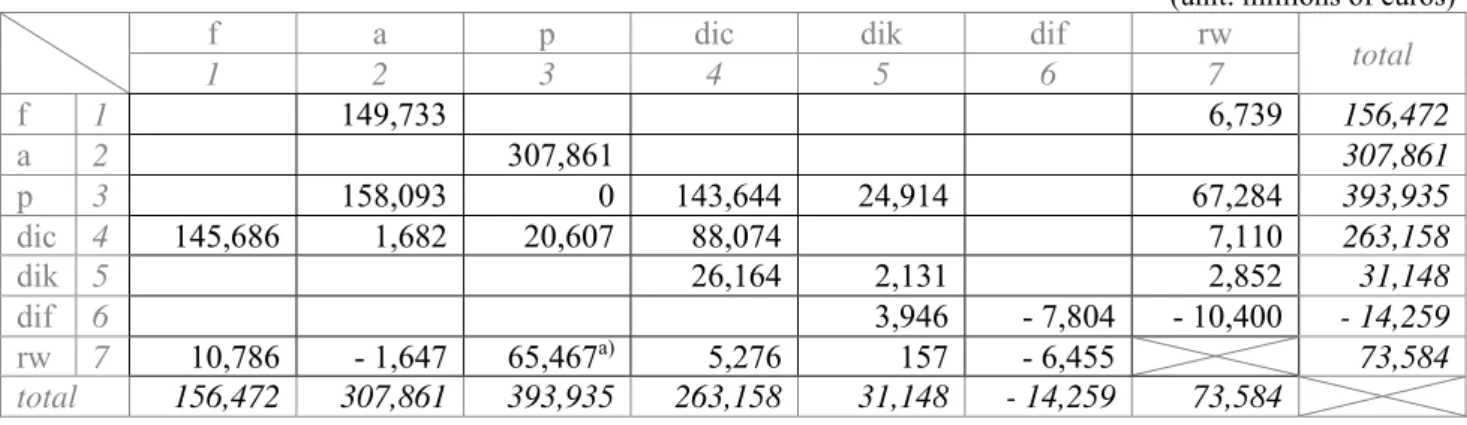
In the SNA the Integrated Economic Accounts (IEA) Table is a summary of all the detail observed by that System, including the full sequence of accounts for (domestic) institutional sectors, the rest of the world and the total economy. Based on this table, and taking into consideration the previous descriptions, it was possible to construct an illustrative SAM base form that is presented in Table 4, which represents the level of disaggregation 0 of the activity of Portugal as observed in the National Accounts of 2013 (at current prices).
f a
dic p dik dif T(rw,a) T(rw,f) T(rw,dic) T(rw,p) T(rw,dik) T(rw,dif) T(dif,rw) T(dik,rw) T(dic,rw) T(f,rw) T(p,rw) T(dif,dik) T(dic,dic) T(p,p) T(dif,dif) T(dik,dik) T(f,a) T(dic,f) T(dic,a)
Table 4. A SAM of Portugal in 2013 - level of disaggregation 0
(unit: millions of euros)
f a p dic dik dif rw total
1 2 3 4 5 6 7
f 1 149,733 6,739 156,472
a 2 307,861 307,861
p 3 158,093 0 143,644 24,914 67,284 393,935
dic 4 145,686 1,682 20,607 88,074 7,110 263,158
dik 5 26,164 2,131 2,852 31,148
dif 6 3,946 - 7,804 - 10,400 - 14,259
rw 7 10,786 - 1,647 65,467a) 5,276 157 - 6,455 73,584
total 156,472 307,861 393,935 263,158 31,148 - 14,259 73,584
Sources: Table A.1 (in Appendix).
a) 65,573 (imports) less 106 (net taxes on products sent to the institutions of the European Union)
Considering the description given in Tables 2 and 3 about Table 1, and based on the reading of the rows and columns of Table 4 we can take a first snapshot of the activity of Portugal in 2013, as described below.
At the level of production accounts, through the factors of production account – row and column f (number 1), show the aggregate or primary income generated in 2013, also designated as
compensation of the factors of production, namely of labour and capital, which was in the sum of 156,472 million Euros. Reading in row, this amount was composed of 149,733 (95.7%) and 6,739 (4.3%) million Euros, received from domestic activities4 and from the rest of the world5, respectively.
Reading in column, this amount was composed of 145,686 (93.1%) and 10,786 (6.9%) million Euros, paid to domestic institutions6 and to the rest of the world, respectively.
In turn, continuing at the level of the production accounts, in the activities account – row and column a (number 2) show, respectively, the production value and the total costs associated with the process of production, which totalled 307,861 million Euros. In row, that amount represented the output of goods and services. In column, it was composed of 149,733 (48.3%) million Euros of compensation of factors of production, 158,093 (51.4%) million Euros of intermediate consumption, 1,682 (0.5%)
4 Received by residents and non-residents working in the Portuguese economic territory. This amount is the gross added
value and does not include taxes and subsidies on production and imports.
5 Received by residents working in the rest of the world.
6 Paid to residents in the Portuguese economic territory. This amount is the gross national income and does not include
An approach to the structural features of the socio-economic activity of a country based on a Social Accounting Matrix. Evidences and multiplier effects on distribution of income. SSantos
- 8 -
million euros of net taxes on production received by the Portuguese Government and – 1,647 (-0.5%) million Euros of net taxes on production received by the institutions of the European Union7.
Finally, still at the level of the production accounts, through the products account – row and column p (number 3) show the main components of the aggregate demand and supply of the goods and services in the Portuguese economy in 2013, which amounted to 393,935 million Euros. Reading in row, the aggregate demand was composed of 158,093 (40.1%) million Euros of intermediate consumption, 143,644 (36.5%) million Euros of final consumption, 24,914 (6.3%) million Euros of gross capital formation, and 67,284 (17.1%) million Euros of exports. Reading in column, the aggregate supply was composed of 307,861 (78.2%) million Euros of the output of goods and services, 20,607 (5.2%) million Euros of net taxes on products received by the Portuguese Government, - 106 million Euros of net taxes on received by the institutions of the European Union7,
and 65,573 (16.6%) million Euros of imports – the last two added in the same cell (T(rw,p)). The trade and transport margins are also a component in account p, which amounts to zero at this level of disaggregation, as mentioned in Table3.
At the level of the domestic institutions accounts, in the current account – row and column dic (number 4) the aggregate income of the Portuguese institutions in 2013 is shown, which amounted to
263,158 million Euros. In row we have the origin of that income, represented as follows: 145,686 (55.4%) million Euros, received as compensation of the factors of production by domestic institutions; 1,682 (0.6%) and 20,607(7.8%) million Euros of net taxes on production and net taxes on products, respectively - both received by the Portuguese government; 88,074 (33.5%) and 7,110 (2.7%) million Euros of current transfers within domestic institutions and from the rest of the world, respectively. In column we have the destination or use of the same income, with the following composition: 143,644 (54.6%) million Euros, in final consumption; 88,074 (33.5%) and 5,276 (2.0%) million Euros in current transfers within domestic institutions and to the rest of the world; 26,164 (9.9%) million Euros in gross savings.
In the capital account - row and column dik (number 5), apart from showing the net lending (or borrowing) of the Portuguese institutions in 2013, information is also shown regarding acquisitions, less disposals of non-financial assets (or the various types of investment in non-financial assets) and capital transfers, which amounted to 31,148 million Euros. Reading in row, this amount represents investment funds, and was composed of: 26,164 (84%) million Euros of gross savings; 2,131 (6.8%)
7 Due to the conventions underlying the SAM structure, this negative (net) amount represents a receipt and not an
and 2,852 (9.2%) million Euros of capital transfers within domestic institutions and from the rest of the world. Reading in column, this amount represents aggregate investment and was composed of: 24,914 (80%) million Euros of gross capital formation; 2,131 (6.8%) and 157 (0.5%) million Euros of capital transfers within domestic institutions and to the rest of the world, respectively, and 3,946 (12.7%) million Euros of net lending.
The financial account - row and column dif (number 6), represents the net flows associated with the
acquisition of financial assets and the incurrence of liabilities, underlying which there is the above-mentioned net lending. These flows amounted to – 14 259 million Euros. Reading in row, this amount is composed of 3,946 million Euros of net lending, - 7,804 million Euros of net financial transactions between domestic institutions, and – 10,400 million Euros of net financial transactions from the rest of the world. Reading in column, besides the net financial transactions between domestic institutions (- 7,804 million Euros), this amount also includes – 6,455 million Euros of net financial transactions to the rest of the world.
The rest of the world account - row and column rw (number 7) show all the transactions between
resident and non-resident actors in the accounts described above (production and domestic institutions), or between the Portuguese economy and the rest of the world in 2013, which amounted to 73,584 million Euros. Thus, the row represents the flows from residents to non-residents, or the value of transactions to the rest of the world, with the following composition: 10,786 (14.7%) million Euros of compensation of factors of production, – 1,647 (-2.2%) million Euros of net taxes on production (received by European Union institutions)7 65,467 (89%) million Euros of imports
(65,573 million Euros), to which is added net taxes on products (- 106 million Euros, received by the institutions of the European Union7 ), 5,276 (7.2%) million Euros of current transfers, 157 (0.2%)
million Euros of capital transfers, and - 6,455 (-8.8%) million Euros of net financial transactions. In turn, the column shows the decomposition of the value of transactions from the rest of the world, or the flows from non-residents to residents, as follows: 6,739 (9.2%) million Euros of compensation of factors of production, 67,284 (91.4%) million Euros of exports, 7,110 (9.7%) million Euros of current transactions, 2,852 (3.9%) million Euros of capital transfers, and – 10,400 (-14.1%) million Euros of net financial transactions.
2.3. Macroeconomic aggregates and types of income
An approach to the structural features of the socio-economic activity of a country based on a Social Accounting Matrix. Evidences and multiplier effects on distribution of income. SSantos
- 10 -
The following description is based on the four tables presented above.
Gross Domestic Product (GDP) can be calculated using the three known approaches: the production approach - in which intermediate consumption [T(p,a)] is subtracted from the output of goods and services [T(a,p)], adding the net taxes on products [T(dic,p) + (part of) T(rw,p)]; the expenditure
approach - in which final consumption [T(p,dic)], gross capital formation [T(p,dik)], and net exports [T(p,rw) – (part of) T(rw,p)] are added; and the income approach - in which net taxes on production
and imports [T(dic,p) + (part of) T(rw,p) + T(dic,a) + T(rw,a)] are added to the gross added value [T(f,a)]. The Portuguese GDP in 2013 was 170,269 million Euros.
GDP is the income generated in the domestic economy by residents and non-residents, added to the total net taxes on production and imports, to be valued at market prices.
Gross Domestic Product can be converted into Gross National Product or Income (GNI), by adding the compensation of factors of production (labour and capital) received from the rest of the world [T(f,rw)], and by deducting the compensation of factors of production (labour and capital) and net taxes on production and imports sent to the rest of the world [T(rw,f) – T(rw,a) – (part of) T(rw,p)],
when these exist. Gross National Income can also be calculated directly from the SAM by adding the compensation of factors received by domestic institutions to the net taxes on production and on products received by domestic institutions [T(dic,f) + T(dic,a) + T(dic,p)]. The corresponding amount for Portugal in 2013 was 167,975 million Euros.
GNI is the income generated in the domestic economy and in the rest of the world by residents, added to the part received by the general government of net taxes on production and imports, to be valued at market prices.
Disposable Income (DI) can be calculated by adding the net current transfers received by domestic institutions [(received, or row sum) T(dic,dic) + T(dic,rw) – (paid, or column sum) T(dic,dic)+ T(rw,dic)] to Gross National Income. In our application for Portugal, this was 169,808 million Euros.
Without considering NL and NB, the above-mentioned gross aggregates can be converted into net aggregates (and S), by deducting the consumption of fixed capital. This lies outside the SAM base form, but is part of the Integrated Economic Accounts Table, in which the above presented macroeconomic aggregates are balancing items (codes B) - Table A.1 (in Appendix) is illustrative of the case of Portugal in 2013.
3. SAM accounts - disaggregation, extension and complements
From the presented base form, or level of disaggregation 0, depending on the aim of the study in which the SAM is being adopted and the available information, other SAMs can be constructed, with other levels of disaggregation in the production, institutions and rest of the world accounts, either within the scope of the SNA conventions, or not. Thus, each cell of the SAM base form (see Table 1 and 4, for the application to Portugal) will be converted into a sub-matrix, with the number of rows and columns corresponding to the level of disaggregation of the row and column accounts. The following description will continue adopting the latest version of the SNA nomenclatures and the type of the flows after the disaggregation will continue to be the same, although with the due specifications. The consistency of the whole system will therefore be preserved.
A first level of disaggregation (level of disaggregation 1) will be presented below. No other levels of disaggregation will be made in this paper, and that will be adopted as the specification of what can be made from the base form presented in the previous chapter.
I am aware that I am only making an introductory approach to the study of the structures of production and income distribution and that higher levels of disaggregation are required for more complete studies. However, as I stated in the Introduction, the purpose of this study is methodological, and as such, a coherent and thorough treatment of this first level will facilitate the move to higher levels. Before continuing, I would also like to mention the possibilities that Quarterly and Regional National Accounts provide in terms of disaggregation in time and in space8. In turn, the Satellite Accounts
(and other extensions), as presented in Chapter 29 of SNA (2008) can provide supplementary information in specific areas (such as: labour, health, unpaid household activity, household production) in a way that is consistent with the central framework, which can be useful to extend and/or complement the SAM.
An approach to the structural features of the socio-economic activity of a country based on a Social Accounting Matrix. Evidences and multiplier effects on distribution of income. SSantos
- 12 -
3.1. Production accounts and the IOMs
As shown by Table 2, in the base form, the SAM production accounts are divided into factors of production, activities (industries) and products. These accounts correspond, respectively to the following SNA accounts: primary distribution of income, production, and goods and services. The nominal flows associated to those accounts can be identified in Table 1, which are described in Table 3.
Providing details about the process of production, within the SAM production accounts, one can see how the income resulting from the process of production and the ownership of assets is distributed within institutions and activities and how the available products (or goods and services) are used. These accounts also provide details about the process of production, regarding which the Input-Output Matrix (IOM) can add some more information on intermediate consumption of activities and products.
Considering the available information and the SNA nomenclatures, in this paper the disaggregation of the factors of production account was made in “labour” and “others”. The former (labour) includes the compensation of employees. The later (others) includes the compensation of employers and own-account (or self-employed) workers and also the compensation of capital, namely property income. Such information can be derived from the IEA Table if the products and activities accounts are not disaggregated and from the Use Table, if the same accounts are disaggregated.
At the level of the SNA, the International Standard Industrial Classification of All Economic Activities (ISIC) Revision 4 (released on August 2008) is used to classify activities, which are organised into 21 sections, with the possibility of going as far as the fourth level of disaggregation. Identical organization is adopted by ESA, the Statistical Classification of Economic Activities in the European Community (NACE) Revision 2 (released on January 2008). The Supply and Use Tables provide this information, usually at a third level of disaggregation.
Regarding products, the SNA uses the Central Product Classification (CPC) Version 2.1 (released on August 2015), which are organised into 10 sections, with the possibility of going as far as the fifth level of disaggregation within each of these. The ESA uses the Statistical Classification of Products by Activity (CPA) Version 2.1 (released on November 2012), which are organised in the same way as activities, as the name implies.
the Supply and Use Tables (see appendices A.2 and A.3), as presented in the SAM of Table 7. In turn, in Tables 8 and 9 we can see IOMs specifying the intermediate consumption of activities and products, respectively.
This is the first time that I include IOMs in my research with SAMs. For now on, these matrices will only be used to increase the detail of the production structural features. Especially for the case of the “industry by industry” IOM, this should be considered as a first step for further research in order to explore the following Graham Pyatt’s statement:
“… SAMs and extended IO tables are not equivalent and one key difference can be explained by analogy. The essence of IO is not that production activity is disaggregated into different industries, but that these industries are related, one to other, through transactions between them, i.e. through the buying and selling of raw materials, and that the structure of production is conditioned by these linkages. By the same token, the essence of a SAM, in this context, is not the disaggregation of institutions into different household types plus various categories of companies, government and the rest of the world, all of which is on offer through an extended IO approach. Rather, the essential detail is to be found in the matrix of transactions and transfers between different types of institutions. These details include the unrequited transfers which characterize the social security system and direct taxation, all types of private remittance and all property income flows. The pattern of these transfers conditions the distribution of income in exactly the same way as the pattern of inter industry transactions conditions the structure of production” (Pyatt, 1999)
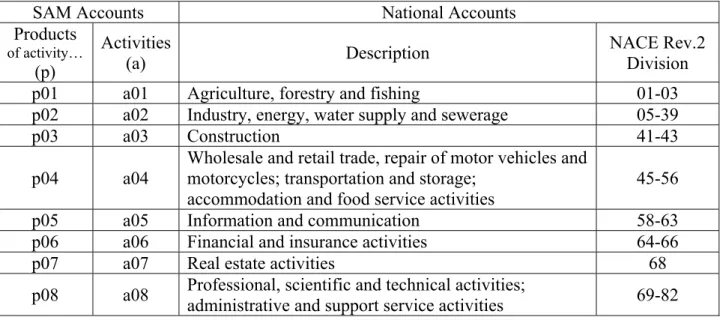
Table 5. Products (or goods and services) and activities (or industries) description for the level of disaggregation 1
SAM Accounts National Accounts
Products
of activity…
(p)
Activities
(a) Description NACE Rev.2 Division
p01 a01 Agriculture, forestry and fishing 01-03
p02 a02 Industry, energy, water supply and sewerage 05-39
p03 a03 Construction 41-43
p04 a04 Wholesale and retail trade, repair of motor vehicles and motorcycles; transportation and storage;
accommodation and food service activities 45-56
p05 a05 Information and communication 58-63
p06 a06 Financial and insurance activities 64-66
p07 a07 Real estate activities 68
An approach to the structural features of the socio-economic activity of a country based on a Social Accounting Matrix. Evidences and multiplier effects on distribution of income. SSantos
- 14 -
SAM Accounts National Accounts
Products
of activity…
(p)
Activities
(a) Description NACE Rev.2 Division
p09 a09 Public administration and defence; compulsory social security; education; human health and social work
activities 84-88
p10 a10 Arts; entertainment; repair of household goods and other services 90-99
Source: Own construction
3.2. Domestic institutions and rest of the world accounts
The proposed SAM base form, presented in Table 1, disaggregates the domestic institutions accounts into current, capital and financial accounts. As is systematized by Table 2, the capital and financial accounts have a direct correspondence between SAM and SNA, whereas the SAM current account corresponds to the following SNA accounts: secondary distribution of income, redistribution of income in kind and use of income. Once again, the flows associated with these accounts can be identified in Table 1, which are described in Table 3.
Depending on the adopted level of disaggregation, through the current account we can see how national income is transformed into disposable income through the receipt and payment of current transfers, and how the latter is distributed between final consumption and saving. On the other hand, through the capital account, we can see the flows linked to acquisitions less disposals of non-financial assets (or the various types of investment in non-financial assets), the capital transfers involving the redistribution of income, and the net lending or borrowing of domestic institutions. In the financial account we can see the net flows that involve financial assets and liabilities that take place between domestic institutions, and between these and the rest of the world.
Both in the SAM and in the SNA through the rest of the world account we can see all the linkages between the domestic economy and the rest of the world, i.e. all the nominal flows between resident and non-resident units.
Chapter 4 of the 2008 SNA specifies the institutional sectors, including the rest of the world, as well as their possible disaggregation, which in some cases can be taken as far as the third level, although normally it cannot be taken beyond the first level. In the case of the rest of the world, such disaggregation will certainly depend on the country, or group of countries, that adopt and adapt this system.
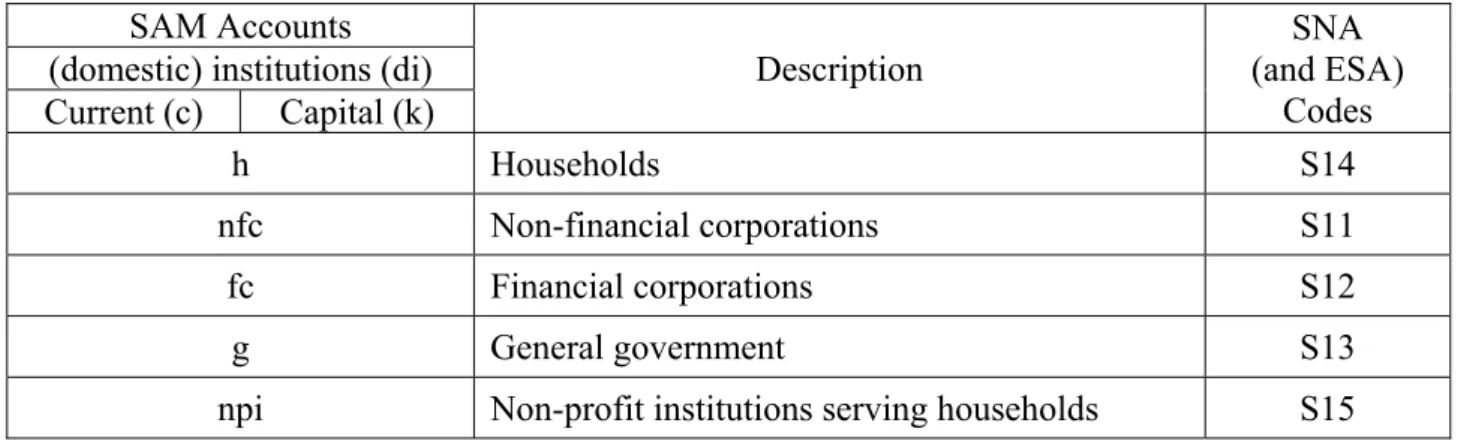
Table 6. Domestic institutions description for the level of disaggregation 1 SAM Accounts
Description (and ESA) SNA
Codes (domestic) institutions (di)
Current (c) Capital (k)
h Households S14
nfc Non-financial corporations S11
fc Financial corporations S12
g General government S13
npi Non-profit institutions serving households S15
Source: Own construction
At the first level of disaggregation, the accounts of both institutions and the rest of the world are part of the Integrated Economic Accounts Table. Higher levels of disaggregation, whenever these are possible, are usually published in the separate accounts of institutions. Even at the first level of disaggregation, any research carried out of the institutional sectors with flows involving more than one row or column of the SAM, also requires the so-called “from whom to whom matrices”. These matrices make it possible to fill in the cells of the sub-matrices of transactions taking place both within domestic institutions, and also between domestic institutions and the rest of the world, which are recorded in the above-described current, capital, and financial accounts9.
Table 7 presents the level of disaggregation classified as the first, which was that rendered possible in the institutions’ current and capital accounts, derived from the Integrated Economic Accounts Table (see appendix A.1) and the “from whom to whom matrices” for the application to Portugal in 2013.
Just as the matrix form of the production accounts may be easily worked on from the supply and use tables, it would also be possible to work on the matrix form of the institutional accounts if some kind of “from whom to whom tables” were made official. This would be a crucial factor for implementing the SAM-based approach, in which SAMs with production and institutions accounts, capturing the network of linkages associated to the measured flows of income, would form the basis for macroeconomic models which would be capable of reproducing the multiplier processes that are implicit in the socio-economic activity of countries.
9 For the application to Portugal in 2013 here presented, Statistics Portugal (INE), who works and discloses the
non-financial National Accounts, provided (particularly) the “from whom to whom matrices” for the flows covered by the current an capital accounts to which those matrices were needed. However, that was not possible for the flows covered by the financial account, worked and disclosed by the Portuguese Central Bank (Banco de Portugal). That is why the financial SAM account is not disaggregated, like the current and capital accounts are.
An approach to the structural features of the socio-economic activity of a country based on a Social Accounting Matrix. Evidences and multiplier effects on distribution of income. SSantos
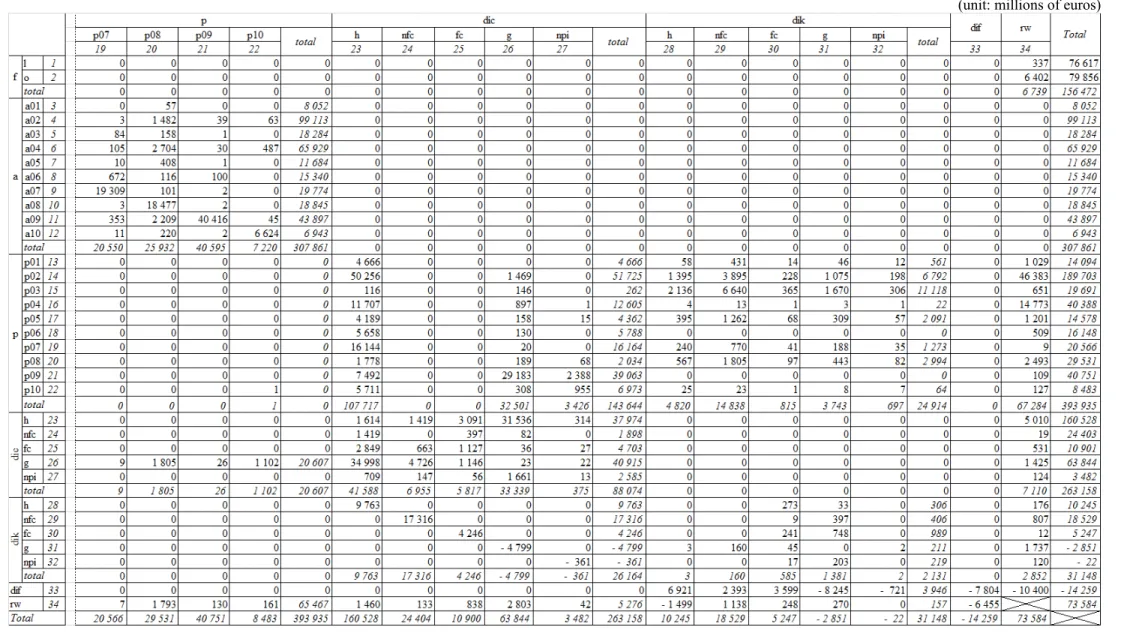
- 16 - Table 7. A SAM of Portugal in 2013 - level of disaggregation 1
(unit: millions of euros)
Table 7. (continued) A SAM of Portugal in 2013 - level of disaggregation 1
(unit: millions of euros)
An approach to the structural features of the socio-economic activity of a country based on a Social Accounting Matrix. Evidences and multiplier effects on distribution of income. SSantos
- 18 -
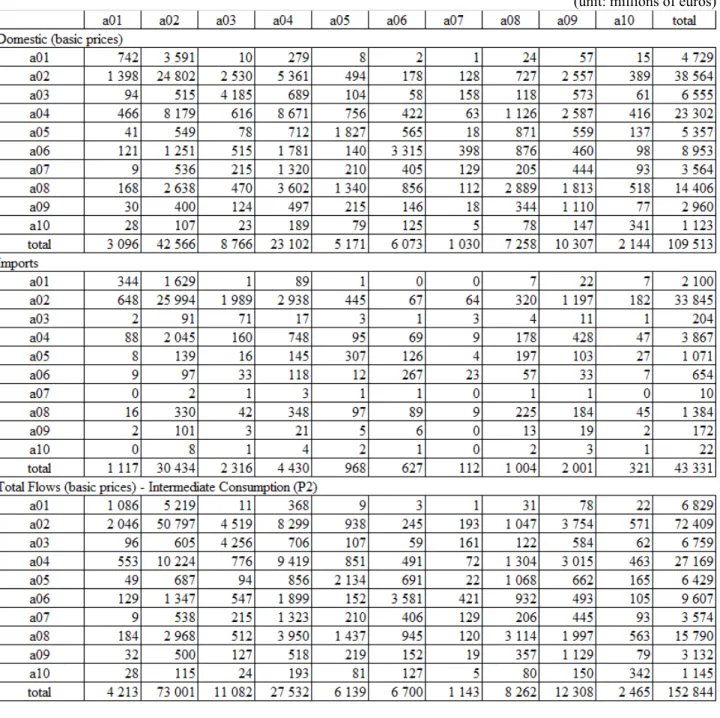
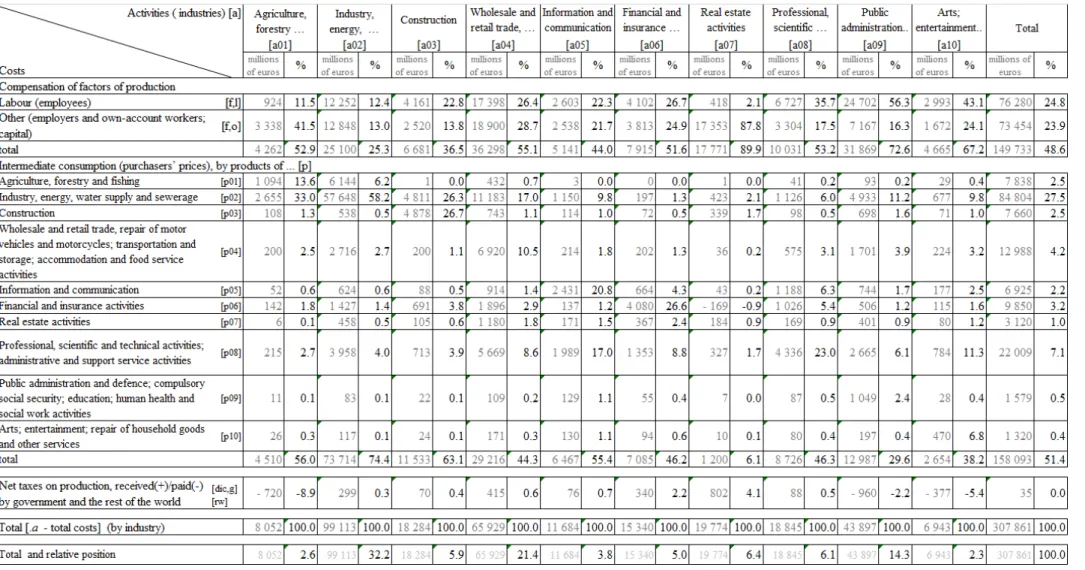
Table 8. The intermediate consumption of an activity by activity (or industry by industry) IOM of Portugal in 2013 - level of disaggregation 1
(unit: millions of euros)
Sources: Statistics Portugal (INE); World Input-Output Database (WIOD)
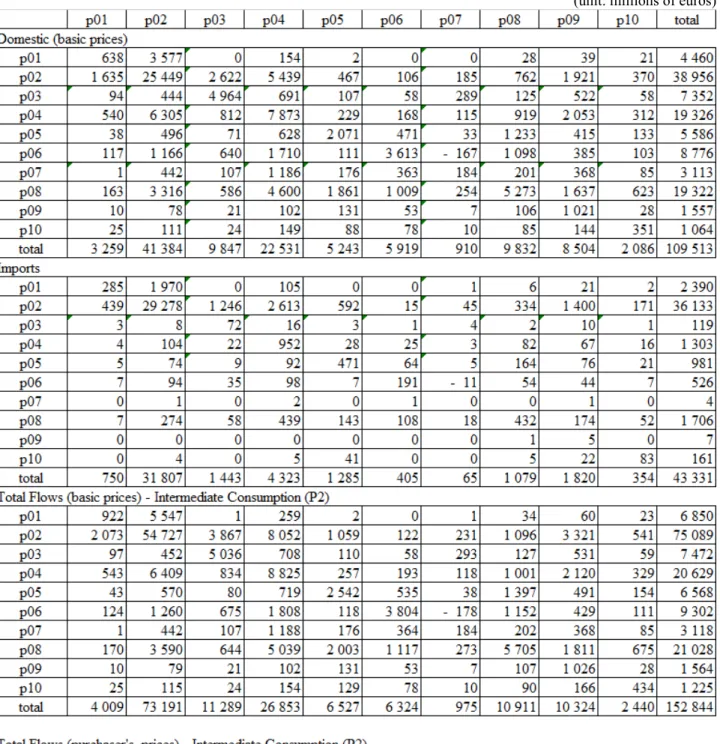
Table 9. The intermediate consumption of a product by product IOM of Portugal in 2013 - level of disaggregation 1
(unit: millions of euros)
An approach to the structural features of the socio-economic activity of a country based on a Social Accounting Matrix. Evidences and multiplier effects on distribution of income. SSantos
- 20 -
4. Evidences on the structural features of the socio-economic activity of a country
In Chapter 2, Section 2.2, we first approached the structures of production, income distribution, investment, and transactions with the rest of the world, when we read the rows and the columns of the seven accounts of the level of disaggregation 0 of the SAM of Portugal in 2013 - Table 4. As we saw in Chapter 3, higher levels of disaggregation of the SAM and possible extensions and/or complementary information, such as IOM, will certainly improve our knowledge of those structures – Tables 7, 8 and 9 illustrate this for the case of Portugal in 2013.
An exhaustive reading of the rows and columns of Table 7, such as was carried out for the level of disaggregation 0 (Table 4), would be extensive and time-consuming and would be beyond the scope of this study. In this chapter we examine the values in the proposed SAM that can be used to describe the structural features of the socio-economic activity of a country, in transition between Chapters 2 and 3, in which a SAM and its possibilities of work were presented, and in Chapter 5, where multiplier effects on the distribution of generated income will be studied.
Returning to Chapter 2, and to our previous analysis of Table 4, in the case of the aggregate income, associated with the compensation of the factors of production, which total 156,472 million Euros, from Table 7, we now can see that 76,617 million Euros was compensation of employees – row and column 1, and 79,856 million Euros account for compensation of other factors of production, namely employers and the self-employed, land, and capital (including property income) – row and column 2. Row 1 shows that the total received as compensation of employees corresponded to a part of the gross added value10 generated in the domestic activities by residents and non-residents, in the sum of 76,280
million Euros, to which are added 337 million Euros generated abroad by residents. In turn, row 2 shows that the total received as compensation of other factors of production corresponded to the other part of the gross added value10 generated in the domestic activities by residents and non-residents, in
the sum of 73,454 million Euros, to which 6,402 million Euros generated abroad by residents are added. Next we examine the part generated from domestic activities, disaggregated in 10 sectors, which will improve the information available for the study of the functional distribution of generated income, as shown in Table 10, to which was added some data from previous studies regarding the totals of factors since 1995.
Column 1 shows that the total paid as compensation of employees corresponded to a part of the gross national income generated in the domestic economy and abroad by residents that is received by households, in the sum of 76,246 million Euros, to which are added 371 million Euros generated in the domestic economy by non-residents and sent to the rest of the world.
In column 2, the total paid as compensation of other factors of production was decomposed in the part of the gross national income generated10 in the domestic economy and abroad by residents which
An approach to the structural features of the socio-economic activity of a country based on a Social Accounting Matrix. Evidences and multiplier effects on distribution of income. SSantos
- 22 - Table 10. Functional distribution of generated income11 in Portugal in 2013
Source: Table 7
11 The difference between the total gross domestic income presented in this table and the gross domestic product presented in Section 2.3 of Chapter 2 is the total net taxes on
production and imports.
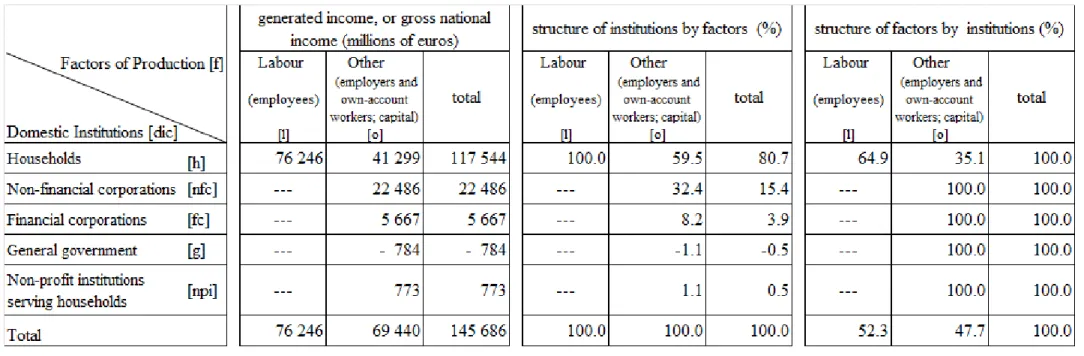
Table 11. Institutional distribution of generated income12 in Portugal in 2013
Source: Table 7
12 The difference between the total gross national income presented in this table and the gross national product presented in Section 2.3 of Chapter 2 is the net taxes on production
and imports received by the general government.
An approach to the structural features of the socio-economic activity of a country based on a Social Accounting Matrix. Evidences and multiplier effects on distribution of income. SSantos
- 24 -
Table12. Output of industries (at basic prices) in Portugal in 2013 by goods and services
An approach to the structural features of the socio-economic activity of a country based on a Social Accounting Matrix. Evidences and multiplier effects on distribution of income. SSantos
- 26 - Table13. Output of institutions (at basic prices) in Portugal in 2013
Table 14. Costs with the output of industries in Portugal in 2013
An approach to the structural features of the socio-economic activity of a country based on a Social Accounting Matrix. Evidences and multiplier effects on distribution of income. SSantos
- 28 -
Table 15. Decomposition of intermediate consumption costs with the output of industries in Portugal in 2013
(Unit: %)
In the structure of the SAM base form that is proposed in Chapter 2, at the level of disaggregation 0, the products account is the other of the three components of the production accounts, in addition to the factors of production and activities accounts. Similar to that which was carried out in the activities account, at the level of disaggregation 1, the products account is now disaggregated into ten products, or goods and services – rows and columns 13 to 22, allowing for more detailed information about the components of the aggregate demand (in row) and supply (in column) of the goods and services in the Portuguese economy in 2013, which was in the amount of 393,935 million Euros, as we saw in Chapter 2. Table 16, complemented by Table 17, show the structure of aggregate demand and Table 18 show the structure of aggregate supply. Within aggregate demand, the intermediate consumption can also be specified by Tables 14 and 15. Within aggregate supply, the output of goods and services can also be specified by Tables 12 and 13.
An approach to the structural features of the socio-economic activity of a country based on a Social Accounting Matrix. Evidences and multiplier effects on distribution of income. SSantos
- 30 - Table 16. Aggregate demand of goods and services in Portugal in 2013
Table 17. Decomposition of intermediate consumption of goods and services in Portugal in 2013 (Unit: %)
An approach to the structural features of the socio-economic activity of a country based on a Social Accounting Matrix. Evidences and multiplier effects on distribution of income. SSantos
- 32 - Table 18. Aggregate supply of goods and services in Portugal in 2013
Table 19. Decomposition by goods and services of Gross Domestic Product of Portugal in 2013
Source: Table 7
An approach to the structural features of the socio-economic activity of a country based on a Social Accounting Matrix. Evidences and multiplier effects on distribution of income. SSantos
- 34 - Table 20. Origin of aggregate income of institutions in Portugal in 2013
Table 21. Use of aggregate income of institutions in Portugal in 2013
An approach to the structural features of the socio-economic activity of a country based on a Social Accounting Matrix. Evidences and multiplier effects on distribution of income. SSantos
- 36 -
On the other hand, as already mentioned in Chapter 3, Section 3.2, through the current account we can see how national income is transformed into disposable income through the receipt and payment of current transfers, and how the latter is distributed between final consumption and saving. As was explained in Chapter 2, Section 2.3, disposable income is calculated outside the SAM, as well as, the structures of its distribution and use. For the case of Portugal in 2013, these amounts can be seen in Table 22, to which was also added some data regarding use totals since 1995, from previous studies.
Table 22. Distribution and use of disposable income among institutions in Portugal in 2013
Source: Table 5
The other two of the three domestic institutions accounts identified in Chapter 3, are the capital and the financial accounts, from which it is possible to obtain information on investment, respectively, in non-financial and financial assets and also the flows of funds associated with the corresponding acquisitions and disposals. Because it was not possible to disaggregate the financial account, we will not explore the part relating to financial assets, and neither will we directly explore the rest of the world account, as the details associated with it that are considered to be of interest for the purpose of this study were approached with the accounts that had been previously worked on.
Thus, returning to the capital account, as was seen in Chapter 2, the investment funds (in row) and aggregate investment (in column) of institutions, amounted to 31,148 million Euros, in Portugal in 2013. The corresponding structures can be seen in Tables 23 and 24.
Table 23. Investment funds in Portugal in 2013
An approach to the structural features of the socio-economic activity of a country based on a Social Accounting Matrix. Evidences and multiplier effects on distribution of income. SSantos
- 38 - Table 24. Aggregate investment in Portugal in 2013
As was carried out by Santos (2013, 2012a and 2011), for example, the main items of income and expenditure of the institutional sectors and of the rest of the world can be identified from the respective rows and columns of the SAM, when it is, at least, at a first level of disaggregation, as shown in Table 7 for our application to Portugal in 2013. In the case of the institutional sectors, in which we can talk about balance sheets of the institutions: the total balancing item is the corresponding net lending/borrowing; the current balancing item is the gross saving, and; the capital balancing item is the difference between the first and the second. In the case of the rest of the world we can talk about balance of payments and its components.
5. Multiplier effects associated with the institutional distribution of income
Returning to the systematization previously adopted by Santos (2010, following 2004 and 2007), in keeping with the research of Pyatt and Roe (1977), and Pyatt and Round (1985), the approach adopted in this chapter will be based on the SAM and will be centered on the use of multipliers and their decomposition.
Thus, the following assumptions will be considered:
- The structural features for production and income distribution identified in Chapters 2 and 4 are the relevant ones.
- The production technology and resource endowment are provided. - There is excess capacity in the economy.
Since income distribution includes redistribution, namely transfers within institutions, prices will not be separated from quantities. Therefore, the whole mathematical and analytical study will be made at the level of values. On the other hand, since the analysis will be static or comparatively static, data will be shown at current prices.
5.1. Methodology
As shown in Table 25, the SAM accounts will be classified and organized as exogenous and endogenous, and, consequently, the flows or transactions in each cell of the SAM will be considered exogenous or endogenous, according to the corresponding row and column accounts.
An approach to the structural features of the socio-economic activity of a country based on a Social Accounting Matrix. Evidences and multiplier effects on distribution of income. SSantos
- 40 - Table 25. The SAM in endogenous and exogenous accounts
Expenditures
Endogenous Exogenous
Total
Sum Sum
Receipts
Endogenous N n X x yn
Exogenous L l R r yx
Total y’n y’x
Source: Pyatt and Round (1985).
Where:
N = matrix of flows between endogenous accounts; n = vector of the (corresponding) row sums. X = matrix of flows between exogenous and endogenous accounts (injections from first into second);
x = vector of the (corresponding) row sums.
L = matrix of flows between endogenous and exogenous accounts (leakages from first into second); l = vector of the (corresponding) row sums.
R = matrix of flows between exogenous accounts; r = vector of the (corresponding) row sums. yn = vector (column) of the receipts of the endogenous accounts (ŷn: diagonal; ŷn-1: inverse); yn’ =
vector (row) of the expenditures of the same accounts.
yx = vector (column) of the receipts of the exogenous accounts; yx’ = vector (row) of the expenditures
of the same accounts.
From Table 25, it can be stated that
yn = n + x (1)
yx = l + r (2)
The amount that the endogenous accounts receive is equal to the amount that they spend (row totals equal column totals). In other words, in aggregate terms, total injections from the exogenous into the endogenous accounts (i.e. the column sum of “x”) are equal to total leakages from the endogenous into the exogenous accounts, i.e. considering i’ to be the unitary vector (row), the column sum of “1” is:
x *i’ = l * i’. (3)
In the structure of Table 25, if the entries in the N matrix are divided by the corresponding total expenditures
,
a corresponding matrix (squared) can be defined of the average expenditurepropensities of the endogenous accounts within the endogenous accounts or of the use of resources within those accounts. Calling this matrix An, it can be stated that
N = An*ŷn (5)
Considering equation (1), yn = An*yn + x (6)
Therefore, yn = (I-An)-1* x = Ma * x. (7)
We thus calculate the equation that provides the total receipts of the endogenous accounts (yn), by
multiplying the injections “x” by the matrix of the accounting multipliers:
Ma = (I-An)-1. (8)
On the other hand, if the entries in the L matrix are divided by the corresponding total expenditures
,
a corresponding matrix (not squared) can be defined of the average expenditure propensities of the endogenous accounts into the exogenous accounts, or of the use of resources from the endogenous accounts into the exogenous accounts. Calling this matrix Al, it can be stated that
Al = L*ŷn-1 (9)
L = Al*ŷn (10)
Considering equation (2), yx = Al*yn + r (11)
Thus, l = Al * yn = Al * (I-An)-1* x = Al * Ma * x. (12)
Therefore, with the accounting multipliers, the impact of changes in receipts is analysed at the moment they occur, assuming that the structure of expenditure in the economy does not change.
Accounting multipliers can be decomposed, if we consider the An matrix and two other ones with the
same size: Bn - with the diagonal of An, whilst all the other elements are null; and Cn - with a null
diagonal, but with all the other elements of An. In this way, it can be stated that
An = Bn + Cn. (13)
Thus, from equation (6):
yn = Bn * yn +Cn * yn + x = I – (I - Bn)-1 *Cn-1 * (I - Bn)-1 * x 13. (14)
Therefore: Ma = I – (I - Bn)-1 *Cn-1 * (I - Bn)-1 = M3*M2*M1. (15)
The accounting multiplier matrix is thus decomposed into multiplicative components, each of which relates to a particular kind of connection in the system as a whole (Stone, 1985)14.
- The intragroup or direct effects matrix, which represents the effects of the initial exogenous injection within the groups of accounts intowhich it had originally entered:
M1 = (I - Bn)-1. (16)
13 yn = An*yn + x = Bn*yn + Cn*yn + x yn - Bn*yn = Cn*yn + x yn = (I-Bn)-1* Cn * yn + (I-Bn)-1 *x yn - (I-Bn)-1 * Cn * yn
= (I-Bn)-1 *x yn * [I - (I-Bn)-1 * Cn] = (I-Bn)-1 * x yn = [I - (I-Bn)-1 * Cn]-1 * (I-Bn)-1 * x.
14 For a detailed breakdown and explanation of these components, see, for example, Stone (1985, pp. 156-162); Pyatt and
An approach to the structural features of the socio-economic activity of a country based on a Social Accounting Matrix. Evidences and multiplier effects on distribution of income. SSantos
- 42 -
- The intergroup or indirect effects matrix, which represents the effects of the exogenous injection into the groups of accounts, after its repercussions have completed a tour through all the groups and returned to the one which they had originally entered. In other words, if we consider “t” to be the number of groups of accounts:
M2 = {I - [(I - Bn)-1 * Cn ]t}-1. (17)
- The extragroup, or cross effects matrix, which represents the effects of the exogenous injection when it has completed a tour outside its original group without returning to it, or, in other words, when it has moved around the whole system and ended up in one of the other groups. Thus, for the “t” groups of accounts:
M3 = {I + [(I - Bn)-1 * Cn ] + [(I - Bn)-1 * Cn ]2 + … + [(I - Bn)-1 * Cn ]t-1} (18)
The decomposition of the accounting multipliers matrix can also be undertaken in an additive fashion, as follows:
Ma = I + (M1 - I) + (M2 - I) * M1 + (M3 - I) * M2* M1 (19)
where I represents the initial injection, and the remaining components are the additional effects associated, respectively, with the three components described above (M1, M2 and M3).
Considering the methodology described above, in the application to our case study (Portugal in 2013), the classification of the SAM accounts into endogenous and exogenous was conditioned by the purpose of this part of our study, that is, the study of the multiplier effects of the socio-economic activity of a country associated with the institutional distribution of income. Therefore, the factors of production and the current account of domestic institutions were set as endogenous, and all the other SAM accounts as exogenous. Thus, in the exogenous part there is: production, represented by the activities and products SAM accounts; investment, represented by the capital and financial SAM accounts of domestic institutions, and; rest of the world.
The following analysis is based on the calculated multipliers, from which quantitative approximations of the effects of unitary changes (positive or negative) on the income of endogenous accounts will be identified, that is to say, in the compensation of the factors of production, and in the aggregate income of domestic institutions. We will try to bear in mind that the socio-economic activity of a country involves industries and institutions, as well as the network of linkages captured by the SAM that underlie these quantitative approximations. We will consider this network of linkages, as explained above and schematized in Chapter 2 - Outline 1, and the corresponding structural features, systematized in Chapter 4, whose detail depends on the disaggregation, extension, and complements of the SAM accounts, as was explained in Chapter 3.