i i
“main” — 2018/9/5 — 11:49 — page 123 — #1
i i
Revista Brasileira de Geof´ısica (2017) 35(2): 123-139 © 2017 Sociedade Brasileira de Geof´ısica ISSN 0102-261X
www.scielo.br/rbg
SEISMIC ATTRIBUTES ANALYSIS OF A PERMO-POROUS SYSTEM IN
NEOBARREMIAN-EOAPTIAN CARBONATES RESERVOIRS – CAMPOS BASIN (BRAZIL)
Milena Cristina Rosa
1and Maria Gabriela Castillo Vincentelli
2ABSTRACT.The geological complexity of carbonate reservoirs formed by coquinas at the rift section of Campos and Santos basins has been directing the studies aiming efforts to understand this type of reservoir, even in an analogue form. The application of this analysis intends to help the understanding of the main physical properties distribution and the geometric permo-porous system associated to the potential reservoir levels located in carbonate reservoirs formed by coquinas in the Upper Barremian – Lower Aptian in Campos Basin. The method uses seismic attributes generated from 3D seismic and their correlation with the petrophysical property as porosity from well logs. Considering two pre-defined reservoir levels (CI-A and CS), the correlation between the main physical properties (well logs and petrophysical analysis) and the seismic attributes of amplitude and sweetness showed correlation coefficients ranging from R2≥0.7 to R2≤0.92. This integration of this petro-physical analysis with the seismic interpretation concludes that the porosity distribution at the reservoir level CI-A has higher influence of the tectonic structure, when compared to the reservoir level CS, with the best porosities (8% to 24%) following the main structures with NW-SE direction. The porosity values from reservoir level CS has a homogeneous distribution and reduces porosity towards South-Southeast, following the thickness decrease of these coquinas reservoir level.
Keywords: seismic interpretation, reservoir levels, petrophysics, coquinas.
RESUMO.A complexidade geol´ogica dos reservat´orios carbon´aticos formados por coquinas da sec¸˜ao rifte das bacias de Campos e Santos tem direcionado estudos, mesmo que de uma forma an´aloga, para entender a distribuic¸˜ao de suas principais propriedades f´ısicas e o comportamento geom´etrico do seu sistema permo-poroso. O m´etodo proposto contempla o uso de atributos s´ısmicos que s˜ao gerados a partir de um volume s´ısmico de amplitude e a sua correlac¸˜ao com a porosidade, cal-culada a partir dos perfis de poc¸o, e tem como objetivo contribuir para a definic¸˜ao de potenciais n´ıveis-reservat´orio de interesse e na definic¸˜ao da geometria do sistema permo-poroso associado a reservat´orios carbon´aticos formados por coquinas do neobarremiano-eoaptiano da Bacia de Campos. Considerando dois n´ıveis-reservat´orio predefinidos (CI-A e CS), a correlac¸˜ao entre as principais propriedades f´ısicas (perfil de poc¸o e petrof´ısica) e os atributos s´ısmicos de amplitude esweetness
apresentaram coeficientes de correlac¸˜ao que v˜ao de R2≥0,7 at´e R2≤0,92. Finalmente a an´alise da distribuic¸˜ao da porosidade para o n´ıvel-reservat´orio CI-A mostra uma alta influˆencia da estruturac¸˜ao tectˆonica na distribuic¸˜ao dessa propriedade, se comparado com o n´ıvel CS, com as melhores porosidades (8% a 24%) seguindo as principais estruturas com direc¸˜ao NW-SE. Os valores de porosidade para o n´ıvel CS se distribuem de modo mais homogˆeneo e diminuem para sul e sudeste juntamente com a diminuic¸˜ao das espessuras dos n´ıveis-reservat´orios de coquinas.
Palavras-chave: interpretac¸˜ao s´ısmica, n´ıveis-reservat´orio, petrof´ısica, coquinas.
1Universidade Estadual Paulista “J´ulio de Mesquita Filho” (UNESP), P´os-Graduac¸˜ao em Geociˆencias e Meio Ambiente, Instituto de Geociˆencias e Ciˆencias Exatas (IGCE), Avenida 24-A, 1515, Bela Vista, 13506-900 Rio Claro, SP, Brazil. Phone: +55(19) 3526-9446 – E-mail: [email protected]
2Fundac¸˜ao para o Desenvolvimento da Unesp (FUNDUNESP), Laborat´orio de Interpretac¸˜ao de Dados S´ısmicos e Geol´ogicos (LISG), Centro de Geociˆencias Apli-cadas ao Petr´oleo (UNESPetro), Universidade Estadual Paulista “J´ulio de Mesquita Filho” (UNESP), Avenida 24-A, 1515, Bela Vista, 13506-900 Rio Claro, SP, Brazil. Phone: +55(19) 3526-9475 – E-mail: g [email protected]
INTRODUCTION
The geological complexity of hydrocarbon fields at the rift sec-tion of Campos and Santos basins mainly in carbonate reservoirs has been attracted the attention of specialists and directed studies efforts for carbonate reservoirs formed by coquinas. The under-standing of the reservoir porosity and of the geometric behavior of its permo-porous system represents a challenge in a reservoir analysis, even when analyzed as an analogue case.
To better define the heterogeneity of these reservoirs, it is proposed a method of a qualitative and quantitative analysis to characterize the regional distribution of the main physical proper-ties in carbonate reservoirs. This research is based only on geo-physical methods such as seismic attributes analysis and calcu-lation of main physical properties from well log data. The applied method uses seismic attributes computed from seismic data and its correlation with the petrophysical properties such as porosity. The use of seismic attributes to predict lithology and petro-physical properties in hydrocarbon reservoirs is widely applied since their introduction in the early 1970s. Over the years several methodologies have been developed for their application and it comes to help the reservoir characterization practice and decision making. The attribute is derived of a basic seismic measurement that is time, amplitude, frequency and attenuation (Brown,1996). The amplitude-derived attributes could provide reservoir informa-tion as well as frequency-derived attributes. Several authors (e.g. Chopra & Marfurt, 2007; 2008; and Raef et al., 2016) have re-ported on the use of seismic attribute in the characterization of hydrocarbon reservoir. Vincentelli et al. (2014) is one of the most recent work in the area that also use the data from the Brasilian marginal basin as a case and have applied a volumetric seismic at-tribute of sweetness for albians carbonate reservoirs and obtained a very useful tool that helps lighted reservoir’s limestone geometry with less uncertainty. This leads into some other recent work in the area, Nascimento & Vincentelli (2015) that sucessfully applied a metodology using seismic attributes as well and well log analisys to evaluate qualitatively and quantitatively the presence of carbon-ate rock reservoirs at Garoupa field. This study presents a syner-gistic approach integrating by crossploting the seismic attributes with the physical properties measured in the well logs. This is one of the most visually display to show a relation between these two variables. The attribute maps, as an analytical tool, may provide the spatial geometry of the reservoir properties distribution with reliable statistics and high confidence on the interpretation.
The geological settings of the area show carbonate reser-voirs formed by coquinas of Upper Barremian – Lower Ap-tian ages, that belong to the Coqueiros Formation of the Lagoa Feia Group, which represent major discoveries of hydrocarbon-producing fields in the 70s (Baumgartem et al., 1988).
Coquinas reservoirs have been studied for more than four decades of oil exploitation, and a natural decline in the produc-tion was observed in these Aptian reservoirs at Campos Basin. However, lately, the scientific effort to understand the carbon-ate reservoirs distribution on coquinas reservoir has increased again, especially after the Santos Basin discoveries and its eco-nomic importance.
The goal is to define the distribution of physical properties associated to porosity in carbonate reservoirs, formed by co-quinas deposits (rudstones and grainstones of bivalve molluscs) applying geophysical analysis of the carbonate sequence (rift section) in the Southwestern of Campos Basin. The application of this method intended to help geoscientists to define potential reservoir levels and the geometry of the permo-porous system at carbonate stratigraphic levels as coquinas deposits. This analysis considers the main physical properties that characterize reservoir stratigraphic levels (e.g. density and gamma ray) and its control factors (e.g. porosity and permeability) to understand the geo-metrical distribution of its permo-porous system, using seismic attributes maps.
GEOLOGICAL SETTINGS
Lagoa Feia Group: Focus on Shallow Portion of South-west of the Campos Basin
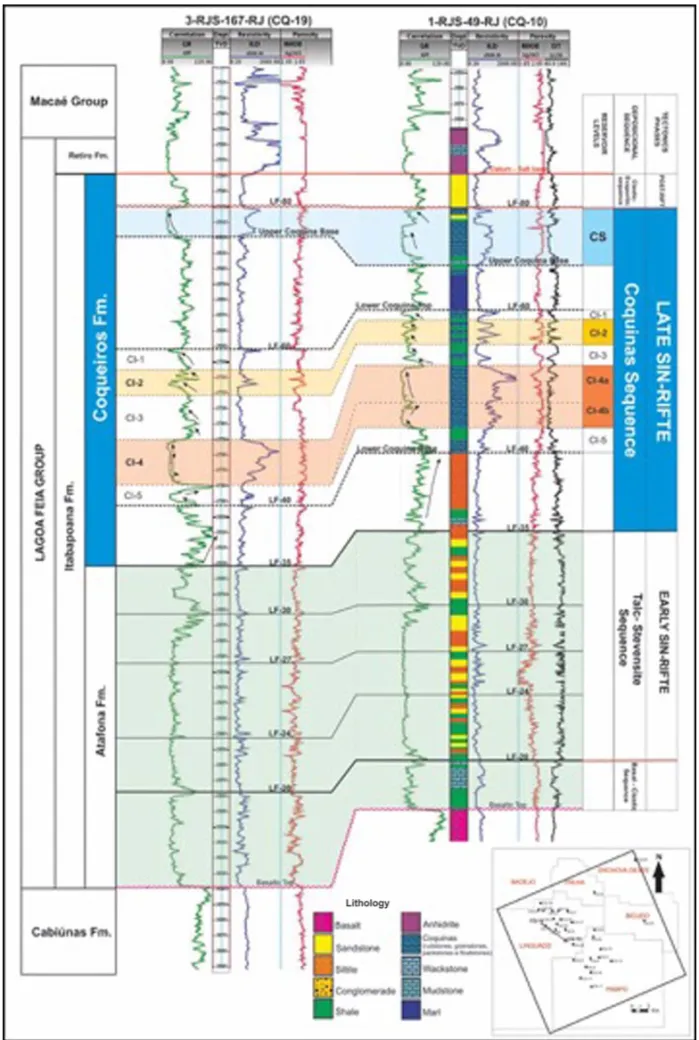
The sedimentary rocks of Lagoa Feia Group are distributed along the Campos Basin, showing a larger thickness inside the grabens and semi-grabens structures formed by the tectonic events of the rift phase. The stratigraphic framework is limited by four deposi-tional sequences, first defined by Dias et al. (1988) (Fig. 1). The limits of these four depositional sequences were based on well log correlation and on seismic-stratigraphic analysis. In summary, they are: Basal Clastic, Talc-Stevensitic, Coquinas and Clastic-Evaporitic sequences.
The stratigraphic top and base, associated with each one of these depositional sequences, are interpreted as unconformities or stratigraphic marks, which represent correlative conformities. This sequence has been described primarily from well log anal-ysis by Baumgartem (1985), defining nine stratigraphic marks (Lagoa Feia – LF) along Lagoa Feia Group interval. The definition of those stratigraphic marks, according to Baumgartem (1985), was made through the stratigraphic analysis of the depositional cycles, based on the gamma ray and sonic logs interpretation (Fig. 1).
The Coquinas Sequence is limited at the top by evaporite deposits and comprises the carbonate sediments of Coqueiros
i i
“main” — 2018/9/5 — 11:49 — page 125 — #3
i i
ROSA MC & VINCENTELLI MGC
125
Figure 1 – Typical well logs for Lagoa Feia Group with the depositional sequences. All sequences are limited by stratigraphic marks or unconformity. The top of
the Coquinas Sequence is marked by the regional Pre-Neo-Alagoas unconformity (LF-80). Datum: LF-85 (base of evaporite section). Recognition of the depositional sequences of Dias et al. (1988), from the identification of Baumgarten (1985) marks and reservoir levels proposed by Rosa (2016).
Formation, focus of this research. This stratigraphic sequence, based on the well logs responses, was divided in two main se-quences of coquinas. The Upper Barremian – Lower Aptian Co-quinas Sequence has, in the lower portion of the sequence, a pelitic stratus (Jiqui´a Fm.), that is considered one of the source rocks of the Campos Basin and two carbonate units (Upper Coquina and Lower Coquina), comprising the reservoir rocks (rudstones, grainstones and bioclastic packstones, predomi-nantly composed by bivalves).
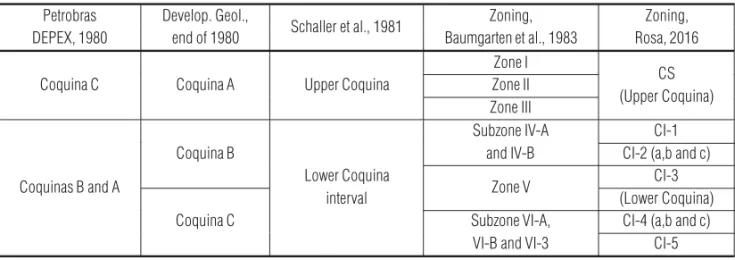
Rosa (2016) defines the presence of at least three main reser-voir levels based on stratigraphic analysis with well log in the studied area. That work establishes a reservoir level zoning for Upper Coquina (CS) and Lower Coquina (CI) as illustrated by the Figure 1 and Table 1.
A detailed analysis of the Coquina’s Sequence performed by Rosa (2016) proposes a new reservoir level zoning. Following the Baumgartem et al. (1988) the Coquinas Sequence reservoir zonation was first divided into Coquinas A, B and C. Also in the 1980s, Baumgartem et al. (1988) presented the existence of a subdivision that separated the region between the two main co-quinas strata seeking a more detailed first interpretation. A re-port of Baumgartem et al. (1983) described in Baumgartem et al. (1988) defines six production zones (Table 1), based mainly on the stratigraphic analysis of well profiles focusing on the iden-tification of levels of poor reservoir qualities or no-reservoir from the high potential reservoir levels (Table 1).
LOCATION AREA AND DATASET
The area is located 80 km from Rio de Janeiro coast, with 110 m water depth in the Southwest of the Campos Basin covering the Linguado and Pampo oil fields (Fig. 2a).
The research was based on a dataset that corresponds to a 3D seismic amplitude volume, with about 500 km2of area and
30 wells with gamma ray (GR), resistivity (ILD), density (RHOB), neutron (NPHI) and sonic (DT) log information. The data location are shown in Figure 2b.
METHODOLOGY
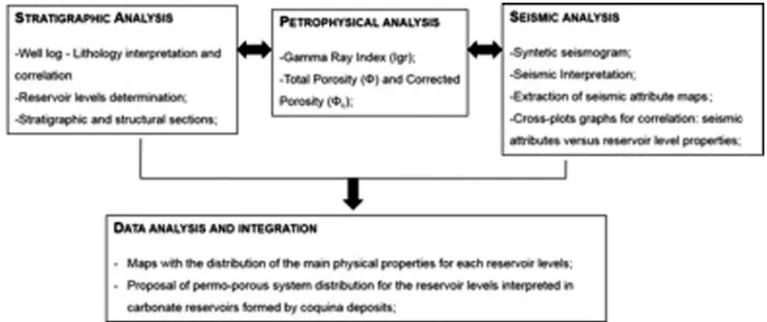
The applied methods focus on the use of seismic attributes maps as a tool to help to identify physical properties on carbonate reser-voir formed by coquinas. To achieve this objective, three steps were defined to apply based on stratigraphic, petrophysical and seismic analysis. The analyses and output were combined to de-fine best results in establishing a permo-porous reservoir system as illustrated in the workflow on Figure 3.
The stratigraphic analysis was based on well correlation of the stratigraphic marks and reservoir levels identified from petro-physical interpretation, basically from Gamma Ray, Resistivity, Density and Neutron logs. A set of lithotypes were interpreted using information from petrophysical interpretation and prior ref-erences (Muniz, 2013; Bizzoto, 2014). This analysis allowed the subdivision of the two main coquina carbonate strata where the reservoir levels of this research are located.
The information about stratigraphic analysis, such as strati-graphic marks and reservoir levels (top and base), obtained in well scale, defined each well mark that should be transferred to time domain using time-depth curves and plotted in the 3D seismic data based on time. The well data have a high vertical resolution but a limited number of wells available and the seismic data have a limited vertical resolution, due to that, an interpolation between the wells information and seismic data was obtained by seismic interpretation. This is a very common seismic analysis practice that allows obtaining a respective seismic horizon which
repre-Table 1 – Evolution of the reservoir zonation of the Coquina’s Sequence of the Lagoa Feia Group. Source: Adapted from Baumgartem et al. (1988). Petrobras Develop. Geol.,
Schaller et al., 1981 Zoning, Zoning,
DEPEX, 1980 end of 1980 Baumgarten et al., 1983 Rosa, 2016
Zone I
CS
Coquina C Coquina A Upper Coquina Zone II
(Upper Coquina) Zone III
Coquinas B and A
Coquina B
Lower Coquina
Subzone IV-A CI-1
interval
and IV-B CI-2 (a,b and c)
Coquina C
Zone V CI-3
(Lower Coquina) Subzone VI-A, CI-4 (a,b and c)
i i
“main” — 2018/9/5 — 11:49 — page 127 — #5
i i
ROSA MC & VINCENTELLI MGC
127
Figure 2 – (a) Location map indicating the application area; (b) Map with the 3D seismic limits, well location and the license blocks map of production fields at the
southwest portion of Campos Basin.
Figure 3 – Workflow with the methods steps applied on this research. The top row shows the main input for the analysis and the lower row shows the
output of this work.
sents a time-structure map of a stratigraphic mark or reservoir level (top and base) and envelop seismic amplitude information in a structural framework.
The petrophysical analysis was based on the information de-rived from the well log data listed above to estimate properties as Gamma Ray Index (Igr), Total Porosity (φ) and Corrected porosity (φc), using well logs of fourteen wells distributed in the research area. This analysis was key to estimate the porosities on each one of the reservoir levels and were used mainly to correlate with the attribute maps.
The applied methodology uses the sweetness seismic at-tributes. The sweetness attribute is computed using the seismic volume of amplitude and represents, mathematically, the instan-taneous amplitude divided by the square root of instaninstan-taneous frequency. This attribute is used here to show an enhancement of contrast between the areas having subtly different physical properties responses and already showed good responses when applied in volumetric interpretations for carbonate reservoirs as Vincentelli et al. (2014) demonstrated in a previous publication. In this paper, the sweetness attribute is applicable to the
charac-terization of geological features that shows changes in the rock density over the surrounding rocks.
All the attribute maps were computed by measuring the time instance and over a time window of 5 ms on a surface that rep-resents the pseudo structural map (structural map in time) of the reservoir level and then, they were correlated to the petrophysical properties using cross-plot graphs. The seismic attribute anal-ysis allows a quantitative correlation for each defined reservoir level and determines which physical properties are represented at the amplitude data and sweetness cube. The amplitude extrac-tion over the seismic horizons revealed features directly related to stratigraphic events. The amplitude attributes are used to inter-polate/extrapolate reservoir properties from well control.
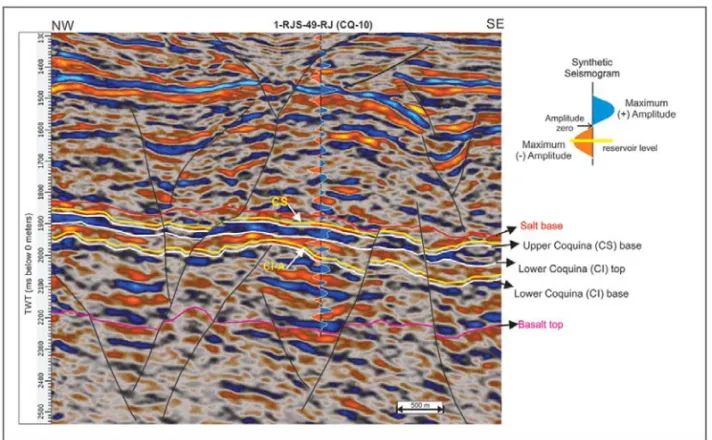
Figure 4 – Profile of the 1-RJS-49-RJ well with indication of the reservoir levels
in Lower Coquina (CI) and Upper Coquina (CS) proposed by Rosa (2016) and its correspondence with the levels treated in this research. (Source: Adapted from Rosa (2016)).
APPLICATION OF THE METHODS Stratigraphic analisys
The focus of this paper is the two main reservoir levels defined by Rosa (2016): the reservoir level of Lower Coquina (CI-4) here is named as Lower Coquina A (CI-A) and the reservoir level Upper Coquina (CS) (Fig. 4).
The CI-A represents the larger and thicker reservoir level (30 to 120 m) from well log analysis. It occurs as a reservoir level near the base of the Lower Coquina stratus. The Gamma Ray log shows a pattern of inverted bell-shaped geometry that represent shallowing-upward cycles characterized by mudstones and wack-stones in the base grading to packwack-stones and grainwack-stones in the intermediate portion and rudstones with calcarenitic matrix and pure rudstones in the top as described in petrographic work of Bizotto (2014). The other pattern observed on the CI-A is the box-shaped geometry that represents aggrading cycles associ-ated with amalgam layers of bioclastic rudstones up to 60m thick as also confirmed by petrographic description of Bizotto (2014). The Gamma Ray patterns, in some levels of shallowing-upward cycles, could be associated with abrupt increases and decreases in energy during the deposition of these deposits (Muniz, 2013). In the CS, the Gamma Ray log is an inverted bell-shaped pattern again, representing shallowing-upward cycles, mainly in the base and a box-shaped patterns is observed at the intermedi-ate portion as an aggrading cycle up to 10 meters thickness. The top of this reservoir level represents a Pre-Upper-Alagoas regional unconformity in Baumgartem (1985) and also represent the top of the Coquinas Sequence.
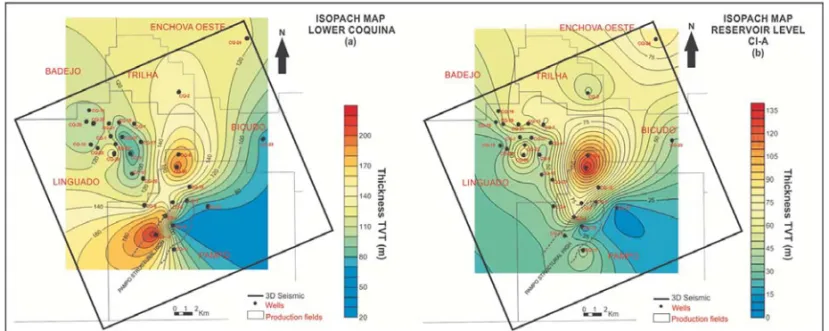
The isopach maps on the Figures 5 and 7 was built with the interpolation of well data. Analyzing the isopach maps, the Lower Coquina stratus presents a distribution with the greatest thick-ness (>130 m) at the central and Northern part of the isopach map (Fig. 5a), mainly between the Linguado and Pampo field. The CI-A has its higher thicknesses associated to the Campos base-ment lows and the normal faults system (Fig. 6), following the trend of Lower Coquina stratus at the isopach map (Fig. 5b). The Lower Coquina stratus is thinner at the Pampo Structural High, with 15m to 25 m thick (Fig. 5b).
The reservoir level of Upper Coquina (CS) is homogeneously distributed along the well correlation section, with a small thick-ness to the Southeast (∼10 meters less) (Fig. 6). The CS is not all deformed by normal faults of rift phase, and its distribution shows little evidence that it is conditioned by basement highs and lows. The isopach map of CS (Fig. 7) shows that the sedi-ment decreases from North to South, and from West-Southwest
i i
“main” — 2018/9/5 — 11:49 — page 129 — #7
i i
ROSA MC & VINCENTELLI MGC
129
Figure 5 – Isopach map of Lower Coquina stratus (a) and reservoir level CI-A (b).
to East-Northeast. One more observation about the thickness distribution of CS is the regional progressive decrease from West-Southwest to East-Northeast, showing a distribution and sedimentation following the regional edge of the basin, which confirms no longer significant tectono-structural interference during this process.
Petrophysical analysis
According to the Gamma Ray logs the high values measured are the responses of the occurrence of some thin beds of siliciclastics and low energy carbonate facies (wackstones and mudstones). In the Bizotto (2014) the petrographic analysis of the cores in the coquinas beds of Lagoa Feia Group confirm the presence of thin beds of low energy carbonate facies inside this reservoir levels. These thin beds act as barriers to permeability to verti-cal flow compartmentalizing the reservoir in sub levels and justify the estimation of Gamma Ray Index (Igr).
The Total Porosity (φt) was estimated from RHOB log and Igr was used to compensate theφt and compute the Corrected Porosity (φc). The φc should be the more approximate estimation, using only well log information, to the effective porosity for each reservoir level. This porosity estimation would be adopted here for considering representing the best reservoir permo-porous quality system. As observed in Table 2, for this paper theφc was chosen for analysis.
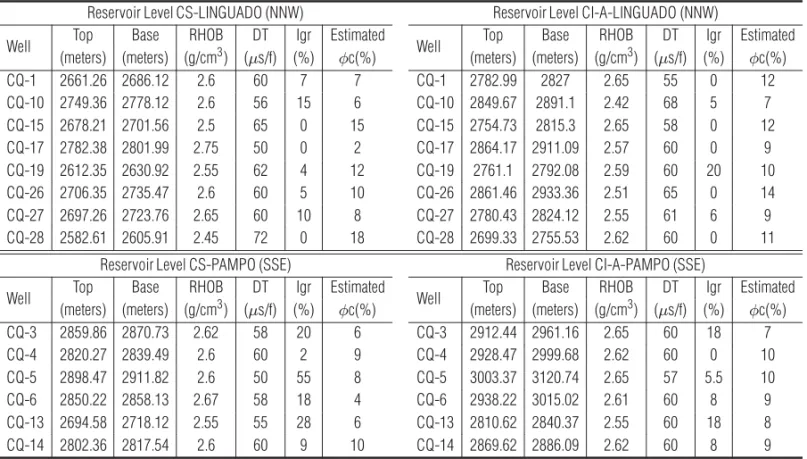
The Table 2 contain the information for both reservoir level analyzed in this paper that include mode values of RHOB, DT, Igr and estimated φc obtained for the wells in the Northwest (Linguado field) and in the Southeast (Pampo field) of the studied area.
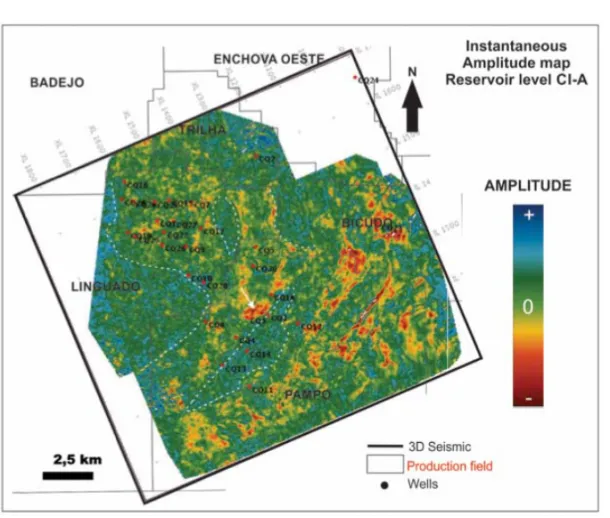
Isoproperty maps to illustrate the Igr andφc distribution in CI-A and CS were created from interpolation of well data using minimum curvature (Fig. 8a). The map shows a detailed analy-sis of the CI-A level distribution with low Igr values in the whole middle area. The middle area at the map (Fig. 8a) also correspond the occurrence to the thickest coquina stratus as showed by the isopach map. The Igr map to the CI-A shows the small impact of the siliciclastic and low energy carbonate layers, interpreted on well profile and reported in core description data, for this reser-voir level (Fig. 8a). A very analogous situation is observed at CS level (Fig. 8b) however, the Igr values are higher than for the CI-A. The map of porosity from interpolation of well data, for the CI-A and CS are present at Figure 9. These maps show a trend that decreases porosity to South and Southeast, an inverse trend when showed at the Igr maps. The CI-A level presents values of porosity above 6% in almost the whole area, whereas for the CS level the porosities are below 5% in the central and Eastern portions.
Seismic analysis
The interpretation of Lower Coquina (top and base) was the ref-erence to extract a representative horizon with –10 ms shift from the base to represent the CI-A level (Fig. 10).
In the case of CS level, it was calculated with –10 ms shift from the base of the Upper Coquina horizon. This procedure also allows the CS level to be represented in the seismic attributes.
The best responses obtained for the seismic attribute maps were extracted from amplitude and sweetness seismic vol-umes using a window of 5ms above and below each pseudo-structural horizon. The best anomaly responses were related to
i i
“main” — 2018/9/5 — 11:49 — page 131 — #9
i i
ROSA MC & VINCENTELLI MGC
131
Figure 7 – Isopach map of reservoir level CS.
Table 2 – Reservoir level information per well separated by level and area. Top row with the Northwest data (Linguado field) and the lower row with the Southeast
data (Pampo field).
Reservoir Level CS-LINGUADO (NNW) Reservoir Level CI-A-LINGUADO (NNW)
Well Top Base RHOB DT Igr Estimated Well Top Base RHOB DT Igr Estimated
(meters) (meters) (g/cm3) (μs/f) (%) φc(%) (meters) (meters) (g/cm3) (μs/f) (%) φc(%)
CQ-1 2661.26 2686.12 2.6 60 7 7 CQ-1 2782.99 2827 2.65 55 0 12 CQ-10 2749.36 2778.12 2.6 56 15 6 CQ-10 2849.67 2891.1 2.42 68 5 7 CQ-15 2678.21 2701.56 2.5 65 0 15 CQ-15 2754.73 2815.3 2.65 58 0 12 CQ-17 2782.38 2801.99 2.75 50 0 2 CQ-17 2864.17 2911.09 2.57 60 0 9 CQ-19 2612.35 2630.92 2.55 62 4 12 CQ-19 2761.1 2792.08 2.59 60 20 10 CQ-26 2706.35 2735.47 2.6 60 5 10 CQ-26 2861.46 2933.36 2.51 65 0 14 CQ-27 2697.26 2723.76 2.65 60 10 8 CQ-27 2780.43 2824.12 2.55 61 6 9 CQ-28 2582.61 2605.91 2.45 72 0 18 CQ-28 2699.33 2755.53 2.62 60 0 11
Reservoir Level CS-PAMPO (SSE) Reservoir Level CI-A-PAMPO (SSE)
Well Top Base RHOB DT Igr Estimated Well Top Base RHOB DT Igr Estimated
(meters) (meters) (g/cm3) (μs/f) (%) φc(%) (meters) (meters) (g/cm3) (μs/f) (%) φc(%)
CQ-3 2859.86 2870.73 2.62 58 20 6 CQ-3 2912.44 2961.16 2.65 60 18 7 CQ-4 2820.27 2839.49 2.6 60 2 9 CQ-4 2928.47 2999.68 2.62 60 0 10 CQ-5 2898.47 2911.82 2.6 50 55 8 CQ-5 3003.37 3120.74 2.65 57 5.5 10 CQ-6 2850.22 2858.13 2.67 58 18 4 CQ-6 2938.22 3015.02 2.61 60 8 9 CQ-13 2694.58 2718.12 2.55 55 28 6 CQ-13 2810.62 2840.37 2.55 60 18 8 CQ-14 2802.36 2817.54 2.6 60 9 10 CQ-14 2869.62 2886.09 2.62 60 8 9
Figure 8 – Isoproperty map of Igr in the reservoir level (a) CI-A and (b) CS.
Figure 9 – Isoproperty map ofφc in the reservoir level (a) CI-A and (b) CS.
the instantaneous amplitude, average amplitude, RMS amplitude and RMS sweetness attribute maps. The seismic attribute maps are illustrated by the Figures 12, 14 and 16.
Seismic attribute analysis
Density and sonic velocity, from well data shows high correla-tion index with the seismic amplitude map, for both CI-A and CS levels. The seismic amplitude is correlated with reservoir prop-erties because it has strong effect on both velocity and density changes on the surrounding rocks as shows the plots on Fig-ure 11. The seismic attribute are measFig-urements of geometric, kinematic, dynamic, or statistical features derived from seismic data and can be used to revealing subsurface anomalies.
The CI-A level, which is the largest and most expressive reservoir interval in the Lower Coquina stratus, the correlation coefficient between the rock property and seismic are: R2≥0.82
for RHOB and R2≥0,76 for DT, as illustrated in the graphs of
Figure 11 and map of Figure 12. The higher negative instanta-neous amplitude is correlate to the increase density values and decrease sonic velocity values.
The plots in the Figure 13 shows a linear correlation re-sponse of amplitude with density (R2≥0.75) and sonic velocity
(R2=0.79) for the CS reservoir level. In the Figure 14 the
in-stantaneous amplitude attribute map shows a correlation between low negative amplitude values and low densities values measured for CS level.
i i
“main” — 2018/9/5 — 11:49 — page 133 — #11
i i
ROSA MC & VINCENTELLI MGC
133
Figure 10 – Seismic section NW-SE with the well 1-RJS-49-RJ (CQ-10) showing the synthetic seismogram and horizons.
(a) (b)
Figure 11 – Cross-plot graphs showing the correlation between the seismic amplitude attribute and the physical properties of
(a) density (RHOB) and (b) Sonic velocity (DT) for the reservoir level CI-A.
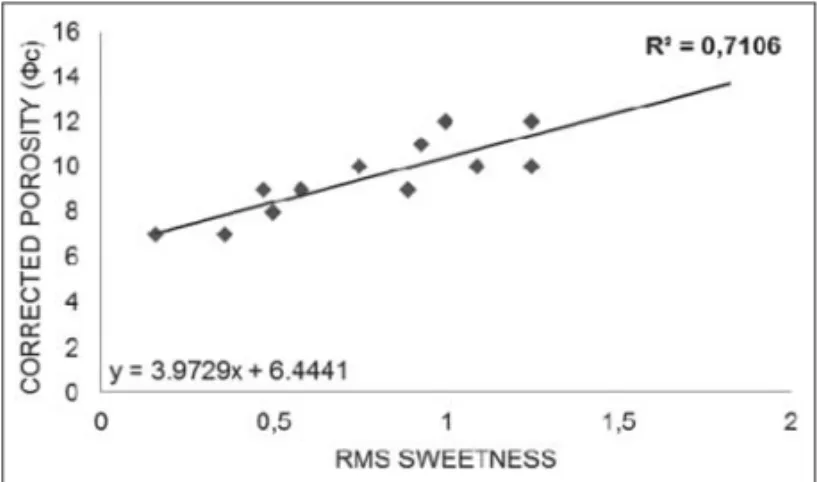
A sweetness attribute volume was generated based on the amplitude cube and a RMS (Root Mean Square) map was se-lected from the time-structure horizon, which reflect the charac-teristics for the reservoir level CI-A. The RMS sweetness map of CI-A shows a correlation (R2≥0.71) between attribute and φc, as
illustrated in the graph of Figure 15. It shows that the higherφc are at Northwest and at Southeast of the area (Fig. 16).
RESULTS
Petrophysical Properties Distributions and Permo-Porous System Configuration
Reservoir Level Lower Coquina A (CI-A)
The reservoir CI-A is considered the main producer level in the Northwest portion of the study area, and it is also the most basal
reservoir level in the Coquinas Sequence. Its porosity estimation values are between 3% and 17% and it was considered the cor-relation between theφc and the seismic attributes when the cor-relation coefficient is above R2≥0.7.
The analysis of the correlation between theφc and the seis-mic attribute maps, a correlation coefficient of R2=0.90 was
ob-tained for the Mean amplitude map (Fig. 17). A pseudo poros-ity map was computed with a linear regression process, using a linear function derived from the cross-plot showed at Figure 17. The Figure 18 shows the resulting pseudo porosity map over the CI-A time-structure map.
The distribution of pseudo-porosity over the reservoir level CI-A, according to the map of the Figure 18, shows values above 6% and limited by faults structures with NE-SW and NNW-SSE
Figure 12 – Amplitude attribute map for reservoir level CI-A.
(a) (b)
Figure 13 – Cross-plot graphs showing the correlation between the seismic amplitude attribute and the physical properties of (a) density
(RHOB) and (b) Sonic (DT) for the reservoir level CS.
trend direction. Just after the main faults, the pseudo-porosity val-ues change abruptly and following the fault tracing. The pseudo-porosity at the Northwest portion, is quite homogenous and has a trend of high porosity values with N-S direction. In the central and Southeastern part of the area, the pseudo-porosity follows the NE-SW structural trend, with porosity values around 20%. The NE-SW trend with the highest porosity from 8% to 20% are con-strained by faults, with this highest value occurring at the edges of the faults and decreasing as they are in the top of the structures. On the Structural High of Pampo the porosity values are up to 6%. The analysis of the pseudo-porosity map for the CI-A shows
a high correlation with the tectonic structure. The best porosi-ties following the main NW-SE trend. The deposition is an im-portant conditioner of quality of the permo-porous system quality at this reservoir level. Tectonic activities had provided sedimen-tary accommodation spaces and barriers that had affected the for-mation of high energy facies, accumulation, rework and conse-quently creation and preservation of the best conditions for the reservoirs. Other factors are also considered active for the qual-ity of the permo-porous system, such as the dissolution of pores and shells by meteoric water as stated by Castro (2006). The ex-istence of faults and fractures, enhance the percolation of fluids
i i
“main” — 2018/9/5 — 11:49 — page 135 — #13
i i
ROSA MC & VINCENTELLI MGC
135
Figure 14 – Amplitude attribute map for reservoir level CS.
Figure 15 – Cross-plot graphs of RMS Sweetness attribute versus porosity (φc) for the reservoir level CI-A.
during the deposition, as a relevant diagenetic factor.
The correlation of the RMS of sweetness withφc has corre-lation of R2=0.91 over the CI-A level, as shown in Figure 15.
The RMS of sweetness map (Fig. 19) shows a pattern of the permo-porous distribution, with better porosities located at the thicker areas.
According to the RMS sweetness map of Figure 19, the best φc are at the center area and limited by NE-SW faults at East and Southeast. The lines at the Figure 19 illustrate the domains of the best reservoir qualities (best porosities).
Reservoir Level Upper Coquina (CS)
The CS reservoir level is located at the top of the Coquinas Se-quence, withφc from 3% to 17%. Using the same principle
applied at the CI-A, a linear regression was applied, based on the linear function obtained by the correlation between ampli-tude maps and φc, which has correlation coefficient R2=0.89
(Fig. 20). A pseudo-porosity map was obtained for reservoir level CS, which is illustrated in Figure 21.
The analysis of corrected porosity map over the CS level in-dicates a trend for the whole area with a decrease in porosity from Northwest to Southeast. The white areas, in the Southeast of the map of Figure 21, shows pseudo-porosity values below 3%. This pseudo-pososity value is way below the cut-off of 6% of poros-ity published at Baumgartem et al. (1988) to the Pampo field. The pseudo-porosity map (Fig. 21) shows values up to 24% with a distribution of the largest porosities (≥16%) in the Northwest, following the thicker structure at the isopach map (Fig. 7) over CS. From the map and 3D projection in Figure 21 it is possible to
Figure 16 – RMS Sweetness attribute map for reservoir level CI-A.
Figure 17 – Cross-plot showing the correlation between the seismic Mean amplitude
at-tribute and the petrophysical property of corrected porosity (φc) for the reservoir level CI-A.
observe the low influence of tectonic-structural framework in the geometric distribution of the permo-porous system. The pseudo-porosity values apparently are not very affected by the faults trend direction and decrease regionally from Northwest to Southeast. This analysis leads us to conclude that the depositional fac-tors associated to the coquina banks, such as selection and re-working of sediments, as well as diagenetic processes, were the ones that most influenced the permo-porous distribution at this reservoir level.
CONCLUSIONS
The correlation of the petrophysical properties showed corre-lations ranging from R2≥0.7 to R2≥0.92 with the seismic
at-tributes of amplitude and sweetness. The seismic attribute maps of Instantaneous amplitude, RMS amplitude and Mean amplitude for the intervals of the reservoir levels CI-A and CS, have a good correlation with the values measured in the density (RHOB) and sonic velocity (DT) logs, Porosity (φc) and Gamma Ray Index
i i
“main” — 2018/9/5 — 11:49 — page 137 — #15
i i
ROSA MC & VINCENTELLI MGC
137
Figure 18 – Pseudo-porosity map and 3D projection on the structural top of the Lower Coquina (CI) for the reservoir level CI-A.
Figure 20 – Cross-plot graph showing the correlation between the seismic attribute of Amplitude and the
petrophysical property of corrected porosity (φc) for the CS level.
Figure 21 – Pseudo-porosity map and 3D projection on the structural base of salt to the reservoir level CS.
(Igr). From the seismic attribute of sweetness, the RMS sweet-ness map has correlation with the porosity (φc) for the reservoir level CI-A. The cross-plot graph analysis shows that there is a cor-relation between a rock physical property (φc) that reflects qual-ity permo-porous system and the main property expressed in the seismic, which is the amplitude, thus allowing a reservoir level analysis based on this property.
Finally, the analysis of the distribution of the Porosity (φc) for the reservoir level CI-A shows a high effect of the tectonic framework in the distribution of porosity, when compared to the CS level, with the highest porosities following the main structures
with NE-SW direction. The pseudo-porosity map shows the high-est porosities following the NE-SW direction, which is also the main direction of thicker coquina deposits and this can be ex-pressed with the seismic attributes analyzed here. These combi-nations of depositional and tectono-structural factors are impor-tant for the definition of the quality of the permo-porous at CI-A.
The pseudo-porosity map for the CS was obtained with the amplitude attribute map and shows that there was no influence of tectonic-structural on the permo-porous system of this reservoir level, as in the distribution of its thicknesses. The pseudo-porosity over CS shows a more homogeneously distribution of porosity
i i
“main” — 2018/9/5 — 11:49 — page 139 — #17
i i
ROSA MC & VINCENTELLI MGC
139
and reduce its value in a South-Southeast trend following the decreases of presence of coquina deposits to Southeast.
ACKNOWLEDGEMENTS
The authors want to thank the Graduate Program in Geociˆencias e Meio Ambiente (UNESP) and Nacional Counsel of Technolog-ical and Scientific Development (CNPq) for the master research fellowship. The Laboratory of Geological and Seismic Data Inter-pretation (LISG) for the logistical support. The Banco de Dados de Explorac¸˜ao e Produc¸˜ao (BDEP) of Agˆencia Nacional do Petr´oleo, G´as Natural e Biocombust´ıveis (ANP) for the whole dataset. The Halliburton/Landmark for providing academic licenses of the DSG (Decision Space *Geoscience) software and Schlumberger for providing academic licenses of the Techlog* software. This research was developed on UNESPetro, Center Petroleum Geo-science, IGCE, Rio Claro, S˜ao Paulo, Brazil.
REFERENCES
BAUMGARTEN CS. 1985. Evoluc¸˜ao estrutural de Pampo, Badejo e Lin-guado durante a deposic¸˜ao da Formac¸˜ao Lagoa Feia. Boletim T´ecnico da Petrobras, 28(2): 91–101.
BAUMGARTEN CS, DULTRA AJC & CARVALHO MD. 1983. Zoneamento do intervalo de coquinas Lagoa Feia em Pampo, Linguado e Badejo. Rio de Janeiro, PETROBRAS. DEPEX (Tech. Note). Not publish.
BAUMGARTEM CS, DULTA AJC, SCUTA MS, FIGUEIREDO MVL & SEQUEIRA MF PB. 1988. Coquinas da Formac¸˜ao Lagoa Feia, Bacia de Campos: Evoluc¸˜ao da Geologia de Desenvolvimento. Boletim de Geociˆencias da Petrobras, 2(1): 27–36.
BIZOTTO AC. 2014. Coquinas eoaptianas do sudoeste da Bacia de Cam-pos: f´acies deposicionais, eventos diagen´eticos e fatores controladores do reservat´orio. Master Dissertation – UNESP, Rio Claro, SP, Brazil. 150 pp.
BROWN AR. 1996. Seismic atributes and their classification. The Leading Edge, 15(10): 1090.
CASTRO JC. 2006. Evoluc¸˜ao dos conhecimentos sobre as coquinas-reservat´orio da Formac¸˜ao Lagoa Feia no Trend Badejo-Linguado-Pampo, Bacia de Campos. Revista Geociˆencias, 25: 175–186.
CHOPRA S & MARFURT K. 2008. Seismic Attributes for Stratigraphic Characterization. In: AAPG GeoConvention, May 12–15.
CHOPRA S & MARFURT K. 2007. Seismic attributes for prospect identi-fication and reservoir characterization. SEG Geophysical Developments Series; No. 11. 481 pp.
DEPEX-PETROBRAS. 1980. Equipe do setor da Bacia de Campos. O Campo de Pampo e´areas adjacentes (resultados explorat´orios). Relat´orio de progresso. Rio de Janeiro, Brazil, 1980. Not publish.
DIAS JL, OLIVEIRA JQ & VIEIRA JC. 1988. Sedimentological and Strati-graphic analysis of the Lagoa Feia Formation, Rift phase of Campos Basin, Offshore Brazil. Revista Brasileira de Geociˆencias, 18(3): 252– 260.
MUNIZ MC. 2013. Tectono-Stratigraphic evolution of the Barremian-Aptian Continetal Rift Carbonates in Southern Campos Basin, Brazil. Doctorate thesis – Royal Holloway University of London, London, UK, 343 pp.
NASCIMENTO LF & VINCENTELLI MGC. 2015. Caracterizac¸˜ao geof´ısica dos reservat´orios dos Grupo Maca´e no Campo de Garoupa – Bacia de Campos. Geociˆencias, 34(2): 185–198.
RAEF AE, MEEK TN & TOTTEN MW. 2016. Application of 3D seis-mic attribute analysis in hydrocarbon prospect identification and eval-uation: Verification and validation based on fluvial palaeochannel cross-sectional geometry and sinuosity, Ness County, Kansas, USA. Marine and Petroleum Geology, (73): 21–35.
ROSA MC. 2016. An´alise Geol´ogico-Geof´ısica de reservat´orios car-bon´aticos neobarremiano-eoaptianos da Sequˆencia das Coquinas, For-mac¸˜ao Coqueiros, Grupo Lagoa Feia, sudoeste da Bacia de Campos. Master Dissertation – UNESP, Rio Claro, SP, Brazil, 187 pp.
SCHALLER H et al. 1981. Estudo preliminar dos reservat´orios da Formac¸˜ao Lagoa Feia; ´area de Badejo/Pampo, Bacia de Campos. Rio de Janeiro, Brazil, PETROBRAS. DEPEX, 1981. Not publish.
VINCENTELLI MGC, CONTRERAS SAC & CHAVES MU. 2014. Geo-physical characterization of Albian carbonates reservoirs in Brazilian basins: the sweetness as a tool for carbonate reservoirs definition. Brazilian Journal of Geophysics, 32(4): 695–705.
Recebido em 18 janeiro, 2017 / Aceito em 25 agosto, 2017 Received on January 18, 2017 / Accepted on August 25, 2017