Mauro Guilherme Augusto Luís
Bachelor of Science in Chemical and Biochemical Engineering
Development of Principle Culture
Medium Formulations for Chinese
Hamster Ovary (CHO) Cells
Dissertation to obtain the degree of master in Chemical and Biochemical Engineering
Supervisor: Rui Manuel Freitas Oliveira, Associate
Professor, FCT/UNL
Co-supervisor: Nuno Eduardo Buxo Carinhas, PhD, iBET
Jury:
President: Prof. Dr. Maria da Ascensão Carvalho Fernandes Miranda Reis Examiner: Dr. Ana Margarida Palma Teixeira
Mauro Guilherme Augusto Luís
Bachelor of Science in Chemical and Biochemical Engineering
Development of Principle Culture Medium Formulations
for Chinese Hamster Ovary (CHO) Cells
Dissertation to obtain the degree of master in Chemical and Biochemical Engineering
Supervisor: Rui Manuel Freitas Oliveira, Associate Professor, FCT/UNL
Co-supervisor: Nuno Eduardo Buxo Carinhas, PhD, iBET
Jury:
President: Prof. Dr. Maria da Ascensão Carvalho Fernandes Miranda Reis Examiner: Dr. Ana Margarida Palma Teixeira
III Development of Principle Culture Medium Formulations for Chinese Hamster
Ovary (CHO) Cells
Copyright Mauro Guilherme Augusto Luís, FCT/UNL, UNL
A Faculdade de Ciências e Tecnologia e a Universidade Nova de Lisboa têm o direito,
perpétuo e sem limites geográficos, de arquivar e publicar esta dissertação através de
exemplares impressos reproduzidos em papel ou de forma digital, ou por qualquer outro
meio conhecido ou que venha a ser inventado, e de a divulgar através de repositórios
científicos e de admitir a sua cópia e distribuição com objectivos educacionais ou de
V
Acknowledgments
This thesis would not have been possible without the support of many people. In few lines I would like to express my gratitude to them.
To Prof. Dr. Rui Oliveira and Dr. Nuno Carinhas, for all the guidance, support and patient;
To all the elements of Systems Biology and Engineering group, for your fellowship;
To my family, especially my parents to whom I owe what I am today;
And at last, but not least, to Jorge, Joana and Tânia that made this journey easier.
To all of you,
VII
Abstract
Chinese hamster ovary (CHO) cells are the most widely used mammalian cell line for
the production of therapeutic proteins. To ensure their maintenance and growth in vitro, a complex combination of nutrients have to be supply through culture medium. Thus, in the last
decades, efforts have been made to develop better culture media, free of serum. However, the
methods still used for media development are too reliant on empirical knowledge and can be
expensive and time-consuming. On the other hand, the method used in this thesis relies on the
influence of the environment where a cell is inserted in its metabolic performance, i.e. metabolic
engineering by medium manipulation.
To study the different physiological states of CHO cells, a metabolic network from the
literature was adapted. In that network CHO cells produce Immunoglobulin G (IgG). Using the
Metatool 5.1, an initial set of 23240 elementary flux modes (EFMs) were calculated and then
divided into: 108 EFMs producing biomass, 16296 EFMs producing IgG, 6658 EFMs carrying
out essentially cellular respiration and 178 EFMs assumed as non-feasible.
Each group was reduced to 20 EFMs after normalization and subsequent clustering. One
medium formulation was purposed for each group of EFMs; however, since the metabolic
network had to contain transport reactions of ATP, NADH, NADPH and FADH2 in order to
allow the EFMs calculation, the individual result of each group was not realistic because, for example, it was assumed that ATP could be transported from the “exterior” and vice-versa, according to the needs of each cellular physiological state. To consider the pathways where
ATP is highly produced and those where it is required, a formulation was purposed regarding a
combination of the results from the three groups.
The application of these tools may allow media development in a faster and more
economical way.
Keywords
Cell culture media formulation; Chinese Hamster Ovary (CHO) cells; Elementary mode
IX
Resumo
As células de ovário do hamster chinês (células CHO) são a linha celular de mamífero
mais utilizadas para a produção de proteínas terapêuticas. Para garantir a sua manutenção e
crescimento in vitro, uma complexa combinação de nutrientes tem de ser fornecida através do meio de cultura. Assim, nas últimas décadas, têm sido feitos esforços para desenvolver
melhores meios de cultura, sem soro. Contudo, os métodos usados para o desenvolvimento de
meios dependem bastante do conhecimento empírico e podem ser dispendiosos em termos de
tempo e dinheiro. Por sua vez, o método utilizado nesta tese assenta na influência do ambiente
onde uma célula está inserida no seu desempenho metabólico, i.e. engenharia metabólica através
de manipulação do meio.
Para estudar os diferentes estados fisiológicos das células CHO, uma rede metabólica
publicada foi adaptada. Nessa rede as células CHO produzem Imunoglobulina G (IgG). Usando
o Metatool 5.1, obteve-se um conjunto inicial de 23240 modos de fluxo elementares (MFEs)
posteriormente dividido em: 108 MFEs que produzem biomassa, 16296 MFEs que produzem
IgG, 6658 MFEs que desempenham essencialmente respiração celular e 178 MFEs que foram
assumidos como não viáveis.
Cada grupo foi reduzido a 20 MFEs após normalização e agrupamento de dados. Para
cada conjunto foi proposta uma formulação de meio; mas, como foi necessário acrescentar à
rede metabólica equações de transporte para ATP, NADH, NADPH e FADH2 de forma a
permitir o cálculo dos MFEs, o resultado individual de cada grupo não é realístico pois assume que, por exemplo, o ATP pode ser transportado do “exterior” e vice-versa consoante as necessidades de cada estado celular. Para considerar os caminhos metabólicos em que o ATP é
altamente produzido e aqueles onde é utilizado, foi proposta uma formulação resultante da
combinação das três iniciais.
A utilização deste método pode assim permitir o desenvolvimento de meios de cultura
de uma forma mais rápida e económica.
Palavras-chave
Formulação de meios de cultura celular; Células de ovário do hamster chinês (células CHO);
XI
Contents
Acknowledgments ... V
Abstract ... VII
Resumo...IX
List of Figures... XIII
List of Tables ... XV
List of abbreviations ... XVII
1. Introduction ... 1
1.1. Media Development... 1
1.1.1. Main media components ... 2
1.1.2. Previous studies and media formulations ... 4
1.2. Metabolic modelling of bioprocesses ... 5
1.2.1. Theory behind metabolic network analysis ... 6
1.2.2. Approaches ... 6
1.3. Objectives ... 8
2. Materials and methods ... 11
2.1. Metabolic network ... 11
2.2. Elementary mode analysis ... 13
2.3. Data normalization and clustering ... 13
2.4. Medium formulation ... 14
2.5. Experimental data ... 16
2.6. Cost estimate ... 16
3. Results and Discussion ... 19
3.1. Elementary mode analysis ... 19
3.2. Biomass production ... 20
3.3. IgG production ... 25
3.4. CO2 production / Cellular respiration ... 29
XII
3.6. Medium formulation ... 34
4. Conclusion ... 37
5. References ... 39
6. Appendices ... 43
6.1. Appendix A ... 43
6.2. Appendix B ... 47
XIII
List of Figures
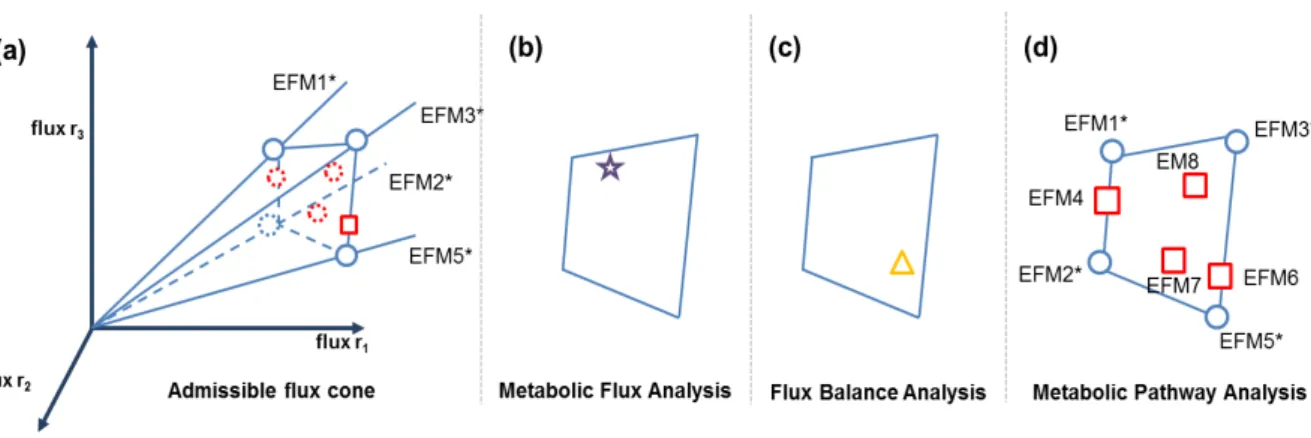
Figure 1.1 – Geometric interpretation of a metabolic network analysis. (a) All possible flux
distributions of a metabolic network lie within the admissible flux cone. Each axis corresponds
to the flux through a given reaction. The edges of the cone are represented by the extreme
pathways (represented by and by the elementary flux modes marked with an asterisk). (b)
Metabolic Flux Analysis identifies only a combination of fluxes that lies anywhere in the cone (); (c) as well as Flux Balance Analysis that represents only a combination of fluxes that lies also anywhere in the cone () and satisfies the defined objective function. (d) The remaining elementary flux modes lie on the face and inside the cone (). Adapted from [17]. ... 8
Figure 2.1 - Metabolic network of CHO cells (adapted from [29]). Nucleotide synthesis, lipid
synthesis, IgG glycosylation and transport reactions were omitted. Metabolites marked in red
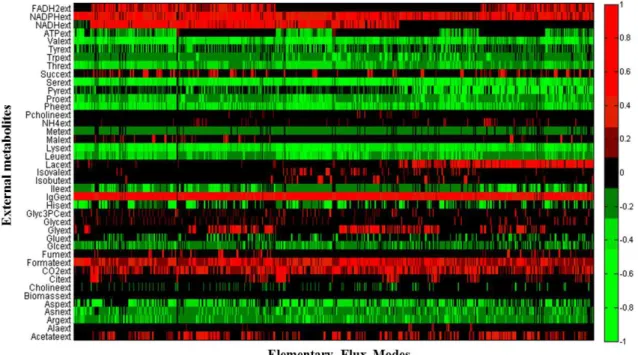
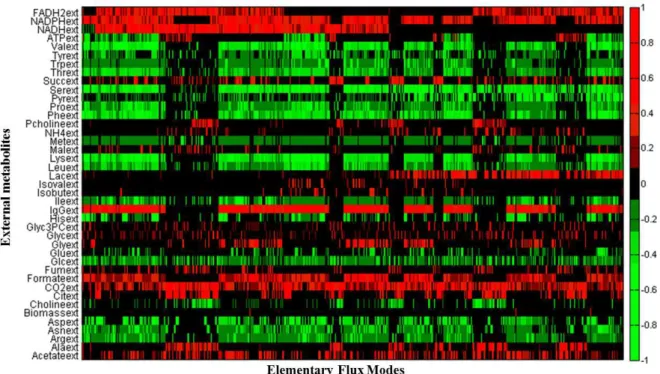
were implemented as external. ... 12 Figure 3.1 – Heat map of all EFMs initially obtained (normalized data). Metabolites in green are consumed and in red are produced. ... 19
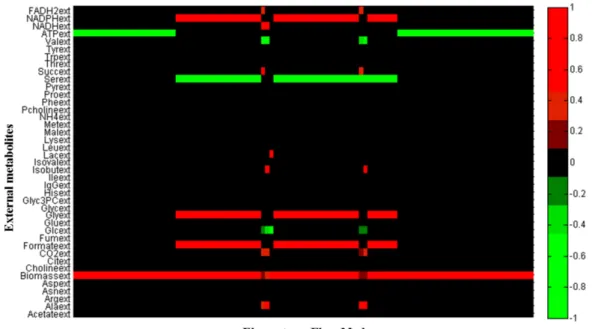
Figure 3.2 - Heat map of all the EFMs which produce biomass (normalized data). Metabolites in
green are consumed and in red are produced... 21
Figure 3.3 – Three-dimensional representation of biomass EFMs clustering. Each coloured dot
represents an EFM and each colour a cluster. Black dots are the centroid of each cluster. ... 21
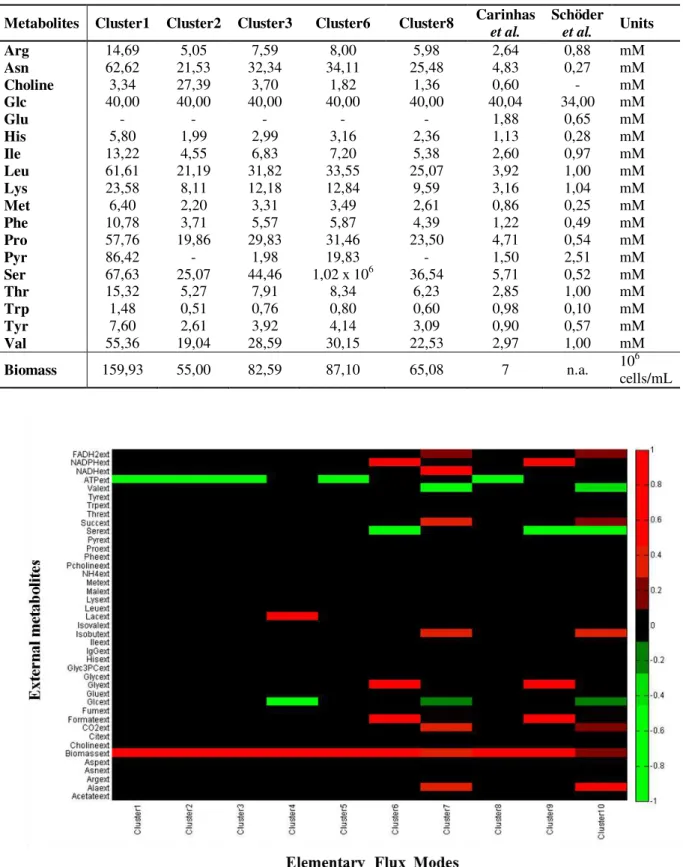
Figure 3.4 - Heat map of pathways obtained after cluster analysis of biomass production EFMs
(normalized data). Metabolites in green are consumed and in red are produced. ... 23 Figure 3.5 – Comparison between the concentrations from the formulation of cluster 2 (biomass production) and from published data [29, 37]. ... 24
Figure 3.6 – Heat map of all the EFMs with IgG production (normalized data). Metabolites in
green are consumed and in red are produced... 25
Figure 3.7 - Three-dimensional representation of IgG production EFMs clustering. Each
coloured dot represents an EFM and each colour a cluster. Black dots are the centroid of each
cluster. ... 26
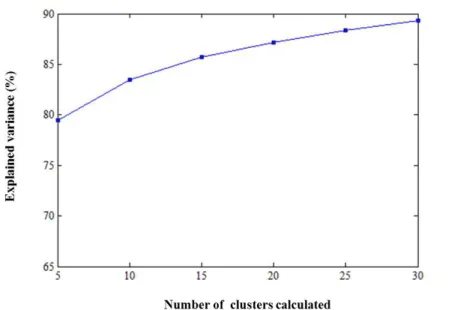
Figure 3.8 – Evolution of explained variance of the results from cluster analysis (of IgG
production EFMs) as function of the number of cluster calculated. ... 26
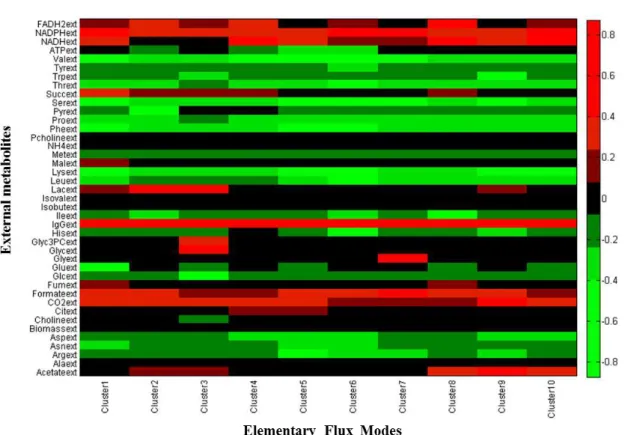
Figure 3.9 - Heat map of pathways obtained after cluster analysis of IgG production EFMs
(normalized data). Metabolites in green are consumed and in red are produced. ... 28
Figure 3.10 - Comparison between the concentrations from the formulation of cluster 10 (IgG
XIV
Figure 3.11 - Heat map of all the EFMs with CO2 production and no biomass or IgG
(normalized data). Metabolites in green are consumed and in red are produced. ... 30
Figure 3.12 - Three-dimensional representation of cellular respiration EFMs clustering. Each
coloured dot represents an EFM and each colour a cluster. Black dots are the centroid of each
cluster. ... 31
Figure 3.13 - Evolution of explained variance of the results from cluster analysis (of cellular
respiration EFMs) as function of the number of cluster calculated. ... 31
Figure 3.14 - Heat map of pathways obtained after cluster analysis of cellular respiration EFMs
(normalized data). Metabolites in green are consumed and in red are produced. ... 32 Figure 3.15 – Graphical comparison between the concentrations from the formulation of cluster 6 (cellular respiration) and from published data [29, 37]. ... 33
Figure 3.16 - Heat map of all the EFMs with no production of biomass, IgG and CO2
(normalized data). Metabolites in green are consumed and in red are produced. ... 34
Figure 3.17 - Graphical comparison of metabolites concentration between the final formulation
XV
List of Tables
Table 2.1 - Composition of serum-free medium CHO-T1-SF [37]. ... 15 Table 3.1 – Medium composition from clusters 1, 2, 3, 6 and 8 (aiming biomass production) and from published data [29, 37]. ... 23
Table 3.2 - Medium composition from clusters 1, 4, 7, 8 and 10 (aiming IgG production) and
from published data [29, 37]. ... 28 Table 3.3 – Medium composition from clusters 4, 6, 7, 8 and 9 (aiming cellular respiration) and from published data [29, 37]... 32
Table 3.4 - Medium composition from the clusters selected from each subset, final formulation
and compositions from published data [29, 37]. ... 35
Table 6.1 - Metabolic network for CHO cells. ... 43
Table 6.2 - Price list of supplements present in the medium composition proposed by Schröder
et al. [37]. Prices and references were gathered from Sigma-Aldrich website on 2 Aug. 2013, aiming reagents suitable for cell culture... 47
Table 6.3 - Coefficients of the 10 clusters (after the second normalization is reversed) from
EFMs producing biomass. ... 50
Table 6.4 - Coefficients of the 10 clusters (after the second normalization is reversed) from
EFMs producing IgG. ... 52
Table 6.5 – Coefficients of the 10 clusters (after the second normalization is reversed) from
XVII
List of abbreviations
Ala Alanine
Arg Arginine
Asn Asparagine
Asp Aspartate
Cit Citrate
CO2 Carbon dioxide
EMA Elementary mode analysis
EMF Elementary flux mode FBA Flux Balance Analysis
Glc Glucose
Glu Glutamate Gln Glutamine
Glyc3P Glycero-3-phosphocholine
Glyc Glycerol
Gly Glycine
His Histidine
Isobut Isobutyrate
IgG Immunoglobulin G
Ile Isoleucine
Isoval Isovalerate Lac Lactate
Leu Leucine
Lys Lysine
Mal Malate
Met Methionine
MFA Metabolic Flux Analysis Phe Phenylalanine
Pcholine Phosphocholine
Pro Proline
Pyr Pyruvate
Ser Serine
SQres Square of the sum of all the distances between cluster centres and each point
SQtot Square of the sum of all points analysed
Suc Succinate
Thr Threonine Trp Tryptophan
Tyr Tyrosine
1
1.
Introduction
Production of complex therapeutic proteins is dominantly performed in mammalian cell
lines because of their capacity for post-translational modifications and human like protein
structure assembly [1]. Chinese Hamster Ovary (CHO) cells have become the most widely used
expression system for this type of applications. Since 1987, dozens of biologics have been
approved to be produced using CHO cell lines, including monoclonal antibodies used to treat
cancer and immunological disorders. In 2007, nearly 70% of all recombinant protein
therapeutics produced were made in CHO cells, exceeding US$30 billion worldwide of annual
sales [2].
To achieve an effective in vitro maintenance and growth, animal cells need culture conditions similar to those found in vivo regarding temperature, oxygen and carbon dioxide concentrations, pH, osmolality, and nutrients. The delivery of that complex combination of
nutrients to animal cells, which in vivo is performed through blood circulation, requires an equivalent supply performed in vitro through the addition of culture medium. That medium has to provide appropriate pH and osmolality for cell survival and multiplication, as well as all
chemical substances required by the cells that they are unable to synthesize themselves; thus its
composition is one of the most important factors regarding culture of animal cells [3].
In the formulation of new culture media, information about the cell metabolism is
extremely important. In fact, as stated by Kell et al. [4], the physiological state inside a cell is a function of the external metabolite levels, which can be measured. This suggests an opportunity for a new method of media design; based in the “role” of each metabolite in the metabolic network and its impact on metabolic performance. In this context, metabolic modelling may
provide essential tools to analyse the available information concerning the metabolic network
and may return valuable clues about new culture medium components. Therefore, media
development and metabolic modelling will be the main topics of this introduction.
1.1.
Media Development
For more than 50 years the development of culture media for mammalian cells has been
studied. As previously mentioned, the culture of animal cells requires the supply of a complex
combination of nutrients equivalent to those found in vivo. For this reason, the first attempts were performed using media based entirely on biological fluids, such as serum and other blood
or tissue extracts [5]. However, these media, which are chemically undefined, present some
concerns, such as: batch to batch variation – causing inconsistency in growth-promoting
Development of Principle Culture Medium Formulations for CHO Cells
2
viruses, mycoplasma, prions) that can also contaminate the end products; limited availability
and high costs. Therefore media prepared with highly purified compounds and with known
composition have been preferentially developed. These media are particularly attractive for
biopharmaceutical production since they are less vulnerable to contamination and quality
control is easier [3].
To be effective, a culture medium has to contain the nutrients needed for the synthesis
of new cells and the substrates necessary for the metabolism, as well as the compounds that act
as cofactors. Therefore, a culture medium must have : micronutrients (inorganic salts and trace
elements), sugars (carbon and energy sources), amino acids (nitrogen sources), vitamins,
hormones and other elements (lipids, organic acids, proteins) and water, besides cell-specific
substances [3]. The functions of the main components of a typical culture medium will be
briefly explained next.
1.1.1.
Main media components
Amino acids
Animal cells in culture require essential amino acids (i.e., those that are not synthesized
in animal tissues), plus others depending on the specific requirements of the individual cell line.
Nonessential amino acids are often added to alleviate metabolic burden and achieve better
growth characteristics. The limitation of an amino acid may limit the maximum cell
concentration attainable and may reduce the growth rate [5, 6]. Generally, each amino acid is
added to culture medium in a concentration from 0,1 to 1 mM.
According to Freshney, glutamine, methionine and serine are growth limiting amino
acids [7]. In the case of glutamine, this amino acid is usually added at high concentrations (from
1 to 5 mM) and acts as source of nitrogen, carbon, and energy [3]. However, glutamine
metabolism generates ammonium which has toxic effects and is a cell growth inhibitor when
accumulated in large quantities [8]. Glutamate has been shown as a successful substitute for
glutamine, as shown in the experiments performed by Altamirano et al. regarding CHO cell culture medium [9]. The results of this study will be mentioned below, as, besides glutamine,
the substitution of glucose was also tested.
Glucose
Glucose is included in most media as the main source of carbon and energy. It is
metabolized mainly by glycolysis, forming pyruvate which can be converted to lactate or
acetoacetate. The latter can enter the citric acid cycle (TCA) and be oxidized to form carbon
dioxide and water. Typically, there is a high accumulation of lactate in culture medium
1. Introduction
3 accumulation of lactate can be a problem since it will decrease external pH and, due to its
toxicity to the cells, inhibit cell growth [6], similarly to ammonium.
As previously mentioned, Altamirano et al. substituted glucose and glutamine in a CHO Cell Culture Medium Formulation [9]. Glucose was replaced by galactose and good results were
achieved. The use of galactose and glutamate simultaneously, in place of glucose and glutamine,
allowed the maintenance of cells with lower consumption of nutrients and lower generation of
lactate and ammonium; however, the obtained cell growth was also lower. Interestingly,
maximum cell growth was obtained using glucose and glutamate, even higher than when
glucose and glutamine were used but with very low ammonium accumulation and reduced
lactate levels.
Glucose is usually added to the culture medium in concentrations ranging from 5 to 25 mM (0,9 – 4,5 g/L), however it may be up to 56 mM (10g/L) [3].
Inorganic salts and trace elements
The salts are the major components contributing to the osmolality of the medium. The
most used are Na+, K+, Mg2+, Ca2+, Cl-, SO42-, PO43-, and HCO3-. In brief, the main functions of
these ions are [6]:
Ca2+ - required by some cell adhesion molecules; intermediary in signal transduction;
can influence whether cells will proliferate or differentiate;
Na+, K+, Cl- - regulation of the cellular membrane potential;
SO42-, PO43-, HCO3- - macromolecular synthesis; regulation of intracellular charge.
To avoid cell aggregation and adhesion in suspension cultures, the concentration of calcium and
magnesium must be kept low [3]
Other inorganic elements, which can be found in serum, are usually added to the culture
medium at reduced concentrations. These include elements such as iron, selenium, zinc and
copper. According to the information provided by Sigma-AldrichMedia ExpertTM [10], the main functions of these elements are:
Fe – cell respiration and energy management;
Se – protection of cells from oxidative damage; it can act as an antioxidant or a
pro-oxidant;
Zn – important in amino and nucleic acids metabolism; roles in transcription and as an
antioxidant;
Development of Principle Culture Medium Formulations for CHO Cells
4
Other media components
Other components may be, for example, vitamins and hormones, which are present at
relatively low concentrations and are utilized as essential metabolic cofactors and growth
regulators, respectively.
Water used for media preparation is simultaneously one of the basic and one of the most
critical components since mammalian cells are extremely sensitive to water quality [5]. To
ensure the physicochemical and microbiological standards required by pharmacopoeia [11]
specialized water purification systems have to be used. This process can involve four stages,
which are reverse osmosis (or distillation), charcoal filtration, deionization, and micropore
filtration [5].
The components in each media formulation will vary depending on the cell line for
which it was designed.
1.1.2.
Previous studies and media formulations
As mentioned before, the use of serum in a culture medium presents many
disadvantages.
Several commercial serum-free media are available for CHO cells; however, they are
expensive and their compositions are proprietary, which makes further improvement difficult.
Thus, there have been lots of efforts to develop serum-free media for the production of
therapeutic proteins by mammalian cells, as well as protein-free media, which facilitates the
downstream purification of recombinant proteins secreted by the cells. However, the media
development efforts carried out are essentially based on experimental tests and statistical
methods, such as Design of experiments. These techniques can be expensive and
time-consuming, and are reliant on empirical knowledge. Some examples are briefly described
below.
In 1999, Lee et al. used a statistical optimization approach in order to develop a serum-free medium for the production of erythropoietin (EPO) by suspension culture of recombinant
CHO cells [12]. The medium was intended to be used in suspension cultures, since this type of
manufacturing process has become the method of large-scale, commercial production of
therapeutically important proteins from rCHO cells [13]. The approach was based on a
Plackett-Burman design, where every ingredient is tested at high and low concentrations in order to
identify those that are important for cell growth and/or EPO production. That group was formed
1. Introduction
5 concentrations tested. The developed culture medium was compared with serum-supplemented
IMDM. Although cell growth and EPO production where lower using the serum-free medium,
the productivity per cell was higher, and the advantages of using a serum-free medium can
compensate economically and qualitatively.
According to the authors of the mentioned study and Castro et al. [14], who performed an identical study, the classical approach of changing one medium component at a time is
impractical because it is time-consuming and has the risk of neglecting interactions among the
supplements.
Kim et al. also developed a serum-free medium formulation based upon IMDM, using, in their own words, a simple but efficient strategy [15]. This study was based in experimental
work using a recombinant CHO cell line expressing a chimeric antibody against the S surface
antigen of Hepatitis B virus. The effects of the addition of different supplements to the initial
medium were analysed, concluding that yeast extract was the best substitute for serum in nine
experimental groups established. Identical analyses were performed regarding the cell
aggregation and proliferation and additional vitamins. The final formulation achieved good
results, with higher viable cell density and higher productivity. The comparison included a
serum-supplemented medium.
The media formulation considered in this thesis as baseline formulation was developed
by Schröder et al. and it will be described in the next section.
In another study, the efficacy of seven commercially available serum-free media
(EX-CELL, ISF-I, CD CHO, CDM4CHO, CHO-III-A, Octomed and HybridoMed) was tested [16].
It was used a transfected CHO-K1 cell line and the evaluation included cell growth and
monoclonal antibody (mAb) production. In the two last mentioned media, the cell adaptation
was not successful. The most recommended were EX-CELL and particularly CDM4CHO.
1.2.
Metabolic modelling of bioprocesses
For more than three decades, computational tools to analyse cellular metabolism have
been developed. Metabolic fluxes can be determined, being defined by the rates of
enzyme-catalysed reactions from a metabolic network, and each metabolic flux vector (or distribution)
defines cellular phenotype under a given growth condition [17]. There are essentially three main
groups of metabolic modelling tools that are related as they are developed from the same
mathematical principle but with differences in the problem formulation:
i. Metabolic Flux Analysis;
ii. Flux Balance Analysis;
Development of Principle Culture Medium Formulations for CHO Cells
6
1.2.1.
Theory behind metabolic network analysis
Generally, a biological system consists of a single cell or a cell compartment that
contains metabolites that are interconverted in an intricate metabolic network of
enzyme-catalyzed reactions [18]. Usually the reactions that transform metabolites within the system are
classified as internal reactions, whereas the reactions involving the transport of metabolites in
and out of the system are considered as exchange reactions [19].
The analysis of metabolic networks is based on the first principle of mass conservation
of internal metabolites within a system [20-22]. In a system of defined volume, that principle
can be generally described by the equation:
. (1)
where C (mol/L) is the concentration vector of m internal metabolites, r (mol/L/h) is the reaction
rate (flux) vector of n reactions that convert metabolites, S is the stoichiometry matrix of
dimension mxn whose elements sij represents the stoichiometry coefficient of the metabolite i
involved in reaction j, µ (h-1) is the specific growth rate associated with the change in volume of the system. The later can be considered as negligible since the growth rate is much slower than
the reaction rates thus not changing significantly the concentrations of metabolites. At steady
state, there is no accumulation of internal metabolites in the system so Equation (1) can be
simplified to:
. (2)
which, in the case of cellular metabolism, is typically an undertermined system with as many
unknowns as the number of reactions.
On the other hand, thermodynamic constraints imply reactions have to proceed in the
appropriate direction thus irreversible reactions have positive or null flux values [17]
:
. (3)
1.2.2.
Approaches
The use of Metabolic Flux Analysis (MFA) to solve this system implies the knowledge
of some experimentally measured fluxes. Thus, the flux vector is portioned into an unmeasured
flux vector (ru) and an measured flux vector (rm) resulting in the following equation:
1. Introduction
7 With a sufficient number of experimentally determined fluxes, matrix Su is invertible and ru can
be calculated however, that demonstrates how reliant on experimental data this technique is.
The solution obtained is a single metabolic flux vector (r) for the measured fluxes considered,
hence different growth conditions will result in a different metabolic determination.
When the known measured fluxes are not enough or the matrix Su is not invertible, Flux
Balance Analysis (FBA) can be used. With this tool, the metabolic flux vector is determined by
imposing an objective function (e.g. maximize the product or the specific growth rate) and some
constraints (e.g. substrate uptake rate and thermodynamic constraints). Like the previous
mentioned technique, FBA only determines a metabolic flux vector under given growth
conditions, which does not exclude the existence of alternative optimal solutions or suboptimal
solutions, and although this tool does not require so many experimental data as MFA, more
measured fluxes will lead to a more accurately determined flux vector.
Unlike the previous methods, metabolic pathway analysis does not require measured
fluxes neither the imposition of an objective function, and it allows the identification of all
metabolic flux vectors possible for a metabolic network. Network-based elementary flux modes
and extreme pathways define uniquely and mathematically biochemical pathways directly from
the structure of the metabolic network characterized by its reactions and metabolites [23].
As Schuster et al. mentioned an elementary mode is defined as a minimal set of enzymes that could operate at steady state, and any elementary mode has to use the irreversible
reactions in the appropriate direction [24]. Therefore, these pathways have to be
non-decomposable which means if an active flux is restricted to zero then the flux through the entire
pathway must be zero.
Geometrically, these pathways can be visualized as vectors in a space with as many
dimensions as the number of reactions in the metabolic network, where the numerical value on a
given axis is the flux level in the corresponding reaction [23]. The allowed flux distributions are
within the admissible flux space, kwon as convex polyhedral cone, illustrated in Figure 1.1 [25].
The edges of the convex cone correspond to the unique extreme pathways that
mathematically describe the minimal set of convex basis vectors needed to describe all
allowable steady-state flux distributions through the metabolic network [26]. Extreme pathways
are obtained when additionally to the constraints considered for elementary mode analysis
(EMA) systemic independence is required, which means no extreme pathways can be
represented by non-negative linear combinations of other extreme pathways. Therefore, extreme
pathways are a minimal subset of the elementary flux modes. When all the reactions in a
metabolic network are irreversible the extreme pathways and the elementary flux modes result
in the same set of pathways.
Pathway analysis can be useful for predictions of a minimal medium, identifying which
Development of Principle Culture Medium Formulations for CHO Cells
8
et al. for Haemophilus influenza and Helicobacter pylori with computed compositions consistent with experimental results [27, 28].
Figure 1.1 – Geometric interpretation of a metabolic network analysis. (a) All possible flux distributions of a metabolic network lie within the admissible flux cone. Each axis corresponds to the flux through a given reaction. The edges of the cone are represented by the extreme pathways (represented by and by the elementary flux modes marked with an asterisk). (b) Metabolic Flux Analysis identifies only a combination of fluxes that lies anywhere in the cone (); (c) as well as Flux Balance Analysis that represents only a combination of fluxes that lies also anywhere in the cone () and satisfies the defined objective function. (d) The remaining elementary flux modes lie on the face and inside the cone (). Adapted from [17].
1.3.
Objectives
As shown in the first part of this introduction, even using statistical tools to enhance
data analysis, the methods still used for media development are too reliant on empirical
knowledge; thus, that can be expensive and time-consuming.
It has been shown that the environment where a cell is inserted can influence its
performance; however, metabolic engineering by medium manipulation has not been used.
Therefore, the main objective of this thesis is to leverage the knowledge of the
metabolic network of CHO cells to develop principle culture medium formulations that cover
their distinct metabolic states. The ultimate aim is to establish a culture medium which allows
higher yields of cell growth and product. The main work can be split into the following tasks:
1. Implementation of a “parsimonious” metabolic network for CHO cells which includes a
biomass synthesis reaction and a product synthesis reaction;
2. Computation of elementary flux modes in order to identify all possible biochemical
states of the network; the complexity of the network cannot be too large for this
1. Introduction
9 3. Clustering of elementary flux modes to obtain a representative and reasonable group of
biochemical states;
4. Formulation of culture medium based on a conjugation between bibliography review
Development of Principle Culture Medium Formulations for CHO Cells
11
2.
Materials and methods
2.1.
Metabolic network
The metabolic network considered in this thesis results from an adaptation of the
network of central metabolic pathways of glutamine-synthetase (GS)-CHO cells, producing
Immunoglobulin G (IgG), developed by Carinhas et al. [29], which was based on published models [30-32] and complemented with reactions taken from biochemistry textbooks in
agreement with the results provided by 1H-NMR exometabolomic analysis. This network is composed by 117 reactions, involving the pathways of glycolysis, pentose phosphate pathway
(PPP), TCA cycle, glutaminolysis, amino acids metabolism, by-product formation and
extracellular transport fluxes. The cell biomass composition was taken from the literature [33].
Due to the high number of reversible reactions in the original metabolic network it was
not possible to calculate all the elementary flux modes, since the number of modes grows
exponentially with the size of the network. This created the need to simplify the network. Thus,
for most of reversible reactions it was defined a single flux direction; and some of the internal
(balanced) metabolites were left out. Since the studied CHO cells were generated by
transfection with a construct containing glutamine synthetase (GS), which is the enzyme
responsible for the biosynthesis of glutamine from glutamate and ammonia, they can grow in a
glutamine-free medium. Thus, glutamine transport flux was omitted. The extracellular transport
fluxes of ATP, NADH, NADPH and FADH2 were added to the network, as these were
considered as non-balanced metabolites. It should be noticed that these molecules are not added
to culture medium as a supplement; they are produced and used by the cell. However, it was
necessary to add these reactions to the metabolic network in order to allow the calculation of
elementary flux modes.
The resulting adapted metabolic network is formed by 119 reactions (9 reversible), with
126 metabolites (41 external or non-balanced). The metabolites with suffix “ext” were defined
as external, or non-balanced. The list of reactions is shown in Table 6.1 (Appendix A) and a
simplified representation with the main reactions is shown in Figure 2.1.
In the reaction of biomass production (r69), the coefficients represent the amount of each
metabolite in nmol required to produce 106 cells; and in the reaction of IgG production (r78), the
Development of Principle Culture Medium Formulations for CHO Cells
12
2.Materials and methods
13
2.2.
Elementary mode analysis
In this study, metabolic modelling was performed using elementary mode analysis. This
tool can decompose the intricate metabolic network comprised of highly interconnected
reactions into uniquely organized pathways which, as previously mentioned, consist of a
minimal set of enzymes that can support steady state operation and each one representing an
independent cellular physiological state [17]. Furthermore, elementary flux modes (EFMs) have
to be independent of each other, i.e. the reactions involved in one EFM must not be a subset of
the reactions of any other EFM.
EFMs were calculated using the program Metatool 5.1 [34, 35], freely available on
http://pinguin.biologie.uni-jena.de/bioinformatik/networks/; interfaced with MATLAB (version
8.0.0.783 64-bit) in a 3,6 GHz PC with 4 GB RAM. To carry out this analysis, the metabolites
classified as external were listed and the 119 reactions from the metabolic network were
implemented.
Results from the Metatool are provided as a MATLAB structure, composed by several matrices, including the reduced system matrix (“rd”) and the matrix with the elementary flux modes of the reduced system (“rd_ems”). These two matrices can be used to examine the
numerical quality of the result. Multiplying the first one by the second, the maximum absolute
value in the result must be zero if all the stoichiometric coefficients are integers, or at least a
very small number.
Inside that structure is the matrix “ems”, whith rows corresponding to metabolites and columns to EFMs. However, for this study, which regards media formulation, external metabolites are the main interest. The matrix “ext”, also in the structure, represents all EFMs (columns) versus external metabolites (rows). Thus, multiplying “ems” by “ext” allows
obtaining a matrix that correlates EFMs (columns) with the external metabolites (rows).
2.3.
Data normalization and clustering
Each elementary flux mode represents an independent physiological state of the cell,
from which a particular medium formulation could be developed. However, it would not be
reasonable obtaining thousands of formulations for all EFMs, and many EFMs can be similar so
they can be grouped in the same set. Thus, by performing a cluster analysis one can take a small
and representative subset of EFMs.
Before cluster analysis some steps had to be implemented. The first was the
normalization of the matrix containing the EFMs versus external metabolites. Normalization
was done in two ways. First, all the stoichiometric coefficients of each EFM (i.e. each column
Development of Principle Culture Medium Formulations for CHO Cells
14
aims to prevent two EFMs that are linearly dependent to be in different clusters; hence, after this
operation, those two EFMs will have the same coefficients and will be grouped in the same set.
The second normalization was performed by row. The coefficients for each metabolite
were divided by the maximum absolute value of the corresponding row in order to ensure that
all metabolites have coefficients in the same range and their contribution to the cluster analysis
will not be biased. Importantly, it must be taken into account that this second normalization can
only be used for the clustering step, since each coefficient in the same EFM will be divided by a
different value and in consequence the resulting EFM will not be the same. Therefore, this
normalization is reversed after clustering; multiplying the coefficients of each metabolite by the
same value they were previously divided by. After normalization and before the cluster analysis,
EFMs were divided into three groups according to their contribution to the production of: only
biomass; only IgG; only CO2 with no production of biomass or IgG. Clustering was applied to
these groups.
The cluster analysis was implemented in MATLAB using the k-means algorithm, a partitional clustering technique that is one of the simplest and most commonly used algorithms
employing a squared error criterion [36]. Using k-means implies the predefinition of the number of clusters intended. To determine k clusters, the algorithm randomly chooses k cluster centres or centroids, then assign each EFM to the closest cluster centre, and finally after all the EFMs
are assigned recalculates the centre of each cluster. In this study, 10 clusters were calculated for
EFMs subsets. The choice of the number of clusters was made considering an acceptable
explained variance of the data:
(5)
where SQres is the square of the sum of all the distances from each point (representing each
EFM) to the respective cluster centre; and SQtot is the square of the sum of all points analysed.
Finally, the randomness of the initial choice can be a limitation when it is not done
properly. To avoid it, the algorithm was set to repeat the operation 5 times, each with a new
initial set of centres, and chose the set with the lowest SQres value. Additionally, the maximum
number of iterations allowed was increased to 1000.
2.4.
Medium formulation
As mentioned in the introduction of this thesis, several serum-free media for CHO cells
have been developed and are commercially available. However, their formulations are
2.Materials and methods
15 one proposed by Schröder et al. [37] seemed to be the most complete. This formulation was used to compare with the results obtained.
Table 2.1 - Composition of serum-free medium CHO-T1-SF [37].
Component Specific concentration (mg/l)
Molar concentration (mM)
Inorganic salts
CaCl2 211,288 1,9
CuSO4·5H2O 0,0012 4,81 × 10⁻⁶
FeSO4·7H2O 0,3336 1,20 × 10⁻³
KNO3 0,0912 9,02 × 10⁻⁴
KCl 485,44 6,51
MgCl2 22,888 0,24
MgSO4 117,204 0,576
NaCl 3039,6 52
NaHCO3 4099,2 48,8
Na2HPO4 56,816 0,4
NaH2PO4·H2O 150 1,25
Na2SeO3·5H2O 0,02601 9,89 × 10⁻⁵
ZnSO4·7H2O 0,3452 1,20 × 10⁻³
Carbohydrates
d-Glucose 6120,8 34
l-Amino acids
l-Alanine 33,56 0,377
l-Arginine·HCl 185,2 0,879
l-Asparagine·H2O 40,084 0,267
l-Aspartic acid 41,32 0,31
l-Cysteine·HCl·H2O 14,048 0,08
l-Cystine·2HCl 109,488 0,349
l-Glutamic acid 95,88 0,652
l-Glutamine 1052,28 7,2
Glycine 39 0,52
l-Histidine·HCl·H2O 58,784 0,28
l-Isoleucine 127,576 0,973
l-Leucine 131,24 1
l-Lysine·HCl 189,8 1,04
l-Methionine 37,792 0,253
l-Phenylalanine 81,184 0,491
l-Proline 61,8 0,537
l-Serine 54,6 0,52
l-Threonine 118,76 0,997
l-Tryptophan 20,016 0,098
l-Tyrosine, disodium salt 128,164 0,569
l-Valine 117,48 1
Vitamins and miscellaneous compounds
d-Biotin 0,01852 7,58 × 10⁻⁵
dl-Pantothenic acid, calcium salt 4,992 1,09 × 10⁻²
Choline chloride 10,384 7,44 × 10⁻²
Ethanolamine 1,22 0,02
Development of Principle Culture Medium Formulations for CHO Cells
16
Component Specific concentration (mg/l)
Molar concentration (mM)
Hypoxanthine 13,6 0,1
i-Inositol 15,84 8,79 × 10⁻²
Linoleic acid 0,0336 1,20 × 10⁻⁴
Lipoic acid 0,084 4,07 × 10⁻⁴
Methotrexate (MTX) 1 × 10⁻⁴ to 0,1
Nicotinamide 48,148 3,94 × 10⁻²
Phenol red 18,48 5,21 × 10⁻²
Pluronic F-68 2000 –
Pyridoxal·HCl 4,8 2,36 × 10⁻²
Pyridoxine·HCl 0,0248 1,21 × 10⁻⁴
Riboflavin 0,4952 1,32 × 10⁻³
Sodium pyruvate 276 2,51
Thiamine·HCl 4,936 1,46 × 10⁻²
Thymidinea 3,88 0,016
Vitamin B12 0,5596 4,13 × 10⁻⁴
Peptones and proteins
Fetuin 10 –
Insulin 5 –
holo-Transferrin 5 –
Casein peptone soybean flour peptone broth 5000 –
2.5.
Experimental data
In order to compare the metabolite concentrations achieved from the results of
elementary mode analysis and subsequent cluster analysis, experimental data were considered.
A set of concentration profiles of 36 external metabolites was analyzed by Carinhas et al. [29]. The study carried out regarded cultures of GS-CHO cells expressing IgG4. The supernatants
were analysed using 1H-nuclear magnetic resonance (1H-NMR).
The data used here are the measurements performed using the lower producer (LP)
CHO cell clone without butyrate treatment. Biomass and IgG productions were also measured.
In the comparisons carried out in this thesis, the initial measured values (i.e. age=0h) were
assumed for the consumed metabolites and final concentrations for biomass and IgG.
2.6.
Cost estimate
In order to provide information essential for an estimate of the cost of a culture medium
formulation, the price of each supplement added was obtained and compiled in Table 6.2
(Appendix B). All the prices are from Sigma-Aldrich and are available on the company website (www.sigmaaldrich.com).
Since the range of package sizes varies depending on the product, it was chosen as
2.Materials and methods
17 (i.e. lowest price per gram). Thus, the price estimate for a formulation using the values from this
table will correspond to the lowest price achievable.
Development of Principle Culture Medium Formulations for CHO Cells
19
3.
Results and Discussion
3.1.
Elementary mode analysis
The calculation of EFMs for the metabolic network listed in the Table 6.1 performed by
Metatool 5.1 in MATLAB (version 8.0.0.783 64-bit; shared libraries compiled for the 32-bit
were not used in this study) took approximately one hour.
Before the calculation, Metatool analyses the metabolic network. In that
pre-analysis it was confirmed that all the balanced metabolites were consumed and produced at least
in one reaction each, as well as that none of the metabolites takes part in only one reversible
reaction and all the metabolites are used. Therefore, all the reactions in the metabolic network
were considered by Metatool.
In total, 23240 EFMs were computed by the algorithm. Figure 3.1 has a graphical
representation of the coefficients of each external metabolite for each EFM. The representation
was made as an heat map, where the green colour represents metabolites with negative
stoichiometric coefficients, i.e. the metabolite is consumed, while metabolites represented in red
are produced. All the heat maps shown in this thesis were obtained using MALTAB function
HeatMap.
Development of Principle Culture Medium Formulations for CHO Cells
20
The numerical quality of the result was examined by multiplying the reduced system
matrix by the matrix with elementary flux modes of the reduced system (see Section 2.2). The
maximum absolute value obtained was approximately 3,27x10⁻⁸, which is in agreement with the required (i.e. a very small number; or even zero when all the stoichiometric coefficients are
integers).
Before the construction of the heat map in Figure 3.1, the matrix with the data of
external metabolites vs. EFMs was normalized, as described in Section 2.3. This normalization
is very important or the graph would have been essentially occupied by a black area, since the
scale of colours used depends on the range of the coefficients. Thus, if a metabolite, for instance
glucose, has high values compared to the other metabolites, it would be marked on the heat
map, but the remaining metabolites with smaller values would lay down in the dark area as their
coefficients are not representative when compared to the higher one. After normalization, all the
coefficients of all the metabolites range between -1 and 1 and the heat map is more illustrative.
In Figure 3.1 it can be seen that all metabolites, except ATP, have the same behaviour
(i.e. are always consumed or produced) through the EFMs represented. ATP will be produced or
consumed depending on the energy credit of each EFM, since ATP was considered as an “external” metabolite (i.e. unbalanced). Thus, ATP will be produced if the EFM is related to cellular catabolism or it will be consumed in EFMs related to cellular anabolism. It should be
noted that in practice ATP is not available in the culture medium and its transport reaction does
not occur. Catabolism and anabolism occur simultaneously in a balanced way. However, as
mentioned in Section 2.1, the transport of ATP as well as the transport of NADH, NADPH and
FADH2 had to be added to the metabolic network in order to be possible the calculation of
EFMs by Metatool.
In the same figure, it can be observed that biomass is produced, or at least it is
represented, in few EFMs. In fact, when the EFMs are grouped according to its function (see
Section 2.3) one can notice that the pathways producing biomass are a minority. Therefore, the
group originally formed by 23240 EFMs was divided into:
108 EFMs producing only biomass;
16296 EFMs producing only IgG;
6658 EFMs producing CO2, with no production of biomass or IgG;
178 remaining EFMs with other functions.
To note that none of the EFMs produced biomass and IgG simultaneously. Each of these groups
will be analysed in more detail next in this thesis.
3.2.
Biomass production
The EFMs that produce biomass are represented in Figure 3.2. It can be seen that many
3. Results and Discussion
21 participate in the EFMs, but their coefficients may be too low when compared to the values
associated with metabolites highly consumed/produced.
Figure 3.2 - Heat map of all the EFMs which produce biomass (normalized data). Metabolites in green are consumed and in red are produced.
Although this is one of the smallest groups of EFMs obtained, in order to have a
representative sample of the cellular physiological states, where biomass is produced, cluster
analysis was performed using MATLAB kmeans function.
The data were grouped in 10 clusters, with an explained variance of 99,6%.This value
of explained variance increases as more clusters are calculated. In this case, it will not be
significant since the value is already very high.
Development of Principle Culture Medium Formulations for CHO Cells
22
To perform the cluster analysis 41 variables have to be considered; one for each external
metabolite. It is not possible to graphically represent the data with all the variables. However, in
order to provide a simple illustrative example, data were represented considering the
coefficients of glucose, malate and lysine in Figure 3.3. Although there are 108 possible EFMs
in this group, which correspond to 108 points plotted on the graph, only a few can be visually
distinguished. This suggests a possible collinearity of the data, i.e. many EFMs are similar in
most of the coefficients but not entirely equal. Thus, it is not surprising the high value of
explained variance achieved in the clustering step.
In this discussion it will be shown only the results for the following metabolites:
alanine, arginine, asparagine, choline, glucose, glycine, histidine, isoleucine, leucine, lysine,
methionine, phenylalanine, proline, pyruvate, serine, threonine, tryptophan, tyrosine, and valine;
as well as the production of biomass, IgG and carbon dioxide, according to the analysis
performed. However, the whole set of results are available in the appendices. The metabolites
mentioned were chosen because they are usually consumed and consequently they are
interesting regarding media formulation
The coefficients of the 10 clusters (after the second normalization is reversed, see
Section 2.3) are shown in Table 6.3 (Appendix C) with the correspondent standard deviations.
In this discussion, in order to be more comprehensible and easier to compare with literature
data, the values of each metabolite in each cluster (for all the clustering results) will be shown as
medium concentrations proportional to an initial glucose availability of 40 mM. This value was
the initial concentration measured by Carinhas et al. [29]. Literature data comes from the formulation shown in Table 2.1 (page 15).
The 10 cluster centres are also graphically represented as a heat map in the Figure 3.4
and 5 of them were considered for Table 3.1. Cluster 5 was removed because it is identical to
the first one; cluster 9 is identical to cluster2; clusters 4, 7 and 10 produce very little amounts of
biomass. Cluster 4 produces essentially lactate; and clusters 7 and 10 correspond basically to
cellular respiration, since they are the two states from this set that produce more CO2, but
producing a little amount of biomass simultaneously.
Glutamate is not consumed, and also glutamine since it was assumed this was not part
of the medium when the transport reaction for this metabolite was omitted in the metabolic
network. Consequently, it is not surprising that ammonium is not produced. Aspartate and
glycine are not part of the medium formulation as well, according to these results, since they can
be produced from asparagine and serine, respectively. In fact, serine is highly consumed in these
cellular metabolic states, as also mentioned in the Introduction (Section 1.1) based on literature
review. However, the value of serine concentration required for cluster 6 is extremely high. This
metabolite is being used to produce energy. As shown in Figure 3.4, when serine is highly
3. Results and Discussion
23 Table 3.1 – Medium composition from clusters 1, 2, 3, 6 and 8 (aiming biomass production) and from published data [29, 37].
Metabolites Cluster1 Cluster2 Cluster3 Cluster6 Cluster8 Carinhas
et al.
Schöder
et al. Units
Arg 14,69 5,05 7,59 8,00 5,98 2,64 0,88 mM
Asn 62,62 21,53 32,34 34,11 25,48 4,83 0,27 mM
Choline 3,34 27,39 3,70 1,82 1,36 0,60 - mM
Glc 40,00 40,00 40,00 40,00 40,00 40,04 34,00 mM
Glu - - - 1,88 0,65 mM
His 5,80 1,99 2,99 3,16 2,36 1,13 0,28 mM
Ile 13,22 4,55 6,83 7,20 5,38 2,60 0,97 mM
Leu 61,61 21,19 31,82 33,55 25,07 3,92 1,00 mM
Lys 23,58 8,11 12,18 12,84 9,59 3,16 1,04 mM
Met 6,40 2,20 3,31 3,49 2,61 0,86 0,25 mM
Phe 10,78 3,71 5,57 5,87 4,39 1,22 0,49 mM
Pro 57,76 19,86 29,83 31,46 23,50 4,71 0,54 mM
Pyr 86,42 - 1,98 19,83 - 1,50 2,51 mM
Ser 67,63 25,07 44,46 1,02 x 10⁶ 36,54 5,71 0,52 mM
Thr 15,32 5,27 7,91 8,34 6,23 2,85 1,00 mM
Trp 1,48 0,51 0,76 0,80 0,60 0,98 0,10 mM
Tyr 7,60 2,61 3,92 4,14 3,09 0,90 0,57 mM
Val 55,36 19,04 28,59 30,15 22,53 2,97 1,00 mM
Biomass 159,93 55,00 82,59 87,10 65,08 7 n.a. 10
6
cells/mL
Development of Principle Culture Medium Formulations for CHO Cells
24
The amount of biomass produced seems to be too high when compared to the amount
achieved by Carinhas et al.: 7 millions of cells per millilitre. However, it must be taken into account that, as previously mentioned, due to the four last transport reactions added to the
metabolic network (see Section 2.1 and Appendix A) it is not imposed that catabolism and
anabolism have to coexist in the same cell. Actually, as it can be seen in Figure 3.4, in several
cluster centres ATP is consumed from an external source. In practice that does not happen since
the culture medium is not supplied with ATP; then the cell has to produce it in the catabolic
process. Thus, in these metabolic states, glucose is being used essentially for biomass
production. Actually, the ratio of consumed glucose per produced biomass for cluster 2 is
approximately 727 nmol Glc/106 cells while in the experiments by Carinhas et al. it was near 5714 nmol Glc/106 cells.
Cluster 2 seemed to be the metabolic pathway with the most reasonable set of
concentrations required in the medium. Figure 3.5 compares the achieved values in that cluster
with the values from the literature. It can be seen that most of the metabolites are required at
higher concentrations in this formulation, which is justified with the much higher production of
biomass. This also happens in the other centroids with high production of biomass.
3. Results and Discussion
25
3.3.
IgG production
The 16296 EFMs with IgG production are represented in Figure 3.6. As this heat map
suggests, and contrary to the results depicted in Figure 3.2 with the EFMs of biomass
production, most of the metabolites take part in significant amount in the pathways aiming IgG
production. Once more, the behaviour (i.e. consumption or production) of metabolites seems to
be preserved regardless of the EFM in which it takes part. The exception is again ATP, which is
consumed in most of the EFMs but produced in a few of them.
Figure 3.6 – Heat map of all the EFMs with IgG production (normalized data). Metabolites in green are consumed and in red are produced.
Cluster analysis provided a group of 10 clusters, each represented by its centre, with an
explained variance of about 83,6%. It was expected a lower value when compared to the
previous one since the EFMs are many more in this case, and taking into account that 41
variables are analysed. Visualizing the representation of the EFMs treated in this section
considering only three variables (i.e. metabolites) in Figure 3.7, becomes clear that clustering of
these data is not so simple as the previous case, even just for three variables since the EFMs are
relatively close to each other. The greater the number of clusters is, the greater the explained
variance is, as shown in Figure 3.8. Therefore, the chosen number of clusters must be a
Development of Principle Culture Medium Formulations for CHO Cells
26
Figure 3.7 - Three-dimensional representation of IgG production EFMs clustering. Each coloured dot represents an EFM and each colour a cluster. Black dots are the centroid of each cluster.
3. Results and Discussion
27 The whole set of stoichiometric coefficients of the 10 clusters is listed in Table 6.4
(Appendix ) with respective standard deviations, and represented in Figure 3.9 as a normalized
heat map. It can be seen that IgG is highly produced in all clusters. ATP in some clusters is
obtained by the cell from an external source, but in smaller amounts than for biomass
production. This can be explained by the high production of CO2, also visible in the heat map,
which suggests the occurrence of cellular respiration in order to obtain energy. However,
NADH, NADPH and FADH2 are transported to the cell exterior, when they should be
capitalized to produce more energy.
Table 3.2 shows 5 of the 10 cluster centres. Clusters 2, 3, 5, 6 and 9 have identical
values of IgG production to some of those clusters that are represented. In the same table, where
the second normalization of the values was already reversed and the data are presented as
concentrations corresponding to 40 mM of glucose available in the medium, the high value of
IgG produced becomes more evident; especially when compared to the value achieved
experimentally. Cluster 10 has the lowest value of IgG produced; however, it is almost 50 times
higher than the experimental one. To understand this difference, one must keep in mind that in
these EFMs no biomass is produced, which poses a much larger metabolic commitment to the
cell. Thus, glucose can be used mostly to produce IgG, with part being used to produce energy
as previously said.
Regarding the presented coefficients, cluster 10 seems to be the most biologically
feasible. Therefore, this was the one considered in the comparison made with published data, in
Figure 3.10. The concentrations required by the pathway represented by cluster 10 are higher
than those from the reports, especially in the case of choline, pyruvate and tyrosine. However,
the higher demand is comprehensible since more antibody (i.e. IgG) is produced. Furthermore,
when compared to Figure 3.5 (concentrations for biomass production) it can be noticed that in
this case the difference between calculated and published data is not so remarkable.
Also in contrast to results for biomass production is the consumption of glutamate and
production of ammonium (from amino acids metabolism) present in these pathways, although in
small amounts. The ratio of ammonium produced per glutamate consumed in cluster 10 is near
0,24 mmol NH4 / mmol Glu.
The ratio of produced IgG per consumed glucose of cluster 10 is near 321mmol IgG /
mmol Glc, while for experimental data is near 6,4 mmol IgG / mmol Glc.
Although in cluster 10 that does not happen, serine is highly consumed in the remaining
Development of Principle Culture Medium Formulations for CHO Cells
28
Figure 3.9 - Heat map of pathways obtained after cluster analysis of IgG production EFMs (normalized data). Metabolites in green are consumed and in red are produced.
Table 3.2 - Medium composition from clusters 1, 4, 7, 8 and 10 (aiming IgG production) and from published data [29, 37].
Metabolites Cluster1 Cluster4 Cluster7 Cluster8 Cluster10 Carinhas
et al.
Schöder
et al. Units
Arg 22,50 56,19 26,93 31,42 5,88 2,64 0,88 mM
Asn 20,59 46,61 30,30 38,45 5,20 4,83 0,27 mM
Asp 29,96 44,65 31,03 31,26 3,97 1,56 0,31 mM
Choline 10,04 1,23 5,02 5,11 11,21 0,6 0 mM
Glc 40,00 40,00 40,00 40,00 40,00 40,04 34 mM
Glu 17,13 30,23 0,21 30,99 4,48 1,88 0,65 mM
His 14,06 33,91 78,02 25,22 3,21 1,13 0,28 mM
Ile 11,44 56,66 22,84 16,21 6,25 2,6 0,97 mM
Leu 36,30 68,75 48,90 46,86 6,80 3,92 1 mM
Lys 30,75 68,41 42,90 91,07 6,35 3,16 1,04 mM
Met 4,29 8,05 5,74 5,98 0,85 0,86 0,25 mM
Phe 26,80 48,81 32,19 35,37 5,01 1,22 0,49 mM
Pro 63,00 89,28 44,24 60,29 9,17 4,71 0,54 mM
Pyr 23,19 418,97 35,65 54,32 20,94 1,5 2,51 mM
Ser 112,00 206,86 134,49 135,58 8,35 5,71 0,52 mM
Thr 47,55 80,53 55,26 57,57 5,52 2,85 1 mM
Trp 9,30 21,20 12,43 12,96 2,38 0,98 0,1 mM
Tyr 10,39 21,17 17,52 16,84 10,55 0,9 0,57 mM
Val 91,18 111,12 71,27 64,80 3,72 2,97 1 mM
![Figure 2.1 - Metabolic network of CHO cells (adapted from [29]). Nucleotide synthesis, lipid synthesis, IgG glycosylation and transport reactions were omitted](https://thumb-eu.123doks.com/thumbv2/123dok_br/16480797.732403/31.892.158.741.101.1080/figure-metabolic-nucleotide-synthesis-synthesis-glycosylation-transport-reactions.webp)
![Table 2.1 - Composition of serum-free medium CHO-T1-SF [37].](https://thumb-eu.123doks.com/thumbv2/123dok_br/16480797.732403/34.892.124.781.232.1144/table-composition-serum-free-medium-cho-t-sf.webp)
![Figure 3.5 – Comparison between the concentrations from the formulation of cluster 2 (biomass production) and from published data [29, 37]](https://thumb-eu.123doks.com/thumbv2/123dok_br/16480797.732403/43.892.187.707.629.988/figure-comparison-concentrations-formulation-cluster-biomass-production-published.webp)