Article
Printed in Brazil - ©2014 Sociedade Brasileira de Química0103 - 5053 $6.00+0.00
A
*e-mail: [email protected]
A Micro-Flow-Batch Analyzer using Webcam for Spectrophotometric
Determination of
Ortho
-phosphate and Aluminium(III) in Tap Water
Marcelo B. Lima, Stéfani I. E. Andrade, Maria S. Silva Neta, Inakã S. Barreto, Luciano F. Almeida and Mário César U. Araújo*
Departamento de Química, Centro de Ciências Exatas e da Natureza (CCEN), Universidade Federal da Paraíba, CP 5093, 58051-970 João Pessoa-PB, Brazil
Neste trabalho é proposto um analisador micro-flow-batch (µFBA) usando uma webcam
para determinação espectrofotométrica de ortofosfato e alumínio(III) em água de torneira. Este microssistema foi feito com uretana-acrilato e lâminas de vidro. As determinações de PO43– e Al3+
foram realizadas empregando os métodos do azul de molibdênio e quercertina, respectivamente. Para a construção de curvas analíticas lineares um modelo matemático foi usado com base nos valores RGB (vermelho, verde e azul). As faixas de trabalho foram de 25 a 500 µg L−1 para ambos
os analitos com limites de detecção, desvio padrão relativo (RSD, n = 5) e frequência analítica de 0,82 µg L−1, < 0,8% e 160 h−1 para PO
43–, e 0,93 µg L−1, < 1,1% e 160 h−1 para Al(III). Comparando
com os métodos de referência, diferenças estatisticamente significativas não foram observadas quando aplicado o teste-t pareado com 95% de confiança. O teste de recuperação apresentou resultados entre 98,1 e 102,8%. O µFBA proposto apresentou portabilidade satisfatória, robustez, flexibilidade e reduzido consumo de reagentes.
In this work, a micro-flow-batch analyzer (µFBA) using webcam for spectrophotometric determination of ortho-phosphate and aluminium(III) in tap water is proposed. PO43– and
Al3+ determinations were performed by employing molybdenum blue and quecertin methods,
respectively. In order to build linear analytical curves, a mathematical model was used on the basis of the RGB (red, green and blue) values. Working ranges were from 25 to 500 µg L−1 for both
analytes with estimated limits of detection, relative standard deviation (RSD, n = 5) and sampling rate of 0.82 µg L−1, < 0.8% and 160 h−1 for PO
43–, and 0.93 µg L−1, < 1.1% and 160 h−1 for Al(III).
Comparing with the reference methods, no statistically significant differences were observed when applying the paired t-test at a 95% confidence level. Recovery study shows results between
98.1 and 102.8%. The proposed µFBA presented satisfactory portability, robustness, flexibility, low-cost device and reduced chemicals consumption.
Keywords: micro-flow-batch analyzer, digital images, RGB color system, webcam, tap water
Introduction
Recently, the micro-flow-batch analyzer (µFBA)1 was
proposed in order to improve the features of the traditional flow-batch system,2 such as portability, lower consumption
of reagents and sample, and less waste generation. As the flow-batch analyzers, this microsystem also combines favorable characteristics of both flow and batch analysis systems. The transportation of reagents, samples or other solutions into the micro-chamber (µCH) are carried out in a flow mode and, as in the batch system, the sample processing (mixture/homogenization/reaction to generate
colorful product), and absorbance measurement is carried out into µCH (micro-beaker).3
Unlike an usual analog to digital converter employed in analytical instruments affords resolution of 12 bit (4096), recent advances in digital image acquisition technology have offered video cameras (webcam) based on charge-coupled devices (CCD), which are capable to capture digital images with up to 24 bits (16.7 million colors). In fact, by using the RGB (red, green and blue) color system, the primary colors are combined in different intensities with values varying in the range 0-255 (8 bits) per color.4 Thus,
Mathematical models for digital images and RGB data have also been employed to construct analytical curves in quantitative determinations.5 Lyra et al.4 proposed a
method using the norm in an RGB three-dimensional space concept for analytical response in digital images obtained from flame emission spectrometry (FES). Maleki et al.7
used digital images for simultaneous determination of Al(III) and Fe(III) in alloys using chrome azurol S (CAS) as the chromogenic reagent. The RGB based artificial neural network (ANN) models were built from digital images of the Al(III)-CAS and Fe(III)-CAS complexes.
Recently, Wongwilai et al.8 employed a webcam for
real time detection in the course of an acid-base titration by means of color change in phenolphtalein indicator for increasing acid concentration in the solution of an automatic flow system. Lima et al.9 demonstrated that a webcam with
CCD sensor can be coupled to µFBA and used as digital image-based method for quantitative tannin determinations in green tea.
The content of phosphorus in tap water sample is an important index to evaluate the quality of water in environmental monitoring. Molybdenum blue spectrophotometric method10 was a general method to the
determining of phosphorus in the ortho-phosphate form (PO43–), which had the advantages of high sensitivity,
less interference and better stability.10,11 Therefore,
the molybdenum blue method seems promising to be adopted as a basis for the development of a miniaturized automatic method using digital images for ortho-phosphate determination.
Aluminium(III) ion occurs into the environment by natural processes and also from anthropogenic sources.12 The toxic effects (it provokes encephalopathy,
osteomalicia and microcytic anemia) are well-known also to patients with chronic renal failure.13 This ion is considered
to be one of the risk factors to Alzheimer’s disease.14
Although it is present in low concentrations in tap water, Al(III) is commonly used as flocculating agent in potable water treatment units, and produces problems due to excess (or insufficient) coagulant, particularly during periods of fast variation in water quality.15,16
Quercetin is a well-known photometric reagent for determination of Al(III) traces in water and in biological samples. As described by Norfun et al.,17 it forms a stable
complex with Al(III) and is relatively free from interfering species commonly present in water. Thus, quercetin seems promising to be adopted as a basis for the development of a µFBA method using digital images for determination of Al(III) in water.
In the present study, an automatic µFBA method using digital images with solenoid micro-pumps is proposed for
determining of ortho-phosphate and aluminium(III) using a webcam and RGB data in tap water. The phosphorus and aluminium determinations were performed by employing the molybdenum blue and quecertin methods, respectively. The colored complexes formed by these methods can be quantitatively analyzed by digital images from webcam as detector. µFBA is a novel alternative for automatic determination of these ions in tap water, comparing satisfactorily to the recently methods described in the literature.10,11,17,18
Experimental
Reagent solutions
All reagents were of analytical grade and freshly distilled and deionized water (> 18 MΩ cm−1) was used to
prepare all solutions.
For spectrophotometric determination of aluminium(III), a stock solution of 100.0 mg L−1 aluminium(III) was
prepared as previously17,19 from pure (> 99.0% w/w, Sigma)
product by dissolving the appropriate mass of aluminium chloride hexahydrate in 0.10 mol L−1 hydrochloric acid
solution.
Quercetin stock solution (1000.0 mg L−1) was prepared
as previously17,19 from the pure product (Sigma) dissolving
an appropriate weight and using an ethanol/water solution (60%, v/v). The surfactant solution was prepared by dissolving 0.0127 g of cetyltrimethylammonium bromide (CTAB) (Sigma), in an acetate buffer solution with a concentration of 0.10 mol L−1, at a pH of 5.5.
The stock phosphorus solution (100 mg L−1) was
prepared by appropriate dilution of potassium dihydrogen phosphate (KDP) (Sigma). The standard solutions (ranging from 0.10 to 10.0 mg L−1 of phosphorus) were prepared by
mixing the stock solution with the acid solutions (H2SO4, HNO3 and H2O2, all 1% v/v) (Sigma) and were used for
plotting the analytical curve in µFBA.
A 340 mmol L−1 solution of ascorbic acid (C 6H8O6)
(Sigma) was prepared by weighing 6 g of ascorbic acid and dissolving it in 100 mL of distilled water. A 5.4 mol L−1
sulfuric acid solution was prepared by transferring an aliquot of 30 mL of concentrated H2SO4 in 100 mL of water.
As described by Norfun et al.,17 aluminium(III)
determination required the addition of a masking agent, which consisted of 0.625 g of thiourea (Sigma), 0.1 mol L−1
ascorbic acid (15.0 mL) and 0.1 mol L−1 1,10-phenanthroline
(25.0 mL). Then, the pH of the sample was adjusted to 5.5 with 1 mol L−1 sodium hydroxide (Sigma), transferred into
subsequently analyzed by the proposed µFBA method. For the preparation of the stock solution of 32 mmol L−1
ammonium molybdate (Sigma), 20 g of salt were weighed and dissolved in 400 mL of water. After 4 h agitation, the solution was transferred to a 500 mL volumetric flask and the volume was completed with water.
The stock solution of 9 mmol L−1 potassium antimony
tartrate (Sigma) was prepared by weighing 3.0 g of potassium antimony tartrate and dissolving them in distilled water. The solution was then transferred to a 1000 mL volumetric flask and the volume completed with distilled water. This solution was stored in amber glass bottles under refrigeration.
The reagent solution was prepared by mixing 35 mL of concentrated sulfuric acid in 500 mL of water, then adding 215 mL of stock solution of 0.032 mol L−1 ammonium
molybdate and 72 mL of 9 mmol L−1 potassium tartrate and
antimony. The mixture was transferred to a 1000 mL flask and the volume completed with water. A solution of nitric acid (10% v/v) was used to clean the microsystem fabricated.17
Sample preparation
Tap water samples were collected from different sources in the city of João Pessoa, Paraíba, Brazil. The samples were filtered through 0.45 µm cellulose membrane filters, acidified with nitric acid (1% v/v), and stored in polyethylene bottles before analysis.
Apparatus
To fabricate the micro-chamber (µCH) in urethane-acrylate resin with glass slides, it was used a commercial UV light source (Fotolight-MD2-A4, Carimbos Medeiros Ltda, Brazil), with two sets of mercury lamps (BLB-15W-T8, SCT black light).1
For layout design of the µCH, the CorelDraw® X5
program was used. The layout printing was on polyester transparency films for laser printing using an HP LaserJet P2014. After UV exposure, channels on the substrate were revealed by the removal of the non-exposed resin with an ultrasonic bath (model UltraCleaner 800, Unique, Brazil), as previously.3
A spectrophotometer model 8453 Hewlett-Packard diode array UV-Vis, equipped with cuvette (with an inner volume of about 4 mL and an optical path of 1.0 cm), was used for absorbance measurements when employing the reference method.
A Microsoft LifeCam Cinema 720p HD 30FPS was used in conjunction with LabVIEW® 7.1 software (National
Instruments®) to control the µFBA system. The images
were captured by means of the software written in Delphi (version 3.0).
The webcam was connected to the USB port of an Intel Core2Duo 2 Gigabytes notebook (PC) and configured to capture 24-bit digital images (16.7 million colors) at a rate of 30 frames s−1 and a 640 pixels × 480 pixels spatial
resolution.
Fabrication process and assembly of the µFBA system
The homemade µCH with two glass slides and total volume about 110 µL was built in urethane-acrylate photoresist using the methodology described elsewhere.9
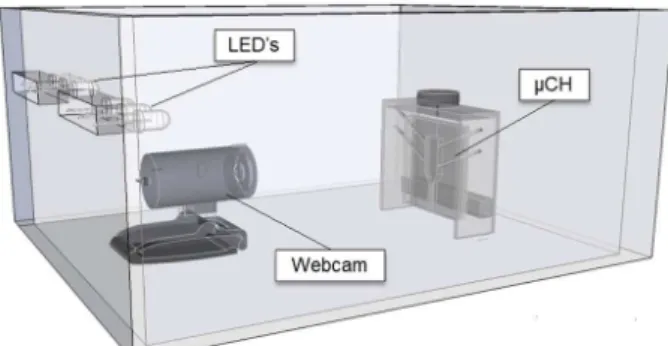
This microsystem is mounted onto a suitable support in a black (darkroom) box measuring 17 cm × 11 cm × 9 cm to preserve the system from the effects of spurious environmental radiation while in operation (Figure 1).
Six white high intensity LEDs (NPE, Thailand) were arranged in the wall behind the webcam in order to give a constant light intensity throughout the experiment. The interior walls of the box were covered with white paper in order to provide uniform illumination and reduce glare.
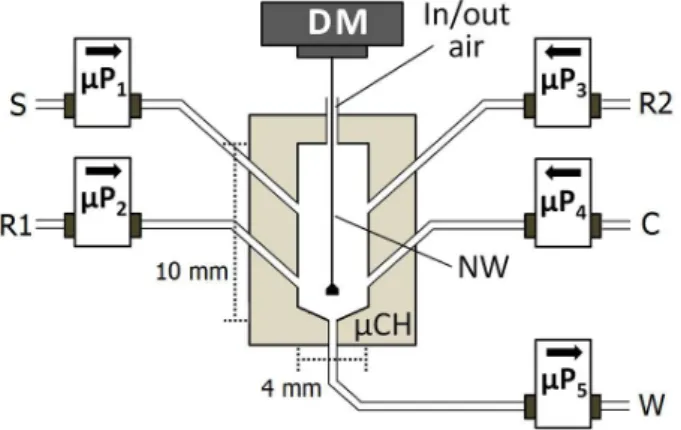
The fluids are added with solenoid micro-pumps with nominal values of 8 µL (µP1-µP4) and 20 µL (µP5) per pulse (Biochem Valve Inc., Boonton, NJ, USA). Teflon® tubes
with 0.5 mm internal diameter were used for fluid transport. A 0.4 mm nylon wire was used within µCH to ensure an efficient homogenization. The nylon wire was coupled to a CD/DVD-ROM motor drive (model MDN3GT3CPAC, 2000 rpm, 5 V dc).
Analytical procedure
determinations. The solenoid micro-pumps were actuated at 5 Hz, yielding flow rates from 0.96 mL min–1 (µP
1 at
µP4) and 2.4 mL min−1 (µP5).
Ortho-phosphate determination
The reagents ammonium molybdate with potassium antimony tartrate (4 pulses, adding 32 µL by µP2), ascorbic acid (4 pulses, adding 32 µL by µP3) and sample or
standard solution (4 pulses, adding 32 µL by µP1) were simultaneously added. The homogenization was performed by the drive motor (DM) coupled to the nylon wire (NW) by 2 s. After these steps, digital images are then captured and µCH is emptied (5 pulses, removing 96 µL by µP5).
Afterwards, µCH is cleaned by activation of µP4
(12 pulses), adding 96 µL of cleaning solution (10% v/v HNO3) while activated, and DM is activated for 2 s
performing the agitation. Then, µP5 is activated (5 pulses) to discard the contents of the µCH. This cleaning and discard procedure must be done twice to effectively clean the µCH.
The procedure for in line blank preparation is similar to described for the sample analysis. The difference is that 0.1 mol L–1 H
2SO4 solution is used instead of the sample
or standard solutions.
Aluminium(III) determination
The sample or standard solutions (4 pulses, adding 32 µL by µP1), quercetin solution (4 pulses, adding 32 µL by µP2) and CTAB solution (4 pulses, adding 32 µL by
µP3) were simultaneously added. The homogenization was performed by the drive motor (DM) coupled to the nylon wire (NW) by 2 s. After these steps, the digital images are then captured and µCH is emptied (5 pulses, removing 96 µL by µP5).
Afterwards, µCH is cleaned by activation of µP4
(12 pulses), adding 96 µL of water and DM is activated for 2 s performing the agitation. Then, µP5 is activated (5 pulses)
to discard the contents of µCH. This cleaning and discard procedure must be done twice to effectively clean µCH.
The procedure for in line blank preparation is similar to described for the sample analysis. The difference is that water of µP4 (12 pulses) is used instead of the sample or standard solutions.
The treatment of digital images and mathematical model
The treatment of the captured digital images was made by means of a second software also written in Delphi (version 3.0). The routine with the working stages of this software is similar to that used elsewhere6,9 and
illustrated in Figure 3. Initially the user selects the most homogeneous region in the image which will define the coordinates of the selected region, and will also be used for all other images. Then, the software scans all the pixels, column by column, to extract the RGB component for each pixel and calculate a mean integer value of each RGB component. These mean values are used in the
Table 1. Switching course of the solenoid micro-pumps for the determination of ortho-phosphate and aluminium(III) in the proposed µFBAa
Step Description µP1 µP2 µP3 µP4 µP5 Pulse time / s
1 addition of the sample and reagents (S, R1 and R2) b 1/0 1/0 1/0 0 0 4 1.6
2 homogenization using the drive motor (DM) 0 0 0 0 0 0 2.0
3 capture digital images 0 0 0 0 0 0 1.0
4 Waste (W) 0 0 0 0 1/0 5 2.0
5 Cleaning (C) c, d 0 0 0 1/0 0 12 4.8
6 homogenization using the drive motor (DM) d 0 0 0 0 0 0 2.0
7 waste of cleaning (W) d 0 0 0 0 1/0 5 2.0
aCodes 1/0 and 0 indicate actuation of the solenoid micro-pumps and that the devices remain inactive, respectively. b2 pulses for each actuation of the
micro-pump. cCleaning of the micro-chamber with water (for the aluminium) or 10% HNO
3 solution (for the ortho-phosphate). dThe step 5 to 7 are
repeated twice for every sample.
Figure 2. (a) µFBA manifold with its dimensions. Micro-chamber (µCH); solenoid micro-pumps (µP1-µP5); drive motor (DM); nylon wire (NW); sample or standard solutions (S); waste (W). For ortho -phosphate determination: R1, ammonium molybdate with antimony and potassium tartrate; R2, ascorbic acid; C, cleaning solution (10% HNO3).
RGB-based value calculation (analytical response) as described below.
The RGB-based values were calculated by means of a mathematical model developed from the concept of vector norm “||ν||”,6 calculated as shown in equation 1:
(1)
where R–s–b, G–s–b and B–s–b result from the difference between the R–s, G–s and B–s average values obtained from digital images of the standard solutions and samples and R–b, G–b, andB–b, from the blank.
As a result, a linear relationship was observed between the analyte concentration (C) in the standards solution (or sample) and RGB data, for which the following equation is valid:
||ν|| = kC (2)
As demonstrated in previous work,6 equation 2 provides
the basis for building µFBA analytical curves, establishing a linear relationship between ||ν|| (RBG data value adopted as
analytical response) and analyte concentration in standards solutions. Furthermore, the vectors associated with the digital images from each analyte should be positioned on the same support line in the RGB three-dimensional space.
Batch reference method
For comparison, the proposed µFBA performance was evaluated against a molybdenum blue method (reference method).20 Standard solutions were prepared from 1.0 to
10.0 mg L−1. The analytical signals (absorbance) were
measured at a maximum absorbance of around 882 nm. The analysis of each sample was performed in triplicate and the concentrations were calculated from the analytical curve.
The reference spectrophotometric procedure for aluminium(III) in water analysis was carried out according to standard methods (Standard Methods, 20th ed., Method
3500-Al B, Eriochrome cyanine R method).21 The analyses
were performed at a maximum absorbance of around 535 nm.
Results and Discussion
µFBA parameters
Volumes of reagents and samples to be added inside µCH during the automatic procedure were evaluated in order to improve the sensitivity and reproducibility of the analytical signal. The system value selection (univariate method) was carried out in conformance with studies by Chuan-Xiao et al.10 (for PO43–) and Norfun et al.17 (for Al3+).
For both methods, volumes of 32 µL of sample (or standard solution) and reagents were selected as the best compromise between reproducibility and sensitivity considering the volume used in the total mixing chamber (about 96 µL). The range evaluated and values selected for each parameter are shown in Table 2. If need, other sample dilutions may be carried out in line by simply changing the operational parameters in µFBA control software. Figure 3. Routine of the software for digital image treatment.
Table 2. Selected parameters of the proposed µFBA for determination of PO43– and Al(III) using digital images
Parameter PO4
3– Al(III)
Evaluated range Selected value Evaluated range Selected value
Sample volume / µL 8-80 32 8-80 32
Volume of reagent 1a / µL 8-64 32 8-64 32
Volume of reagent 2b / µL 8-64 32 8-64 32
Total volume / µL 48-112 96 48-112 96
aAmmonium molybdate with potassium antimony tartrate (for PO
43– determination) or quecertin (for Al(III) determination). bAscorbic acid (for PO43–
The captured digital images
Figure 4 shows the digital images obtained from six standard solutions with different concentrations. The first image of the sequences is the blank solution. All images represent a selected area equal to 35 × 55 pixels. As can be seen in Figure 4, the images present an increase in the intensity for the color dark purple with analytical concentration in each standard solution.
E a c h s a m p l e d i m a g e w a s a m a t r i x w i t h 640 × 480 pixels and the delimited region by the user has been a matrix with about 35 pixels × 55 pixels. The pixel resolution was 87×87 dots in-1. The RGB-based value
calculations are based on the product 2R × 2G × 2B, where
R, G and B are the red, green and blue color components, respectively. These components may assume integer values in a range from 0 to 7, reaching up to 16,777,216 colors.
Other linear relationships between complex color and the ratios B/R, B/G, B/Itot (Itot = RGB), and log (B) were also studied to possibly maximize precision, as already done in other works.19 However, in all cases, the results were poor
when compared to using vector norm for concentration of the complex formed. The statistical quality of the regression was verified by the residuals and analysis of variance (ANOVA). They confirmed the homoscedastic distribution of residuals and a significant linear regression.
Potential interfering ions
Natural water is a complex matrix presenting several chemical species, as ions, which could cause interferences in the analysis of interest. Thus, it is necessary to test the effect of the ion coexistence on the color reaction for the determination of the studied ions. In this sense, a set of assays was performed in order to establish the tolerance limit of the proposed methods. It was considered as a tolerable limit the interferent concentration of foreign ions that produced an error up to a 5% deviation in the
determination of ortho-phosphate and aluminium(III) alone on comparing with measurements obtained in the absence of the assayed substance.
For the determination of ortho-phosphate, some ions usually present in water were selected according to the literature17 and results obtained are summarized in Table 3.
As can be see, the spectrophotometric procedure has a wide tolerance for the assayed chemical species and severe interferent effects do not take place, at a relatively low concentration level. Compared with the spectrophotometric method, factors that do not influence the determination would not have any effect for the present method. Therefore, the proposed spectrophotometric method using digital images has a satisfactory practicability.
For the determination of Al(III) effects of interfering ions (Table 3) were again evaluated in a similar way as made by Norfun et al.17 Briefly, the maximum w/w ratio of interfering solutions containing 50 µg L−1 Al(III) and
different concentrations of some metals which might be present in waters were tested, and the absorbances were measured. All tested cations and anions caused interference < 5% for the determination of the analyte of interest. However, Cu(II), Fe(II) and Fe(III) were again observed as the most serious interferences. Thus, a solution containing thiourea, ascorbic acid and 1,10-phenanthroline was also used as masking for Cu(II), Fe (II) and Fe(III), as adopted by Norfun et al.17
Table 3. Summary of the interference effects of possible ions on the peak height obtained from 50 µg L−1 of ortho-phosphate and aluminium(III) ions
Foreign ion Tolerable concentration ratioa / (µg L−1)
Ortho-phosphate
Ca2+, Mg2+ 5.0 × 10⁵
Al3+, Fe3+ 3.0 × 10⁵
Mn2+, SO
42– 2.5 × 10⁵
Co2+ 2.0 × 10⁵
Cu2+ 5.0 × 10⁴
Cd2+ 4.0 × 10⁴
Aluminium(III)
Na+, Cl– 1.0 × 10⁶
Mn2+, Ni2+, SO
42– 5.0 × 10⁵
Mg+ 2.0 × 10⁵
PO43– 1.5 × 10⁵
Ca2+, Zn2+ 5.0 × 10⁴
Fe2+ b, Fe3+ c, Cu2+ d 1.0 × 10⁴ aThe concentration of an ion is considered to be interfered when causing a
relative error of more than ± 5% with request to the signal PO43– and Al3+
alone. b0.01 mol L−1 1,10-phenantroline as masking agent. c0.006 mol L−1
ascorbic acid + 0.01 mol L−1 1,10-phenantroline as masking agent. d0.25%
thiourea as masking agent. Figure 4. Digital image captured and selected area (35 × 55 pixels),
the complex color in some standard solutions (µg L–1) and blank:
The µFBA applications
For the ortho-phosphate determination in tap water, the regression equation was A = 15.4796 + 0.0214 C, where A is the analytical response and C is the analytic concentration in µg L−1 of PO
43–. The linear correlation coefficient (r)
was 0.9995 (n = 5) in the range between 25.0 to 500 µg L−1
(25, 50, 100, 250 and 500 µg L−1). For the determination
of Al3+ in tap water using the µFBA system, the regression
equation was A = 21.1871 + 0.0298 C, where C is the aluminium(III) concentration in µg L−1 in the measuring
solution. The squared linear correlation coefficient was 0.996 (n = 5) in the range between 25.0 to 500.0 µg L−1
(25, 50, 100, 250 and 500 µg L−1).
All analytical curves were statistically validated by analysis of variance (ANOVA), showing no significant lack of fit in the proposed models at a 95% confidence level. The limit of detection (LOD) and the limit of quantification (LOQ) for both methods were estimated based on the criteria established by International Union of Pure and Applied Chemistry (IUPAC).22 LOD was
evaluated as 3 times the standard deviation of the blank measurement and LOQ was evaluated as being 10 times the standard deviation of the blank measure. For the PO43–
determination, LOD and LOQ were 0.82 and 2.75 µg L−1,
respectively; and for the Al(III) determination, LOD and LOQ were 0.92 and 3.09 µg L−1, respectively.
Table 4 presents the results for the proposed µFBA, and the reference spectrophotometric method for PO43–
and Al(III) determinations in tap water.20,21 No statistically
significant differences were observed between the results at a confidence level of 95% when applying the paired t-test. The relative standard deviation (RSD) was less than
1.1 and 0.8%, for the ortho-phosphate and aluminium(III), respectively, from three replicates.
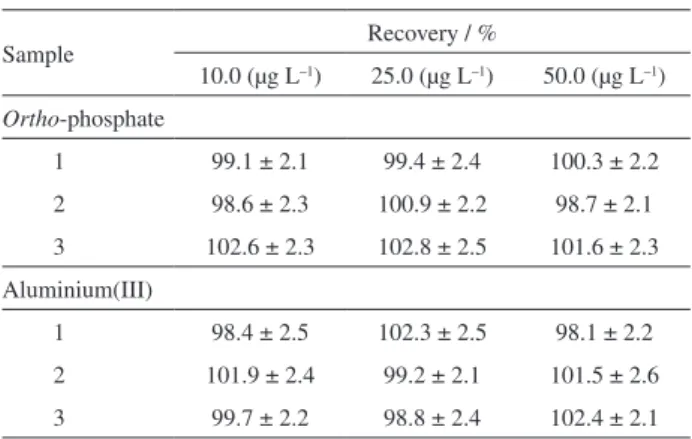
Recovery tests were also performed and, in this case, three samples were used for each analyte. 1.0 mL standard solution with known concentrations of 10.0, 25.0 and 50.0 µg L−1 for each analyte was added to 9.0 mL of the
tap water (21.4, 85.4 and 109.2 µg L−1 of PO
43–, and 45.8,
69.1 and 112.1 µg L−1 Al(III)), for measurement using the
proposed µFBA. The recovery values obtained are shown in Table 5. As can be seen, the recoveries obtained for each of the samples were within the 98.1-102.8% range.
It is worth noting that a solution containing thiourea, ascorbic acid and 1,10-phenanthroline was used as masking for Cu (II), Fe (II) and Fe(III). Nevertheless, the question concerning to the use of 1,10-phenanthroline as a masking reagent for iron needs to be commented. Ascorbic acid is an efficient reducing reagent for Fe
Table 4. Results for ortho-phosphate and aluminium(III) determinations in tap water using the µFBA proposed and the reference method. Mean values and uncertainties are based on three analytical determinations
Sample Proposed Reference Proposed Reference
PO43– ± SDa / (µg L-1) RSDb / % PO
43– ± SDa / (µg L-1) RSDb / % Al(III) ± SDa / (µg L-1) RSDb / % Al(III) ± SDa / (µg L-1) RSDb / %
1 65.2 ± 0.3 0.4 64.9 ± 0.2 0.3 28.4 ± 0.3 0.9 29.3 ± 0.1 0.4
2 46.3 ± 0.2 0.5 45.8 ± 0.2 0.4 33.8 ± 0.2 0.5 33.5 ± 0.1 0.4
3 52.7 ± 0.2 0.4 52.8 ± 0.2 0.3 21.3 ± 0.2 1.0 21.4 ± 0.2 0.9
4 56.6 ± 0.3 0.5 56.9 ± 0.1 0.2 48.6 ± 0.3 0.6 48.9 ± 0.3 0.5
5 111.8 ± 0.4 0.3 112.1 ± 0.3 0.2 44.1 ± 0.4 0.9 43.9 ± 0.3 0.7
6 68.7 ± 0.3 0.4 69.1 ± 0.2 0.2 123.7 ± 0.6 0.4 124.1 ± 0.5 0.4
7 125.1 ± 0.4 0.3 124.9 ± 0.3 0.3 109.4 ± 0.3 0.2 109.2 ± 0.1 0.1
8 45.9 ± 0.3 0.8 45.3 ± 0.2 0.5 85.3 ± 0.2 0.3 85.4 ± 0.2 0.2
9 113.8 ± 0.3 0.2 114.0 ± 0.2 0.2 97.6 ± 0.3 0.3 97.4 ± 0.2 0.2
10 80.0 ± 0.2 0.3 80.4 ± 0.2 0.2 112.9 ± 0.4 0.4 113.4 ± 0.4 0.3
aSD: standard deviation of three replicates. bRSD: relative standard deviation. cND: not detected.
Table 5. Recoveries of ortho-phosphate and aluminium(III) in tap water (n = 3)
Sample Recovery / %
10.0 (µg L–1) 25.0 (µg L–1) 50.0 (µg L–1)
Ortho-phosphate
1 99.1 ± 2.1 99.4 ± 2.4 100.3 ± 2.2 2 98.6 ± 2.3 100.9 ± 2.2 98.7 ± 2.1
3 102.6 ± 2.3 102.8 ± 2.5 101.6 ± 2.3 Aluminium(III)
1 98.4 ± 2.5 102.3 ± 2.5 98.1 ± 2.2
(III), while 1,10-phenanthroline reacts with Fe(II) and forms a compound that absorb radiation around 530 nm, so that it should cause interference. The results shown that no significant interfering effect was observed, thus for analytical proposal, the procedure was ready to use. According to Meyer et al.,23 thiourea is a versatile ligand
for iron, thus this feature would inhibit the formation of the complex with 1,10-phenatroline. In this sense, the use of 1,10-phenanthroline would be not necessary. However, such finding was not investigated in this work.
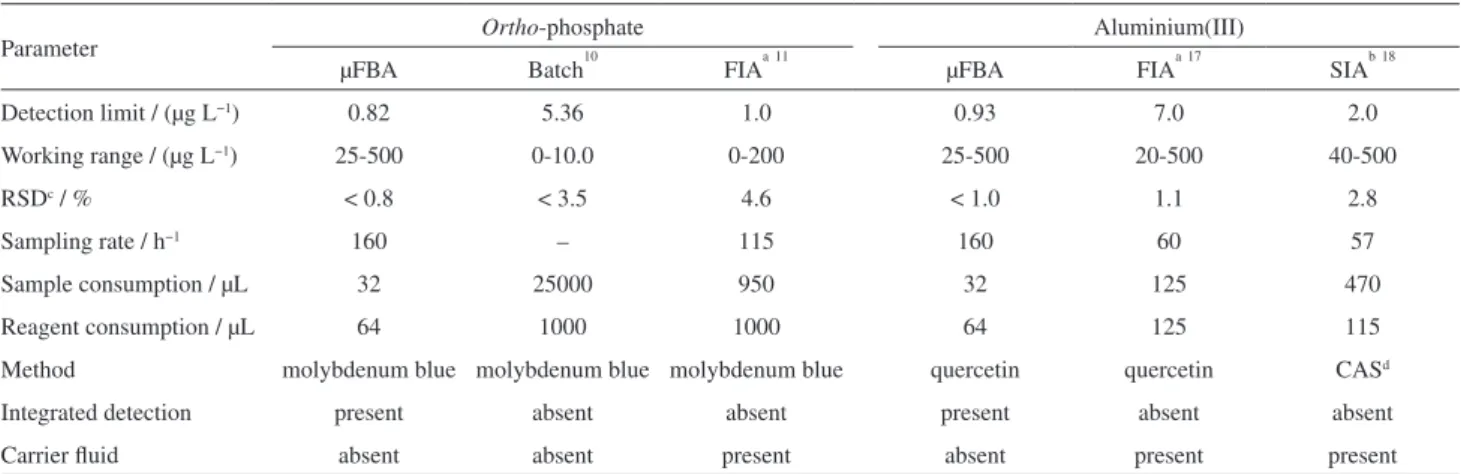
Table 6 presents selected analytical features of the proposed µFBA, and other automated systems as described in the literature for ortho-phosphate10,11 and aluminium(III)17,18 determinations in water. In general,
µFBA (compared to recently methods) presents satisfactory parameters such as limit of detection, relative standard deviation, working range, sampling rate, in line preparation of calibration solutions, elimination of the carrier fluid and no associated fluid dispersion problems, such as loss of sensitivity.
Conclusion
This study proposes a portable µFBA for photometric determination of water quality parameters. For the illustration, the analyzer was applied for determination of two important quality parameters in tap water: PO43– and
Al3+. This system presents a high sampling throughput,
thanks to optimizations in the addition times and volumes of the fluids in the microsystem that allowed homogenization efficient and discrete measurements, with lower waste generation, contributing to the basic principles of green chemistry and the advancement of microanalysis.
By the use of an inexpensive webcam for analytical detection, the proposed µFBA offers an alternative to
traditional spectrophotometric analysis. The use of the webcam dispenses the wavelength selection, which allow reduces costs and simplifies the instrumentation. With the webcam it is also possible to implement chemometric treatments due to the trivariate nature of the detection (when used RGB data), as well as the spatial-resolution characteristics inherent in digital images.
Acknowledgements
The authors would like to thank the Brazilian agencies (CNPq and CAPES) for the research fellowships and scholarships.
References
1. Lima, M. B.; Barreto, I. S.; Andrade, S. I. E.; Almeida, L. F.; Araújo, M. C. U.; Talanta2012, 100, 308.
2. Diniz, P. H. G. D.; Almeida, L. F.; Harding, D. P.; Araújo, M. C. U.; TrAC, Trends Anal. Chem. 2012, 35, 39.
3. Lima, M. B.; Barreto, I. S.; Andrade, S. I. E.; Neta, M. S. S.; Almeida, L. F.; Araújo, M. C. U.; Talanta2012, 98, 118.
4. Lyra, W. S.; Santos, V. B.; Dionízio, A. G. G.; Martins, V. L.; Almeida, L. F.; Gaião, E. N.; Diniz, P. H. G. D.; Silva, E. C.; Araújo, M. C. U.; Talanta2009, 77, 1584.
5. Gaião, E. N.; Martins, V. L.; Lyra, W. S.; Almeida, L. F.; Silva, E. C.; Araújo, M. C. U.; Anal. Chim. Acta2006, 570, 283. 6. Tôrres, A. R.; Lyra W. S.; Andrade, S. I. E.; Andrade, R. A. N.;
Silva, E. C.; Araújo, M. C. U.; Gaião, E. N.; Talanta2011, 84, 601.
7. Maleki, N.; Safavi, A.; Sedaghatpour, F.; Talanta2004, 64, 830. 8. Wongwilai, W.; Lapanantnoppakhun, S.; Grudpan, S.;
Grudpan, K.; Talanta2010, 81, 1137.
9. Lima, M. B.; Andrade, S. I. E.; Barreto, I. S.; Almeida, L. F.; Araújo, M. C. U.; Microchem. J.2013, 106, 238.
Table 6. Analytical features of the proposed µFBA and other recently procedures for determination of ortho-phosphate and aluminium(III) in natural water
Parameter Ortho-phosphate Aluminium(III)
µFBA Batch10 FIAa11 µFBA FIAa17 SIAb18
Detection limit / (µg L−1) 0.82 5.36 1.0 0.93 7.0 2.0
Working range / (µg L−1) 25-500 0-10.0 0-200 25-500 20-500 40-500
RSDc / % < 0.8 < 3.5 4.6 < 1.0 1.1 2.8
Sampling rate / h−1 160 – 115 160 60 57
Sample consumption / µL 32 25000 950 32 125 470
Reagent consumption / µL 64 1000 1000 64 125 115
Method molybdenum blue molybdenum blue molybdenum blue quercetin quercetin CASd
Integrated detection present absent absent present absent absent
Carrier fluid absent absent present absent present present
10. Chuan-Xiao, Y.; Xiang-Ying, S.; Bin, L.; Hui-Ting, L.; Chin. J. Anal. Chem.2007, 35, 850.
11. Gentle, B. S.; Ellis, P. S.; Faber, P. A.; Grace, M. R.; McKelvie, I. D.; Anal. Chim. Acta2010, 674, 117.
12. Ščančar, J.; Milačič, R.; Anal. Bioanal. Chem.2006, 386, 999. 13. Savory, J.; Bertholf, R. L.; Wills, M. R.; Clin. Endocrinol.
Metab. 1985, 14, 681.
14. Yokel, R. A. In Elements and Their Compounds in the Environment, vol. 2.; Merian, E.; Anke, M.; Ihnat, M.; Stoeppler, M., eds., Wiley-VCH: Weinheim, Germany, 2004, p. 635.
15. Tria, J.; Butler, E. C. V.; Haddad, P. R.; Bowie, A. R.; Anal. Chem. Acta2007, 588, 153.
16. Vanloot, P.; Branger, C.; Margaillan, A.; Brach-Papa, C.; Boudenne, J. L.; Coulomb, B.; Anal. Bioanal. Chem.2007,
389, 1595.
17. Norfun, P.; Pojanakaroon, T.; Liawraungrath, S.; Talanta2010,
82, 202.
18. Mesquita, R. B. R.; Rangel, A. O. S. S.; J. Braz. Chem. Soc.
2008, 19, 1171.
19. Andrade, S. I. E.; Lima, M. B.; Barreto, I. S.; Lyra, W. S.; Almeida, L. F.; Araújo, M. C. U.; Silva, E. C.; Microchem. J.
2013, 109, 106.
20. American Public Health Association (APHA), American Water Works Association (AWWA), Water Environment Federation (WEF); Standard Methods for the Examination of Water and Wastewater, 19th ed.; American Public Health Association:
Washington, DC, 1998.
21. Clesceri, L. S.; Greenberg, A. E.; Eaton, A. D.; Standard Methods for the Examination of Water and Wastewater, 20th ed.;
American Public Health Association: Washington, DC, USA, 1998.
22. McNaught, A. D.; Andrew, W.; IUPAC Compendium of Chemical Terminology, 2nd ed.; Royal Society of Chemistry:
Cambridge, UK, 1997.
23. Meyer, S.; Demeshko, S.; Dechert, S.; Meyer, F.; Inorg. Chim. Acta2010, 363, 3088.
Submitted: November 12, 2014