Review
J. Braz. Chem. Soc., Vol. 25, No. 5, 799-821, 2014. Printed in Brazil - ©2014 Sociedade Brasileira de Química 0103 - 5053 $6.00+0.00
*e-mail: [email protected]
Continuum Source Atomic Absorption Spectrometry:
Past, Present and Future Aspects – A Critical Review
Bernhard Welz,*,a,b Maria Goreti R. Vale,b,c Éderson R. Pereira,a
Ivan N. B. Castilhoa and Morgana B. Dessuyc
aDepartamento de Química, Universidade Federal de Santa Catarina,
88040-900 Florianópolis-SC, Brazil
bInstituto Nacional de Ciência e Tecnologia de Energia e Ambiente, Instituto de Química,
Universidade Federal da Bahia, 40170-115 Salvador-BA, Brazil
cInstituto de Química, Universidade Federal do Rio Grande do Sul,
91501-970 Porto Alegre-RS, Brazil
Este artigo de revisão aborda 1½ séculos de história da espectrometria de absorção atômica com fonte contínua (CS AAS), partindo dos primeiros experimentos de Kirchhoff e Bunsen nos anos 1860. Ele também tenta explicar porque a técnica foi abandonada na primeira metade do século XX, porque ela foi redescoberta nos anos 60 nos EUA, onde vários grupos de pesquisa trabalharam intensamente no desenvolvimento da CS AAS por cerca de quatro décadas e, finalmente, não obtiveram sucesso. Esta revisão também discute as principais vantagens da moderna técnica de CS AAS de alta resolução (HR-CS AAS), que usa um monocromador duplo de alta resolução e um detector com arranjo de dispositivos de carga acoplada, o qual adiciona o comprimento de onda como terceira dimensão. A literatura sobre as aplicações de HR-CS AAS foi cuidadosamente revisada. Finalmente, será feita uma tentativa de prever os avanços futuros desta técnica nova e antiga.
This review article covers 1½ centuries of history of continuum source atomic absorption spectrometry (CS AAS), starting with the early experiments of Kirchhoff and Bunsen in the 1860s. It also tries to explain why the technique was abandoned in the first half of the 20th century, why it
was “re-discovered” in the 1960s in the USA, where several research groups worked intensively on the development of CS AAS for about four decades, and why they finally failed. This review also discusses the major advantages of modern high-resolution CS AAS (HR-CS AAS), which uses a high-resolution double monochromator and a charge coupled device array detector, which adds the wavelength as third dimension to the usual display of absorbance over time. The literature about applications of this technique has been carefully revised. Finally an attempt will be made to foresee future developments of this technique, which is obviously not an easy task.
Keywords: history of continuum source AAS, background correction, non-metals determination, multi-element determination, direct solid sample analysis
1. The Early History
In the 1850s coal gas was introduced in the city of Heidelberg, Germany, for illumination of the streets, and Robert W. Bunsen (1811-1899), professor of Chemistry at the University of Heidelberg, succeeded to connect his laboratory to this gas supply. Soon after he invented the well-known Bunsen burner, the first burner in which
the two scientists. Their joint research included a detailed comparison of the emission spectra obtained with pure salts with the black lines observed in the sun’s spectrum and with absorption spectra produced in their lab. As a result
of this research, Kirchhoff1 published his basic manuscript
about the connection between absorption and emission of radiation, postulating that “any material that can emit radiation at a given wavelength can also absorb radiation of that wavelength”.
Obviously, all the spectroscopic experiments that were
carried out in the 19th century were in the visible range
using spectroscopes and observation with the naked eye; continuum radiation sources, such as electric arcs, were used for absorption measurements, as these were the only
reliable emission sources at that time.2 Towards the end of
the 19th century and at the beginning of the 20th century the ultraviolet (UV) range of the spectrum was discovered, and an intense research and development of monochromators and polychromators for atomic spectroscopy started in order to explore this spectral range. Around 1925 the first commercial atomic spectrometers became available using arcs and sparks as the emission sources and photographic plates for the detection and quantitative determination of metallic elements in the visible and UV range. Emission spectroscopy was obviously the preferred technique as it was easier to detect a small emission signal in an otherwise dark and non-luminous environment than a small reduction of the radiation over a narrow spectral range within a bright, luminous environment, as it would be for absorption measurements. Hence, atomic absorption was practically
abandoned during the first half of the 20th century.
2. Introduction of Line Source AAS
This situation only started to change in the second half
of the 20th century when Alan Walsh, who had worked at
the Commonwealth Scientific and Industrial Research Organization (CSIRO) in Australia for several years, first with molecular spectroscopy and then with atomic spectroscopy, started to wonder why absorption is generally used in molecular spectroscopy and emission in atomic spectroscopy. The result of his musing was that “there appeared to be no good reasons for neglecting atomic absorption spectra; on the contrary, they appeared to offer many vital advantages over atomic emission spectra as
far as spectrochemical analysis was concerned”.3 At the
same time, however, Walsh also realized one of the main difficulties of atomic absorption “that the relations between absorption and concentration depend on the resolution of the spectrograph, and on whether one measures peak absorption or total absorption as given by the area under the
absorption/wavelength curve”.3 He therefore precluded the
use of continuum sources for the measurement of atomic absorption spectra, as in this case a resolution of about 2 pm would be required, which was far beyond the capabilities of the best spectrometers available at that time.
This realization led Walsh to conclude that the measurement of atomic absorption requires line radiation sources with the sharpest possible emission lines, i.e., hollow cathode lamps (HCL). The task of the monochromator is then merely to separate the line used for the measurement from all the other lines emitted by the source. The high resolution demand for atomic absorption measurements is in this case provided by the line source. Walsh also postulated that the radiation source should be modulated and a synchronously tuned detection system be used. This way any radiation emitted by the sample in the atomizer produces no signal at the output of the detection system. The first publication of Alan Walsh, where he proposed the application of atomic absorption spectra to chemical
analysis, appeared at the beginning of 1955;4 however, the
success was not spontaneous. In spite of the tremendous effort that Walsh and his colleagues made to “sell” atomic absorption, there was only a very small group of scientists that was using the new technique. Part of the problem was for sure that the first commercially available instruments did not include the modulation principle, one of the key features postulated by Walsh for proper performance of the technique.
The break-through finally came in 1962, when Walsh presented the technique and the results obtained by a few laboratories in Australia to various members of the staff of the Perkin-Elmer Corporation in Norwalk, CT, USA. It was during these discussions that Chester Nimitz, the then-General Manager of the Instrument Division, asked rather tersely: “If this goddam technique is as useful as you say it is, why isn’t it being used right here in the USA?” The response of Alan Walsh: “This is due to the effect that the USA, to a certain extent, is an underdeveloped country” must have had a significant impact, as the decision of Perkin-Elmer to embark on a large-scale project related to the production of atomic absorption equipment was made shortly afterwards – the beginning of about half a century of success of line-source AAS (LS AAS).
3. Research on Continuum Source AAS in the USA
significant number of their compatriots who are convinced that all important inventions are made in the USA, and anything that comes from outside is considered as “not invented here” (NIH). Maybe this attitude also had some contribution to the search for alternatives to LS AAS in the USA. In the same year, when Walsh presented AAS
to Perkin-Elmer, he also had an invited lecture at the Xth
Colloquium Spectroscopicum Internationale, organized in Baltimore, MD, USA; it is of importance to note that the chairman of this session was Velmer A. Fassel from the Iowa State University, Ames, IA, who introduced later the inductively coupled argon plasma (ICP) for optical
emission spectrometry (OES).5 In the same session, a
William E. Grossman from the Cornell University, Ithaca, NY, gave an oral presentation with the title: “The use of continuous sources instead of hollow cathode tubes in
atomic absorption spectroscopy”.6 In their abstract the
authors wrote: “The absorbancy of a metal vapor in a flame is higher with a hollow-cathode tube than a continuous source using a conventional monochromator. However, there are many other factors that contribute to sensitivity besides the absorbancy. The stability of the source, for example, determines the level of absorption that can be detected and is an important parameter. Since tungsten sources can be better stabilized than hollow-cathode tubes, some of the loss in sensitivity, caused by the lower absorption, is recovered by the ability to observe smaller
changes”.6 Independent on the fact that the authors confused
sensitivity with signal-to-noise ratio (SNR), they used the at that time still very poor quality of HCL to demonstrate that Walsh had not considered all aspects, and the use of continuum radiation sources might be the best approach for measuring AAS.
Fassel and Mossotti published their first manuscript
on CS AAS soon after,7 and a few years later a paper,
entitled “Evaluation of spectral continua as primary sources in atomic absorption spectroscopy” was published, co-authored by Fassel and Grossman and a few others
from the Iowa State University;8 apparently, Fassel had
invited Grossman to continue his research about CS AAS at his university. In the abstract the authors claimed that “for 32 elements, the sensitivities observed for a spectral continuum primary source were either comparable to, or exceeded those presently obtained with sharp-line primary sources”. Going through the manuscript it becomes obvious that the authors one more time confused sensitivity with SNR, as they were actually comparing limits of detection (LODs). The table, in which they compare the LOD for 43 elements, is divided in three parts; part A shows 11 elements, for which the LOD using HCL is more than an order of magnitude better. A closer look at this part of the
table shows that for five of the elements (Bi, Co, Fe, Ni and Pb) less sensitive lines above 280 nm had to be used for the continuum source, which had little intensity in the spectral range below 300 nm. In addition, a number of important elements, such as As, Be, Cd, Sb, Se and Zn, are not in the list at all, as these elements have no sensitive lines at all above 280 nm. Part B of the table shows 16 elements with comparable LOD, where ‘comparable’ was defined by the authors as being within the same order of magnitude, and no comment was given on this part. Part C, finally, lists other 16 elements, for which the LOD obtained with a continuum source was more than an order of magnitude better than with a line source. However, most of the elements listed here were rare-earth elements for which no HCL, and hence no data, were available at that time – and a comparison with non-existing data is not possible. In addition, three LOD for HCL were taken from a thesis, where the LOD was defined as the analyte concentration that absorbs 5% of the incident light, which corresponds to five times the characteristic concentration, and has nothing to do with a LOD. In essence, this publication is highly biased towards the use of continuum sources; a realistic comparison should show at least 17 elements with better LOD for HCL and only three elements with better LOD using the continuum source.
This initial research created significant interest in the subject in the USA, resulting in several publications about
CS AAS,9-14 the majority of which came from the group of
Winefordner. However, around the mid 1970s a movement started, which was pioneered by Keliher at the Villanova
University, PA,15 and soon after picked up by O’Haver at
the University of Maryland,16 considering in more detail
the instrumental requirements for CS AAS. It was finally James M. Harnly who conducted all the research for the next 20 years, investigating all kinds of radiation sources, mono- and polychromators, detectors and evaluation
principles for CS AAS.17-34 Harnly and colleagues also
described the first, and up to now only, truly simultaneous multi-element atomic absorption spectrometer with a
continuum source.17,19,22,23 The only other ‘simultaneous’
CS AAS instruments described in the literature used photodiode array detectors that covered a range of only a few nanometers, and only elements that had absorption lines falling within this narrow spectral window could be
detected simultaneously.35,36
In 1989 Gary M. Hieftje37 wrote in a kind of a
sorting devices, … and entirely new detection approaches”. Hieftje was probably thinking about the work of Harnly when he wrote these sentences, as the various instruments assembled by his group seemed to have all the elements to meet the requirements put out by Hieftje. Nevertheless, the research of Harnly did not call the attention of any instrument manufacturer, maybe in part because he used exclusively components that were commercially available and obviously not optimized for the purpose.
4. Research on CS AAS in Germany
In the meantime, however, a research group at the Institute for Spectrochemistry and Applied Spectroscopy (ISAS) in Berlin, Germany, under the leadership of Helmut Becker-Ross became interested in the research of Harnly. In contrast to Harnly, however, the group at ISAS, Berlin, was all physicists with considerable experience in the design of spectrometers for various purposes. They therefore started to think about the special requirements of CS AAS, investigating different types of radiation
sources38,39 and spectrometer designs,40 and finally, in
1996, they proposed a completely new spectrometer
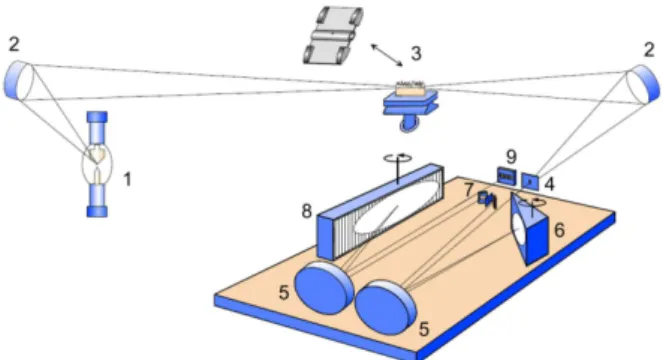
concept,41,42 consisting of a Xenon short-arc lamp operating
in a hot-spot mode, a compact high-resolution double monochromator with a prism pre-monochromator and an echelle grating monochromator for high resolution, and a linear charge-coupled device (CCD) array detector, as shown schematically in Figure 1. The same group also developed an echelle spectrograph for the simultaneous determination of an unlimited number of elements in the
range between 200 and 450 nm, using a flame atomizer,43
and published several papers about fundamental aspects of
instrumentation for continuum source AAS.44-46
In a review article, published in 1999, with the title “The future of atomic absorption spectrometry: a continuum source with a charge coupled array detector” Harnly wrote that “the future appears bright for CS AAS. Whereas previously, CS AAS was striving for parity with LS AAS, it is now reasonable to state that it is CS AAS which is setting
the standard”.47 However, neither in this publication nor in
any of the future manuscripts,48,49 Harnly cited any of the
publications of Becker-Ross and colleagues.
5. Commercial Instrumentation
Finally, at the end of the 20th century, instrument
manufacturers got interested in the design of the group of Becker-Ross; the first commercial instrument, the contrAA 300, was introduced by Analytik Jena (Jena, Germany) in 2004, and nowadays we already have a
whole family of high-resolution continuum source atomic absorption spectrometers (HR-CS AAS). No details of these instruments will be given here, as they were published in
a monograph and several articles and book chapters.50-54
It should only be mentioned that the resolution per pixel
is about 1.5 pm at 200 nm, and 200 pixels of the CCD array detector are used analytically; all of them are read out individually and simultaneously, which means that the equipment works with 200 independent detectors, which opens a wide variety of new features.
5.1. Wavelength as a third dimension
First of all, the CCD array detector adds the wavelength as a new dimension to the conventional measurement of the absorbance (for steady-state signals) or absorbance over time (for transient signals). This means we can obtain a three-dimensional display of absorbance over time and wavelength, which can be of great importance in method development and to detect and avoid spectral
interference.50 Another feature that was extensively treated
by Heitmann et al.55 is the selection of the optimum
number of pixels for the purpose; due to the fact that each pixel makes its own measurement and calculation of the absorbance or integrated absorbance, the values measured by individual pixels may be added without affecting the linearity of the calibration. In many cases the best SNR is obtained when the absorbance of 3-5 pixels is added up, and in the case of multiplets with several lines of similar sensitivity, as is the case for Mn and V, the absorbance measured at several lines of the same analyte might be
added up;55 however, if required, only one pixel or side
pixels at the wings of the analytical line may be used in order to reduce the sensitivity for the measurement of higher analyte concentrations. In addition, all secondary lines are available with essentially the same emission intensity for
the determination of high analyte concentrations, due to the use of a continuum radiation source. With an HCL, in contrast, secondary lines often have much lower emission intensity and therefore an inferior SNR.
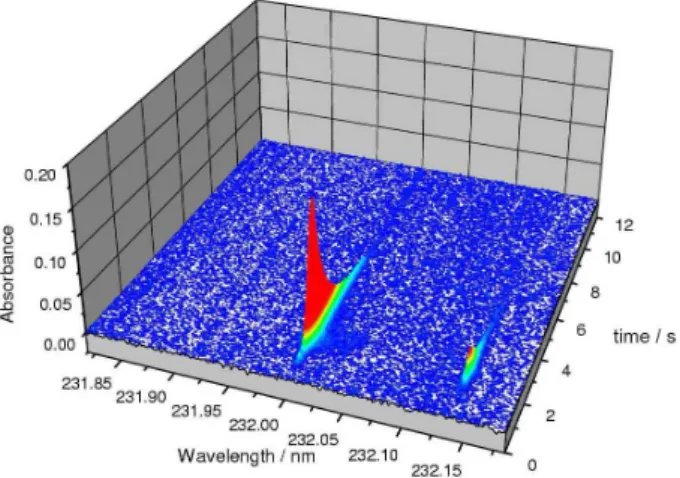
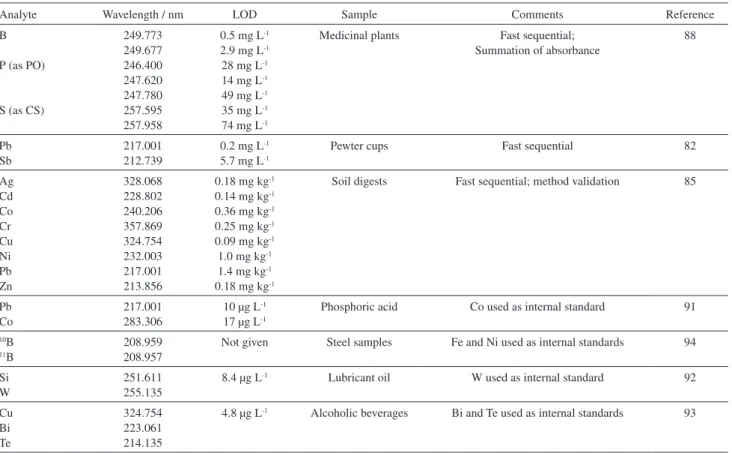
If more than one analytical line of the same element reaches the detector, and if these lines have significantly different sensitivity, the analyte can be determined simultaneously at more than one line in order to extend the working range. The first attempt in this direction was
made by Vale et al.56 in 2004, using the two nickel lines
at 232.003 and 232.138 nm (Figure 2), the sensitivity of which is about one order of magnitude different, in order to extend the working range in the determination of Ni in
crude oil and to avoid additional dilution. Resano et al.57
expanded this approach to the three nickel lines at 234.554, 234.663 and 234.751 nm, which resulted in a practical working range between 20 and 50,000 pg Ni.
5.2. Simultaneous or sequential determination using HR-CS graphite furnace AAS
Yet another feature that is available due to the use of a CCD array detector is the possibility to determine two or more elements simultaneously in cases where the lines of more than one element fall within the spectral window of the detector. The first application of this approach was reported
by Dos Santos et al.58 in 2009, determining simultaneously
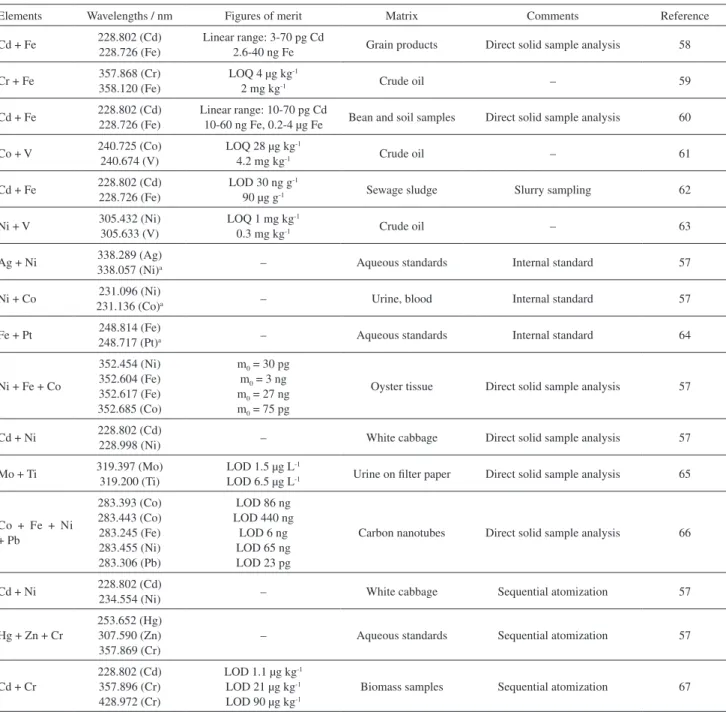
Cd at 228.802 nm and Fe at 228.726 nm, using two different atomization temperatures within the same temperature program. Table 1 shows examples where this possibility was applied successfully for simultaneous determinations using
graphite furnace (GF) atomization. Resano et al.57 reported
the simultaneous determination of three elements in oyster tissue, and they also investigated the possibility to use an
internal standard by simultaneous determination of two elements. The same authors also proposed the sequential determination of up to three analytes of different volatility from one sample injection, using three different atomization temperatures and changing the wavelength
in between the atomization cycles.57 Duarte et al.67 used
the same technique for the sequential determination of Cd
and Cr in biomass samples and their ashes. Resano et al.68
recently published a review article about the simultaneous or sequential monitoring of multiple lines in HR-CS AAS. Obviously, the number of examples in Table 1 is not very great, mostly because of the relatively small spectral range that reaches the detector for a simultaneous determination and the also relatively small number of elements that can be determined sequentially using different atomization temperatures. Nevertheless, the applicability for some special cases has been demonstrated, but the general application for a greater number of elements has to wait until real simultaneous multi-element instrumentation becomes available.
5.3. Fast sequential determination using HR-CS flame AAS
The situation is different in the case of flame AAS, where a fast sequential determination of several analytes, and also the use of the reference-element technique (internal standard) were already proposed at the beginning of this
century using conventional equipment with four HCL.69
However, the use of line sources for this approach was shown to be a serious limitation, as in most practical
applications only two elements were determined,70-74 or one
analyte and an internal standard;75,76 however not more than
three77,78 or four analytes79,80 although theoretically more
elements could be determined using multi-element HCL. In contrast, an unlimited number of analytes is available for fast sequential determination using high-resolution continuum source flame atomic absorption spectrometers (HR-CS F AAS), as the continuum source emits all wavelengths, and only a change of the wavelength is necessary to go from one analyte to the next. This obviously also includes the possibility of
selecting more than one line per analyte for elements
with a wide concentration range in order to extend the linear working range and to select the appropriate pixels to further adjust the conditions for a specific application. In addition, the software can change flame composition, stoichiometry, and burner height to previously optimized conditions within about a second. This makes possible to determine each analyte under optimized conditions, which is clearly preferable to a simultaneous determination under compromised conditions.
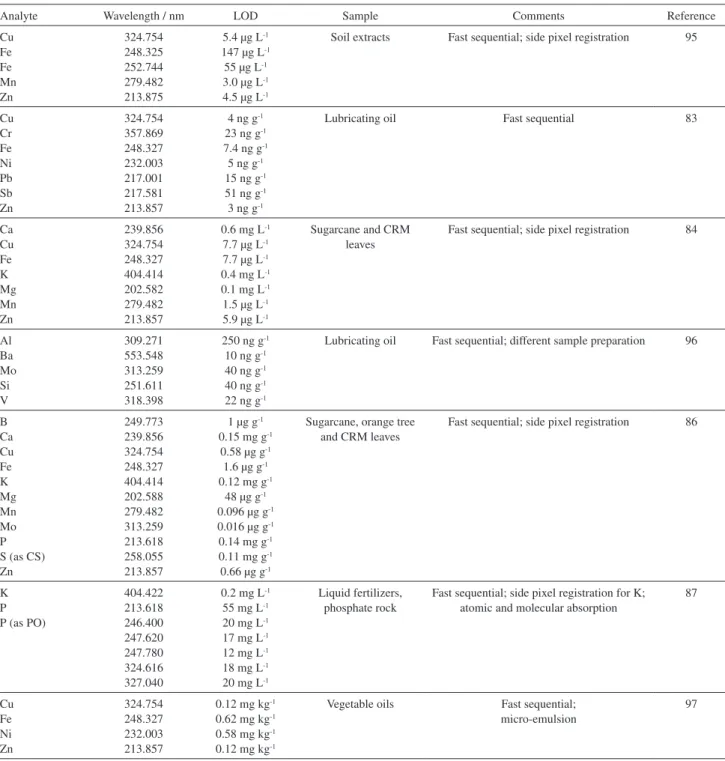
Although there are some publications where only two elements were determined, such as Ca and Mg in dairy products,81 or Pb and Sb in pewter alloy cups,82 there are also investigations that include many more elements. Amorim
Filho et al.83 determined seven elements in lubricating oil,
investigating different sample preparation procedures. De
Oliveira et al.84 also determined seven elements in plant
leaves for foliar diagnosis of the nutritional status. They used the main analytical lines for copper, iron, manganese and zinc and secondary lines for calcium, magnesium and zinc. The authors also investigated side-pixel registration
to reduce the sensitivity and extend the linear working
range for the determination of magnesium. Frentiu et al.85
determined eight elements in soil samples and validated the fast sequential analysis for routine application. De
Oliveira et al.86 even determined 11 elements in plant
leaves, using side pixel registration for elements that were
present at high concentration. Borges Ferreira et al.87
determined potassium and phosphorus in liquid fertilizers and phosphate rock using side pixel registration for K and both, atomic and molecular (as PO) absorption for the determination of phosphorus at several wavelengths.
Table 1. Simultaneous or sequential determination (from the same sample aliquot) of two or more analytes using HR-CS GF AAS
Elements Wavelengths / nm Figures of merit Matrix Comments Reference
Cd + Fe 228.802 (Cd) 228.726 (Fe)
Linear range: 3-70 pg Cd
2.6-40 ng Fe Grain products Direct solid sample analysis 58
Cr + Fe 357.868 (Cr)358.120 (Fe) LOQ 4 µg kg2 mg kg-1 -1 Crude oil – 59
Cd + Fe 228.802 (Cd)228.726 (Fe) Linear range: 10-70 pg Cd10-60 ng Fe, 0.2-4 µg Fe Bean and soil samples Direct solid sample analysis 60
Co + V 240.725 (Co) 240.674 (V)
LOQ 28 µg kg-1
4.2 mg kg-1 Crude oil – 61
Cd + Fe 228.802 (Cd) 228.726 (Fe)
LOD 30 ng g-1
90 µg g-1 Sewage sludge Slurry sampling 62
Ni + V 305.432 (Ni)305.633 (V) LOQ 1 mg kg0.3 mg kg-1-1 Crude oil – 63
Ag + Ni 338.289 (Ag)338.057 (Ni)a – Aqueous standards Internal standard 57
Ni + Co 231.096 (Ni)
231.136 (Co)a – Urine, blood Internal standard 57
Fe + Pt 248.814 (Fe)248.717 (Pt)a – Aqueous standards Internal standard 64
Ni + Fe + Co
352.454 (Ni) 352.604 (Fe) 352.617 (Fe) 352.685 (Co)
m0 = 30 pg m0 = 3 ng m0 = 27 ng m0 = 75 pg
Oyster tissue Direct solid sample analysis 57
Cd + Ni 228.802 (Cd)
228.998 (Ni) – White cabbage Direct solid sample analysis 57
Mo + Ti 319.397 (Mo) 319.200 (Ti)
LOD 1.5 µg L-1
LOD 6.5 µg L-1 Urine on filter paper Direct solid sample analysis 65
Co + Fe + Ni + Pb
283.393 (Co) 283.443 (Co) 283.245 (Fe) 283.455 (Ni) 283.306 (Pb)
LOD 86 ng LOD 440 ng
LOD 6 ng LOD 65 ng LOD 23 pg
Carbon nanotubes Direct solid sample analysis 66
Cd + Ni 228.802 (Cd)
234.554 (Ni) – White cabbage Sequential atomization 57
Hg + Zn + Cr
253.652 (Hg) 307.590 (Zn) 357.869 (Cr)
– Aqueous standards Sequential atomization 57
Cd + Cr
228.802 (Cd) 357.896 (Cr) 428.972 (Cr)
LOD 1.1 µg kg-1
LOD 21 µg kg-1
LOD 90 µg kg-1
Biomass samples Sequential atomization 67
Table 2. Fast sequential determination of several analytes using HR-CS flame AAS
Analyte Wavelength / nm LOD Sample Comments Reference
Cu Fe Fe Mn Zn 324.754 248.325 252.744 279.482 213.875
5.4 µg L-1
147 µg L-1
55 µg L-1
3.0 µg L-1
4.5 µg L-1
Soil extracts Fast sequential; side pixel registration 95
Cu Cr Fe Ni Pb Sb Zn 324.754 357.869 248.327 232.003 217.001 217.581 213.857
4 ng g-1
23 ng g-1
7.4 ng g-1
5 ng g-1
15 ng g-1
51 ng g-1
3 ng g-1
Lubricating oil Fast sequential 83
Ca Cu Fe K Mg Mn Zn 239.856 324.754 248.327 404.414 202.582 279.482 213.857
0.6 mg L-1
7.7 µg L-1
7.7 µg L-1
0.4 mg L-1
0.1 mg L-1
1.5 µg L-1
5.9 µg L-1
Sugarcane and CRM leaves
Fast sequential; side pixel registration 84
Al Ba Mo Si V 309.271 553.548 313.259 251.611 318.398
250 ng g-1
10 ng g-1
40 ng g-1
40 ng g-1
22 ng g-1
Lubricating oil Fast sequential; different sample preparation 96
B Ca Cu Fe K Mg Mn Mo P S (as CS) Zn 249.773 239.856 324.754 248.327 404.414 202.588 279.482 313.259 213.618 258.055 213.857
1 µg g-1
0.15 mg g-1
0.58 µg g-1
1.6 µg g-1
0.12 mg g-1
48 µg g-1
0.096 µg g-1
0.016 µg g-1
0.14 mg g-1
0.11 mg g-1
0.66 µg g-1
Sugarcane, orange tree and CRM leaves
Fast sequential; side pixel registration 86
K P P (as PO)
404.422 213.618 246.400 247.620 247.780 324.616 327.040
0.2 mg L-1
55 mg L-1
20 mg L-1
17 mg L-1
12 mg L-1
18 mg L-1
20 mg L-1
Liquid fertilizers, phosphate rock
Fast sequential; side pixel registration for K; atomic and molecular absorption
87 Cu Fe Ni Zn 324.754 248.327 232.003 213.857
0.12 mg kg-1
0.62 mg kg-1
0.58 mg kg-1
0.12 mg kg-1
Vegetable oils Fast sequential; micro-emulsion
97
Bechlin et al.88 determined boron, phosphorus (as PO)
and sulfur (as CS) in medical plants, investigating the summation of the absorbance of several lines in order
to improve the limits of detection. Virgilio et al.89
investigated several lines of the CS and the HS molecules for the determination of sulfur in fungicides and
sulfate-based fertilizers. Matusiewicz and Krawczyk90 determined
eight hydride-forming elements in a variety of certified reference materials (CRM) and real samples using hydride
generation-atom trapping combined with HR-CS F AAS using solution and slurry sampling. All papers published up to date on the fast sequential determination of more than one element using HR-CS FAAS are summarized in Table 2.
ideally be used determining the analyte and the reference element simultaneously, all the fast sequential approaches
appear to improve the results. Raposo Junior et al.91
determined lead in phosphoric acid using cobalt as an internal standard and tested various elements as internal standard for the determination of Si in lubricating oil;
tungsten provided the best results.92 The same authors
also investigated various elements as potential internal standards for the determination of Cu in alcoholic beverages
and found that Bi gave the best results.93 Wiltsche et al.94
finally tried to determine the 10B/11B isotope ratio in steel
samples using Fe and Ni as internal standards to correct for monochromator instability. The publications about the reference-element technique are also included in Table 2.
5.4. Background correction in HR-CS AAS
Another outstanding feature of HR-CS AAS is its unmatched background correction (BC) capability, which is also based on the use of a linear CCD array detector instead of a photomultiplier tube or a solid-state detector in LS AAS, which are integrating over the spectral range transmitted by the exit slit. The first system for automatic BC in LS AAS, proposed by Koirtyohann and
Pickett,98 used a continuum source, usually a deuterium
lamp, to measure the background absorption, which is then subtracted from the total absorption measured with the HCL. By definition, this BC works only when the background is uniform within the spectral interval transmitted by the exit slit of the monochromator, but it is used successfully even nowadays, particularly in flame AAS. Another BC system, which is based on the high-current pulsing of HCL, was introduced by Smith and
Hieftje;99 as the background is measured on both sides of
the analytical line, it is also limited to background that is continuous within the measurement range. In addition, this technique can only be used for flame AAS, as the HCL needs a relaxation time after a high-current pulse, so that the measurement frequency is too low for the transient signals of GF AAS. The most successful technique to correct for background absorption in LS GF AAS is Zeeman-effect BC with an alternating magnetic field at the graphite tube
atomizer.100 This technique was improved significantly
over the past decades with a variety of new features and
can nowadays be considered mature.101 Nevertheless, there
are still two limitations that might affect the accuracy of this BC technique: firstly, when the background is due to a near-by atomic line or a molecular band with rotational fine
Analyte Wavelength / nm LOD Sample Comments Reference
B
P (as PO)
S (as CS)
249.773 249.677 246.400 247.620 247.780 257.595 257.958
0.5 mg L-1
2.9 mg L-1
28 mg L-1
14 mg L-1
49 mg L-1
35 mg L-1
74 mg L-1
Medicinal plants Fast sequential; Summation of absorbance
88
Pb Sb
217.001 212.739
0.2 mg L-1
5.7 mg L-1
Pewter cups Fast sequential 82
Ag Cd Co Cr Cu Ni Pb Zn
328.068 228.802 240.206 357.869 324.754 232.003 217.001 213.856
0.18 mg kg-1
0.14 mg kg-1
0.36 mg kg-1
0.25 mg kg-1
0.09 mg kg-1
1.0 mg kg-1
1.4 mg kg-1
0.18 mg kg-1
Soil digests Fast sequential; method validation 85
Pb Co
217.001 283.306
10 µg L-1
17 µg L-1
Phosphoric acid Co used as internal standard 91
10B 11B
208.959 208.957
Not given Steel samples Fe and Ni used as internal standards 94
Si W
251.611 255.135
8.4 µg L-1 Lubricant oil W used as internal standard 92
Cu Bi Te
324.754 223.061 214.135
4.8 µg L-1 Alcoholic beverages Bi and Te used as internal standards 93
CRM: certified reference material.
structure, and the background without and with a magnetic field is not the same, the correction is erroneous, as was
shown by Heitmann et al.42 for the PO molecular absorption
in the vicinity of the Cd resonance line. Secondly, when the background signal changes very rapidly with time, artifacts might be observed, as the measurements of total absorption (without magnetic field) and background absorption (with magnetic field) are inevitably sequential. Independent of that, a magnet at the atomization unit makes the whole system complex and expensive.
5.4.1. Correction for continuous background
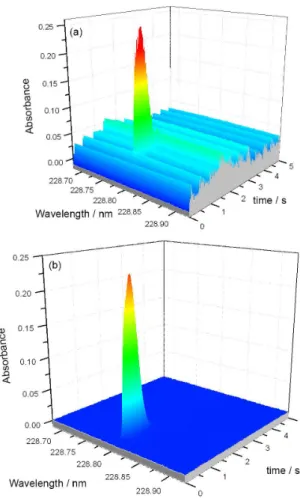
In HR-CS AAS, in contrast, the software of the instrument selects automatically (or the operator might select manually) correction pixels on both sides of the analytical line, which do not show any absorption lines. Any increase or decrease of the radiation intensity that is the same for all correction pixels will then be corrected automatically to the baseline. This includes any short-term change in the emission intensity of the radiation source (flicker noise), as well as any background absorption that is continuous within the spectral window reaching the CCD detector. This means that the signal output is already corrected for lamp noise and any continuous background, i.e., with an extremely low noise level, as is shown in Figures 3a and 3b. This is also in contrast to LS AAS, where any of the BC systems has a significant contribution to the baseline noise, which will increase at least by a factor of two or even much more, and will influence precision, LOD and the limit of quantification (LOQ).
5.4.2. Least squares background correction
What remains after this automatic correction for continuous background is the atomic absorption of the analyte and of concomitants if they have absorption lines within the spectral range of the detector. There also remains the absorption spectrum of any diatomic molecule that has an absorption band with rotational fine structure
within the spectral range of the analyte absorption.50 All
these absorption phenomena are displayed as a 3D image by the software, which makes it very easy to recognize potential spectral interference and to correct for it. Firstly, any concomitant absorption that does not coincide with the analyte absorption in wavelength and/or in time does not cause any problem due to the high resolution of the double monochromator and does not need any corrective action. Only in the rare case of a direct or partial overlap of the concomitant absorption with the analyte line, further measures have to be taken. The instrument software offers in this case the so-called least-squares background
correction (LSBC) using reference spectra.50
A fundamental requirement for the correction of fine-structured background via reference spectra is that the spectrometer is equipped with an accurate mechanism for wavelength stabilization. This feature is included in all commercial instruments, using the lines of an internal neon lamp, which fixes the absorption line with an accuracy of a few percent of a pixel, i.e., less than 0.1 pm. In addition, the reference absorbance spectra (Aref,ipixel) of the number i of molecules causing fine-structured background at the analyte wavelength position must be known (usually it is not more than one or two). These reference spectra are then used as independent linear functions in a least-squares fitting algorithm and fitted to each absorbance spectrum. The individual absorbance spectra corrected for fine-structured background are calculated as follows:
(1)
The molecule correction factors ascan,i, which are
a measure of the strength of the different reference
Figure 3. Time-resolvedabsorbance spectrumfor cadmium in a fertilizer
absorbance spectra for the corresponding scan, are obtained by omission of the pixels at the analyte wavelength position, since the actual analyte absorption must not influence the background correction procedure. In practice, this correction procedure is much simpler than it sounds, as there are only a few diatomic molecules that are stable at the temperatures used for atomization, such as PO, NO, SiO, CS, and the correction is done automatically within a few seconds.
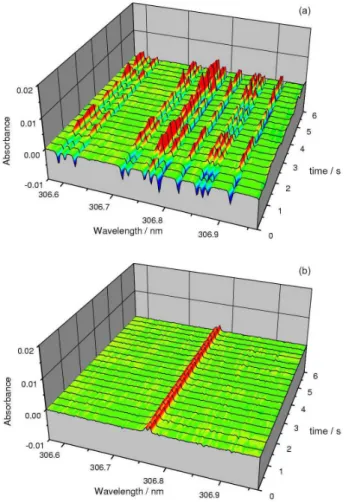
This LSBC can be used with flame and with graphite furnace atomization. A typical example for an application of LSBC with a flame atomizer is shown in Figures 4a and 4b for the determination of Bi at 306.772 nm using
an air-acetylene flame.50 Any flame used in AAS exhibits
the spectrum of the OH radical due to the reaction of the fuel gas (acetylene, hydrogen) with the oxidant (air,
N2O). As the OH spectrum is produced equally for the
sample solution and the calibration and blank solutions, there will be no systematic error due to that; however, as the production of the OH radical in a flame is subject to fluctuations, it contributes significantly to the baseline noise, as shown in Figure 4a. If an analyte has an absorption line in the vicinity of the OH absorption spectrum, this will significantly influence precision, LOD and quantification. It is sufficient to record and store the absorption spectrum of the pure flame within the spectral range of interest and subtract it from the sample spectrum using LSBC to arrive at an essentially noise-free baseline, as shown in Figure 4b. The same thing can obviously be done when the interfering molecular spectrum is due to a matrix component; the only difference is that in this case the origin of the interference has to be found, which is facilitated by using the ‘Line Identification’ tool in the software, and a pure reference spectrum be generated for correction.
Another application of LSBC is to correct for direct line overlap, such as that of a secondary iron line at 213.859 nm
with the main resonance line of zinc at 213.856 nm.50,103 In
case the interfering element (in this case iron) has another absorption line within the spectral window that reaches the detector array (e.g., the iron line at 213.970 nm), firstly, the sensitivity ratio between the two lines has to be determined. Then the absorbance is measured at the 213.856-nm Zn line and at the 213.856-nm Fe line, and finally the proportional absorbance calculated from the ratio between the two iron lines is subtracted from the absorbance measured at the Zn line; obviously, all these calculations are again carried out automatically by the software of the computer.
In HR-CS GF AAS, LSBC is mostly used to correct for the absorption of di-atomic molecules, such as NO, PO, SiO, etc., with a rotational fine structure that coincides with the absorption lines of the analyte. Molecules, like atoms,
can absorb radiation in the UV and visible range of the spectrum, which results in a transition of an electron from the outer shell of an atom to an excited state. The major difference compared to atomic spectroscopy, where such a transition results in a single narrow absorption line, is that such a transition is accompanied by induced vibrational and rotational transitions, resulting in broad band spectra instead of line spectra. The only exceptions to this are di-atomic molecules in the gaseous state, where the rotational fine-structure can be resolved under normal analytical conditions by a high-resolution monochromator. Greater molecules usually cannot exist at the temperatures in flames and furnaces, and the few tri-atomic molecules that have been observed have such a great number of rotational lines that they cannot be resolved anymore and appear as a band structure as in UV-Vis spectrometry.
Table 3 gives an overview of publications where LSBC was used successfully in HR-CS FAAS and GF AAS. There are not too many examples in the literature for the
Figure 4. Influence of the OH molecular absorption in an air/acetylene
flame on the determination of bismuth in the vicinity of the 306.772 nm absorption line; aqueous standard of 500 µg L-1 Bi; (a) without correction;
application of LSBC; this is due to the fact that, in case there is no direct overlap of the molecular structures with the atomic absorption signal, there is no need to correct for it due to the high resolution of the spectrometer. In HR-CS GF AAS there is the additional possibility to separate in time the atomic and the molecular absorption using an appropriate temperature program. An example for this is shown in Figure 5. For the same reason there is for example no need to correct for the direct line overlap of iron on zinc, as the absorption signals of Zn and Fe can be separated in time.
5.5. Molecular absorption spectrometry
5.5.1. Molecular absorption spectrometry with low-resolution AAS equipment
These spectra of diatomic molecules in flames and furnaces, however, should not only be considered as interference. Already back in the 1970s, Fuwa and
colleagues117-119 in Japan began to investigate the molecular
spectrum of PO in an air-acetylene flame and finally succeeded to determine phosphorus at 246 nm with an atomic absorption spectrometer using a deuterium lamp
and a nitrous oxide-acetylene flame. Soon after, Dittrich120
in Germany started to investigate carefully the spectra of gallium and indium halides for the determination of halogens in a graphite furnace, using hydrogen HCL and a dual-channel spectrometer. Dittrich also published
two review articles about the subject,121,122 and several
Table 3. Use of least-squares background correction to correct for molecular absorption with fine structure or direct line coincidence with atomic lines of concomitants
Atomizer Analyte Wavelength / nm Interfering species Sample Comments Reference
Flame Pb 283.306 OH Aqueous standard – 50
Bi 306.772 OH Aqueous standard – 50
Zn 213.856 Fe Iron and steel Direct line coincidence 50,103
Zn 213.856 Cu High-purity copper Direct line coincidence 50
GF As 193.696 NaCl, PO Urine – 104
Se 196.026 NO, PO Urine – 104
Tl 276.787 Unidentified (S-based)
Marine sediments Direct solid sample analysis 105
Pb 217.001 PO Biological CRM Direct solid sample analysis 106
Ni 232.003, 232.138 C2 – Filter furnace 107
P 213.547, 213.618 PO – Different correction systems and
modifiers
108-110
Al 396.152 Unidentified (sugar and Fe)
Solutions for hemodialysis – 111
Ag 328.068, 338.289 Sulfur-containing molecule (SO?)
Rocks and ores Direct solid sample analysis 112
Sb 231.147 SiO, PO Sediments Direct solid sample analysis 113
Ni 232.003, 232.138 SiO Coal, charcoal, carbon black Direct solid sample analysis 114
V 318.341, 318.397, 318.538
Unidentified (S-based)
Coal, charcoal, carbon black Direct solid sample analysis 114
Au 242.795 PO Mouse tissue Direct solid sample analysis 115
AlF 227.477 Unidentified Whole blood – 116
other researchers started to work in the same field in the 1980s and 1990s. Most of them used HCL, the lines of which coincided accidentally with the spectra of diatomic molecules, and conventional LS AAS equipment. The publications using this approach are summarized in a more
recent review article;123 however, this technique never found
general acceptance and was finally abandoned in the mid 1990s, mostly because of the limitations of conventional LS AAS regarding resolution and background correction.
5.5.2. Molecular absorption spectrometry with HR-CS flame AAS equipment
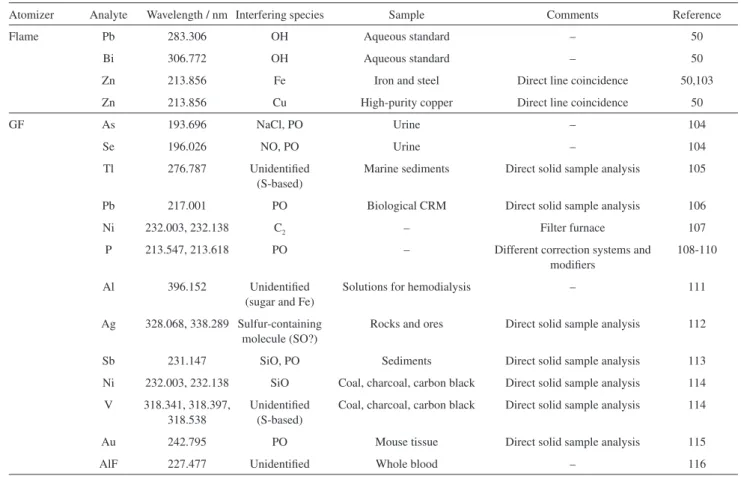
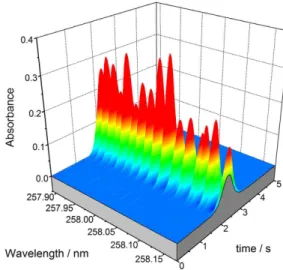
This situation changed completely with the introduction of HR-CS AAS, firstly, as the spectrometer of this equipment is capable of resolving the rotational fine structure of the spectra of diatomic molecules, as is shown in Figure 6 for the CS molecule, and secondly, because, due to the use of a high-intensity continuum source, any wavelength between 190 and 900 nm is available for absorption measurements. In addition, pixels that are in the ‘valleys’ between the rotational lines, can be used for effective correction of background absorption. In essence there are two different situations: some molecules are forming spontaneously in flames and furnaces, such as PO or CS; if this is not the case, an appropriate molecule has to be ‘synthesized’ by the addition of a high concentration of a ‘molecule-forming reagent’ to the samples and standard solutions, similar to the addition of a chemical modifier or buffer. One condition, however, has to be met in any case: the target molecule must be thermally stable enough in order not to dissociate significantly at the temperatures that are typically used in flames and furnaces. As a rule of thumb, bond dissociation
energy of > 500 kJ mol-1 appears to be ideal.
The research on molecular absorption spectrometry (MAS) in flames using HR-CS AAS instrumentation was pioneered by the group of Becker-Ross at ISAS, Berlin,
Germany. Huang et al.124,125 investigated the determination
of phosphorus by molecular absorption of phosphorus monoxide (PO) in an air-acetylene flame at 324.62 nm and investigated carefully potential interferences. The addition of titanium removed signal suppression due to Ca and Mg.
Huang et al.126 also investigated the determination of sulfur
by molecular absorption of carbon monosulfide (CS) in an air-acetylene flame at 258.056 nm; the only serious interference they found was due to high concentrations of Pb, which resulted in precipitation of PbS. The same authors also reported the determination of fluorine via the molecular absorption of the gallium fluoride (GaF) molecule at
211.248 nm,127 and of chlorine via the molecular absorption
of the indium chloride (InCl) molecule at 267.24 nm.128
These and some more recent publications about the
determination of non-metals via HR-CS flame MAS are compiled in Table 4.
Another very interesting work was published by
Huang et al.129 using MAS for the speciation analysis
of different sulfur forms, including free and total sulfur dioxide in wine. The authors, among other things, used the
fact that free SO2 is liberated from the sample to the vapor
phase in the nebulization process, and hence transported to the flame almost quantitatively. In contrast to this, only about 5% of all the other sulfur contents reach the flame, whereas the rest goes down the drain, as is well known for burner chambers typically used in AAS. The same effect was observed by Kowalewska for the determination
of sulfur in petroleum derivatives using flame MAS.130
The major problem was that in this case there might be several different sulfur compounds of different volatility in petroleum derivatives, which might reach the flame to a different and unknown extent, which impeded quantitative determination.
5.5.3. Molecular absorption spectrometry with HR-CS GF AAS equipment
The group of Becker-Ross was also pioneering the research about the determination of non-metals via MAS in a graphite furnace (GF MAS) using HR-CS AAS
equipment. Heitmann et al.136 published a preliminary
study about the determination of phosphorus, sulfur, fluorine and chlorine using GF MAS. Similar to flame MAS, phosphorus monoxide, PO, is forming spontaneously also in the graphite furnace and does not need a chemical
modifier. Heitmann et al. reported an LOD of 0.9 ng P at
the 246.40 nm band head. For the determination of sulfur,
Figure 6. Time-resolved absorbance spectrum of the CS molecule in the
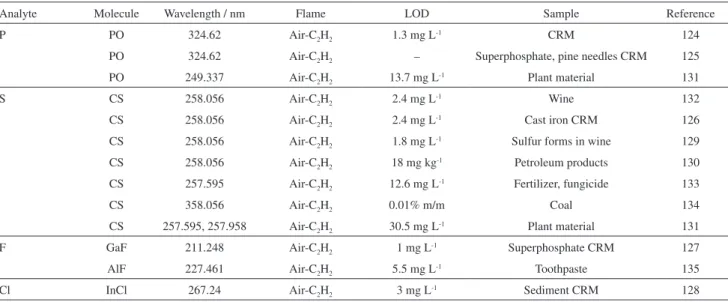
Table 4. Determination of non-metals via molecular absorption in flames
Analyte Molecule Wavelength / nm Flame LOD Sample Reference
P PO 324.62 Air-C2H2 1.3 mg L-1 CRM 124
PO 324.62 Air-C2H2 – Superphosphate, pine needles CRM 125
PO 249.337 Air-C2H2 13.7 mg L-1 Plant material 131
S CS 258.056 Air-C2H2 2.4 mg L-1 Wine 132
CS 258.056 Air-C2H2 2.4 mg L-1 Cast iron CRM 126
CS 258.056 Air-C2H2 1.8 mg L-1 Sulfur forms in wine 129
CS 258.056 Air-C2H2 18 mg kg-1 Petroleum products 130
CS 257.595 Air-C2H2 12.6 mg L-1 Fertilizer, fungicide 133
CS 358.056 Air-C2H2 0.01% m/m Coal 134
CS 257.595, 257.958 Air-C2H2 30.5 mg L-1 Plant material 131
F GaF 211.248 Air-C2H2 1 mg L-1 Superphosphate CRM 127
AlF 227.461 Air-C2H2 5.5 mg L-1 Toothpaste 135
Cl InCl 267.24 Air-C2H2 3 mg L-1 Sediment CRM 128
the authors found it necessary to coat the platform with Zr and to introduce methane gas during the pyrolysis stage as an alternate gas in order to promote the formation of the CS molecule. Like in flame MAS, the authors used the absorption of the GaF molecule for the determination of fluorine, but they preferred the AlCl molecule to determine chlorine. In all of these cases it was found necessary to coat the platform with Zr as a permanent modifier in order to obtain reliable results.
Soon after, Huang et al.137 reported the determination
of bromine using the molecular absorption of AlBr at 278.914 nm and of CaBr at 625.315 nm; each of the lines had advantages and disadvantages regarding interferences from matrix constituents. The latter one showed interferences due to HF, and high Na and K concentrations, which were not observed with the former one. However, interferences due to phosphoric and sulfuric acid were observed for AlBr, but not for CaBr. The same authors also reported the determination of iodine via the spectrum of barium mono-iodide, BaI, at
538.308 nm;139 however, they found significant interference
from chloride, fluoride, iron, potassium and sodium, which might complicate the determination of iodine in real samples.
Finally, Huang et al.139 also reported the determination of
nitrate using the NO absorption line at 215.360 nm; however, the authors also found strong interference from several acids and metal ions, which they tried to overcome by using a pyrolysis temperature of only 150 °C. Some more details about these publications are given in Tables 5 and 6.
Phosphorus is kind of a special case, as this analyte can be determined both by AAS using the non-resonance doublet at 213.547/213.618 nm, and by MAS using one of the rotational lines of PO, such as the band heads at
234.62 or 246.40 nm. Lepri et al.108 found that without the
addition of any chemical modifier, PO is formed almost exclusively in the vaporization stage; however, the addition of a chemical modifier, such as Pd, favors the formation of atomic P in a graphite furnace and inhibits the formation of PO almost completely. They therefore concluded that the formation of atoms is easier to control than the formation of
PO molecules. Resano et al.140 made a careful comparison
between HR-CS GF AAS and HR-CS GF MAS for the determination of phosphorus in biological CRM using direct solid sample analysis. For AAS it was necessary to use W as a permanent chemical modifier together with palladium and ascorbic acid in solution, and an atomization temperature of 2650 °C. For MAS it was sufficient to use W as a permanent modifier and a vaporization temperature of only 1900 °C; however, the LOD with AAS was 4.9 ng P, whereas that for MAS was 21 ng, summing nine PO lines between 213.508 and 213.646 nm. In addition, some spectral interference due to NO was observed; hence, the decision which analytical technique should be preferred might depend on the analytical task.
Sulfur cannot be determined by AAS, as all its absorption lines are below 190 nm, a spectral range not accessible with this technique; hence, MAS adds one more analyte to the list of elements that can be determined using HR-CS GF AAS equipment. Most authors used the CS
molecule, proposed by Huang et al.126,132 for flame MAS,
and by Heitmann et al.136 for GF MAS, although slightly
different wavelengths have been chosen by some of the authors in order to avoid minor spectral interference, as
shown in Table 5.141-143 Resano et al.142 also investigated
to improve the LOD by a factor of 3. Kowalewska,130 who found it almost impossible to determine sulfur in petroleum products using flame MAS because of the very much different volatility of the various sulfur compounds, succeeded to determine sulfur at least in the heavier crude oils using GF MAS.
The formation of the CS molecule in HR-CS GF MAS is considered a spontaneous reaction, as there appears to be sufficient carbon available in the graphite tube atomizer.
Nevertheless, it was already observed by Heitmann et al.136
that the tube or platform surface has to be coated with a carbide-forming element in order to avoid direct contact between the sample and the graphite, a practice that was also used by all other authors (see Table 5). The reason for this is to avoid a competitive reaction between sulfur and carbon that results in the formation of the highly volatile carbon
disulfide, CS2, which is actually produced on a large scale
using this reaction.141 Hence, the CS molecule might be a
good choice for the determination of sulfur in case the sample contains sufficient carbon, such as biological samples, petroleum products or coal (see Table 5); however, it might
not form spontaneously in other cases. Baumbach et al.146
investigated therefore the SnS molecule, which has already been proposed by Parvinen and Lajunen in the 1990s for the
determination of sulfur using LS AAS.147 It might well be
that this molecule is better suited for the determination of sulfur in samples that do not contain sufficient carbon for the formation of CS, such as digested samples.
Heitmann et al.136 used the rotational fine structure of the GaF molecule to determine fluorine in zinc ore and single cell protein CRM after digestion using the analyte addition technique to control potential interference. They coated the graphite platform with Zr and used Mg as an additional
chemical modifier. Gleisner et al.148 also using GaF as the
target molecule, investigated various additional modifiers
in order to improve sensitivity, and succeeded to determine fluorine in natural and drinking water samples using
aqueous solutions for calibration. Later, Gleisner et al.149
reported the determination of total and soluble fluorine in toothpaste using slurry sampling and aqueous standards for calibration. The results were in good agreement with a headspace gas chromatographic method with mass
spectrometric detection. Morés et al.150 investigated the
CaF molecule for the determination of fluorine in tea after different ways of sample preparation; they found that in this case no additional modifier is required, as Ca acts as molecule forming agent and also as chemical modifier, simplifying the procedure significantly. This was confirmed by Ozbek and Akman in the determination of fluorine
in milk and waste water CRM.151 The same authors also
investigated the SrF molecule for the determination of
fluorine in water.152 Bücker and Acker153 investigated the
AlF molecule for the determination of fluorine in process etching solutions, using barium as an additional chemical modifier. Krüger et al.154 reported an interesting application determining 5-fluorouracil in cancer cells using GaF as the target molecule and calcium as an additional chemical
modifier. Ozbek and Akman155 investigated the absorption
of the SrF molecule at 651.187 nm. Some more details about these publications are given in Table 6.
A very interesting work was published by Qin et al.,156,157 in which they described an off-line coupling of reverse-phase high-performance liquid chromatography (HPLC) with HR-CS GF MAS for the speciation analysis of organo-fluorine compounds. Fractions of the eluents of the isocratic separation were collected and placed in the autosampler of the HR-CS AAS equipment for the determination of the fluorine content, using the absorption line of the GaF molecule at 211.248 nm. Several modifiers, including Zr, Pd, Mg and sodium acetate, were used. The
Table 5. Determination of sulfur using HR-CS GF MAS
Molecule Wavelength / nm Modifier LOD Sample Preparation Reference
CS 258.056 Zr + Ca + CH4 2.3 ng Spinach, peach leaves CRM Digestion 136
CS 258.033 W + Pd 15 ng Biological CRM Direct solid sample
analysis
141
CS 257.958
Sum of 6 lines
Ru and Pd nanoparticles
9 ng 3 ng
Steel, coke, PE, biological CRM Direct solid sample analysis
142
CS 258.033 Ru 30 ng Coal, coal CRM Direct solid sample
analysis
143
CS 258.056 Ir + Pd 3.5 ng Food, food CRM Direct solid sample
analysis
144
CS 258.056 Pd + Mg 14 ng Petroleum products Dilution in xylene 130
CS 257.592 None 0.15 mg L-1 Coal and ash Slurry sampling 145
SnS 271.578 Zr 0.16 ng Water Direct analysis 146
results were compared with those obtained by HPLC electrospray ionization mass spectrometry (ESI-MS), and HR-CS GF MAS was shown to be an effective detector for fluorine speciation analysis; nevertheless, the off-line coupling might not be very suitable for routine analysis.
Besides the early paper of Heitmann et al.,136 only one
more paper has been published about the determination
of chlorine using HR-CS GF MAS. Fechetia et al.158 used
an Al-Ag-Sr modifier, which was injected together with the sample solution to determine Cl in food samples. Two different sample preparation procedures were investigated: an acid digestion with nitric acid at room temperature and
a digestion with Ag, HNO3, and H2O2, where chlorine is
precipitated as low-soluble AgCl, which is then dissolved with ammonia solution. The results obtained with the latter method were found to be in good agreement with certified values for the investigated CRM. The mixed modifier caused some spectral interference, which could, however, be easily corrected using LSBC.
The determination of bromine is hampered by the relatively low dissociation energy of its diatomic molecules,
as was already observed by Huang et al..138 Only two
additional papers were published on this topic. The first
one is by Limburg and Einax159 for the determination of Br
in organobromine compounds and flame retardants using the absorption line of the CaBr molecule at 625.315 nm. The authors used Zr as a permanent modifier and a Pd-Mg modifier added in solution, and they found better performance when a graphite tube without platform was used. Nevertheless, the authors found interferences due to fluoride, chloride, iodide, sulfate, aluminum and iron, which might limit the applicability of the method. Flórez
and Resano160 determined bromine in plastic material
using direct solid sample analysis and aqueous standard solutions for calibration. Some additional information on the determination of halogens using HR-CS GF MAS may be found in Table 6.
The determination of iodine by HR-CS GF MAS is also hampered by the low dissociation energies of
its molecules. Huang et al.138 used the BaI molecule,
which has the relatively highest dissociation energy of
327 kJ mol-1 to determine iodine in an iodine pill and a
thyroid hormone pill using the analyte addition technique; however interference due to a number of concomitants was reported. No other publication about the determination of iodine has appeared up to now, most likely due to the difficulties associated with the low dissociation energy of the iodine molecules.
Table 6. Determination of halogens using HR-CS GF MAS
Analyte Molecule Wavelength / nm Modifier LOD Sample Treatment Reference
F GaF 211.248 Zr, Mg 9 pg Zinc ore, single cell protein CRM Digestion 136
GaF 211.248 Zr, Pd, Ru, sodium acetate
5.2 pg Water Direct 148
GaF 211.248 Zr, Pd, NH4H2PO4 5.2 pg Toothpaste Slurry 149
CaF 606.440 None 1.6 ng Tea Digestion, infusion 150
CaF 606.440 None 260 pg Milk, waste water CRM Direct 151
SrF 651.187 None 550 pg Water Direct 152
AlF 227.46 Ba 145 pg Process etching solutions Dilution 153
GaF 211.248 Ca 33 pg 5-Fluorouracil in cancer cells Dilution 154
SrF 651.187 Zr – Investigation of mechanisms – 155
GaF 211.248 Zr, Pd, Mg, sodium acetate
– Speciation analysis of organo-fluorine compounds separated by HPLC
Dilution 156
GaF 211.248 Zr, Pd, Mg, sodium acetate
– Speciation analysis of organo-fluorine compounds separated by HPLC
Dilution 157
Cl AlCl 261.42 Sr 70 pg Rye flour Digestion 136
AlCl 261.418 Al, Ag, Sr 9 µg g-1 Food samples Digestion 158
Br AlBr
CaBr
278.914 625.315
None 2 ng Salt, pharmaceutical sample Dissolution 137
CaBr 625.315 Zr, Pd-Mg 78 pg Organo-bromine compounds, flame retardants
Digestion 159
CaBr Various Pd 1.3-5 ng Plastic CRM Direct solid sample
analysis
160
Huang et al.139 also used the absorption line of the NO molecule at 215.360 nm to determine nitrate in different CRM using HR-CS GF MAS and Ca as a modifier. Interferences were avoided using a pyrolysis temperature of
only 150 °C. Bücker and Acker153 reported a determination
of nitrate in silicon wafer etching solutions using the NO absorption at 214.803 nm and lanthanum as a modifier.
Brandao et al.161 proposed a different approach for the
determination of nitrite using a chemical generation of NO and its determination in a non-heated quartz cell at
215.360 nm. NO was generated in 0.4 mol L-1 HCl with
1.5% (m/v) ascorbic acid as the reducing agent; the authors
reported an LOD of 45 µg L-1 nitrite.
Aramendia et al.116 made the surprising proposal to
determine Al, which can obviously be determined directly with AAS, using the molecular absorption of AlF. The
authors used NH4F·HF as the molecule-forming reagent
and also as the chemical modifier and monitored the line at 227.402 nm using five pixels. Spectral interference was observed in the determination of Al in blood, which could be corrected using LSBC. The method was applied to forensic drowning diagnosis analyzing blood and drowning water.
There were also two review articles published recently
by Butcher162 and Resano et al.163 about molecular
absorption spectrometry using high-resolution AAS equipment, which might be of interest for the reader.
5.6. Direct analysis of solid samples
The direct analysis of solid samples using AAS is as old as the technique itself, particularly when a graphite tube furnace is used for atomization.2,164 In 1998 Kurfürst165 published a book about this technique, and there appeared
at least two review articles more recently,166,167 describing
the advantages and limitations of this technique for sample introduction and analysis, which will not be repeated here. Hence, direct solid sample analysis is not directly related to HR-CS GF AAS; however, it has been shown that HR-CS GF AAS makes direct solid sample analysis much easier and much more reliable, mostly due to the fact that the spectral environment of the analytical line can be displayed at high resolution, and due to the superior background correction capabilities.167
The more recent publications about direct solid sample analysis using HR-CS GF AAS or MAS are shown in Table 7. Several of these publications have been discussed before in a different context, such as the simultaneous
determination of Cd and Fe in grain products58 and in
bean and soil samples,60 the simultaneous and sequential
atomization of Cd and Ni in white cabbage CRM,57 the
simultaneous determination of Co, Fe and Ni in oyster
tissue CRM,57 the simultaneous determination of Co,
Fe, Ni and Pb in carbon nanotubes,66 or the sequential
atomization of Cr, Hg and Zn in aqueous standards,57 and of
Cd and Cr in biomass and ashes.67 The analyzed materials
include airborne particulate matter collected on glass fiber filters,168,171,175 coal,143,169,173,176 and activated charcoal and
carbon black.114 It is only natural that direct solid sample
analysis was already applied equally for the determination
of non-metals, such as Br in plastic materials160 or sulfur
in wide variety of samples.141-144 Essentially, all these
measurements were carried out using aqueous standard solutions for calibration, which means without spectral or non-spectral interference. This is, besides the rigorous use of the stabilized temperature platform concept in order to
control non-spectral interferences,178 due to the unsurpassed
background correction capability of the HR-CS AAS instruments. An impressive example of that is shown in
Figure 7 for the determination of Sb in sediment CRM.113
Table 7. Publications about direct solid sample analysis using HR-CS GF AAS and MAS
Analyte Wavelength / nm Modifier Matrix Calibration Comments Reference
Ag 328.068
338.289
None Geological CRM Aqueous standards for soils and sediments; solid CRM for rocks
and ores
Interference due to sulfur 112
Ag 338.289 Ru permanent Air particulate matter Aqueous standard solutions – 168 Br (via CaBr) Various Pd Plastic materials Aqueous standard solutions – 160
Au 242.795 – Mouse tissue – – 115
Cd 228.802 Ir permanent Coal Aqueous standard solutions – 169
Cd + Cr 228.802 (Cd) 357.896 (Cr) 428.972 (Cr)
None Biomass samples – Sequential atomization 67
Cd + Fe 228.802 (Cd) 228.726 (Fe)
– Grain products Aqueous standard solutions Simultaneous determination 58
Cd + Fe 228.802 (Cd) 228.726 (Fe)
Analyte Wavelength / nm Modifier Matrix Calibration Comments Reference Cd + Ni 228.802 (Cd)
228.998 (Ni)
– White cabbage – Simultaneous determination 57
Cd + Ni 228.802 (Cd) 234.554 (Ni)
– White cabbage – Sequential atomization 57
Co 240.725 None Biological material Aqueous standard solutions Comparison with alkaline solubilization
170
Co + Fe +Ni 352.685 (Co) 352.604 (Fe) 352.617 (Fe) 352.454 (Ni)
– Oyster tissue – Simultaneous determination 57
Co + Fe + Ni + Pb
283.393 (Co) 383.443 (Co) 383.245 (Fe) 383.455 (Ni) 383.306 (Pb)
– Carbon nanotubes – Simultaneous determination 66
Cr, Cu, Fe, Mn, Mo, Ni, V
357.869 (Cr) 324.754 (Cu) 344.099 (Fe) 344.388 (Fe) 403.076 (Mn) 313.259 (Mo) 232.003 (Ni) 232.138 (Ni) 318.540 (V)
None Activated charcoal and carbon black
Aqueous standard solutions (for Cu, Fe, Mo, and Ni); NIST SRM
1635 (for Cr, Mn and V)
– 114
Cr + Hg + Zn 357.869 (Cr) 253.652 (Hg) 307.590 (Zn)
– Aqueous standards – Sequential atomization 57
Cu, Mo, Sb 324.754 (Cu) 216.509 (Cu) 313.259 (Mo) 212.739 (Sb)
Ru permanent (for Sb only)
Air particulate matter Aqueous standard solutions Comparison with acid digestion
171
Hg 253.652 None Biological materials Aqueous standard solutions stabilized with KMnO4
– 172
Hg 253.652 None Air particulate matter Aqueous standard solutions stabilized with KMnO4
– 173
Hg 253.652 KMnO4 Polymers Aqueous standard solutions – 174
Mo + Ti 319.397 (Mo) 319.200 (Ti)
None Urine on filter paper Simultaneous determination 65
Pb 217.001 Ru permanent Biological materials Aqueous standard solutions Comparison with calibration against CRM
106
Pb 217.001 None Coal CRM Aqueous standard solutions – 175
S (via CS) 258.033 W + Pd Biological CRM Aqueous standard solutions of thiourea
– 141
S (via CS) 257.958 Sum of 6 lines
Ru + Pd nanoparticles
Steel, PE, biological CRM, coke
Aqueous standard solutions – 142
S (via CS) 258.033 Ru Coal and coal CRM Aqueous standard solutions of L-cysteine
– 143
S (via CS) 258.056 Ir + Pd Food and food CRM – 144
Sb 231.147 Ir permanent Sediment CRM Aqueous standard solutions Least squares background correction
112
Sb 212.739 Ru permanent Airborne particulate matter
Aqueous standard solutions – 176
Tl 276.787 None Coal and coal CRM Aqueous standard solutions Identical results without and with Ru permanent or Pd
modifier
177