Article
Printed in Brazil - ©2014 Sociedade Brasileira de Química0103 - 5053 $6.00+0.00
A
*e-mail: [email protected]
Electrochemical Studies of Olmesartan Medoxomil and its Detection in
Pharmaceutical Dosage Forms and Biological Fluids by Cathodic Adsorptive
Stripping Voltammetric Method
Funda Öztürk,*,a Semahat Küçükkolbaşı,b Ceren Kaçarc and Esma Kılıçc
aDepartment of Chemistry, Faculty of Arts and Science, Namık Kemal University, Tekirdag, Turkey
bDepartment of Chemistry, Faculty of Science, Selçuk University, Konya, Turkey
cDepartment of Chemistry, Faculty of Science, Ankara University, Ankara, Turkey
As propriedades eletroquímicas da olmesartana (OLME) foram investigadas por voltametria cíclia (CV) e voltametria de pulso diferencial (DPV) em eletrodo de gota pendente de mercúrio (HMDE). Todos os estudos foram baseados no sinal de redução eletroquímica de OLME irreversível e controlada pela adsorção em aproximadamente –1,2 e –1,5 V vs. Ag/AgCl em pH 5,0 e tampão Britton-Robinson (BR). Esse caráter adsortivo da molécula foi usado para se desenvolver um método de voltametria adsortiva de redissolução catódica de pulso diferencial (DPCAdSV) novo, completamente validado, rápido, seletivo e simples na determinação direta de OLME em dosagem farmacêutica e urina humana, sem etapas demoradas anteriores ao ensaio. A corrente de pico da redução eletroquímica de OLME varia linearmente com a concentração, na faixa de 4,7 × 10⁻⁸ mol L-1 (0,0262 µg mL-1 ) a 8,3 × 10⁻⁶ mol L-1 (4,636 µg mL-1). Neste método, o limite
de quantificação (LOQ) foi determinado como sendo 5,1 × 10⁻⁷ mol L-1 (0,284 µg mL-1). O método
foi aplicado na determinação do conteúdo de OLME em preparações farmacêuticas comerciais e em urina humana adulterada, e mostrou ser altamente exato e preciso, com um desvio padrão relativo de menos de 10% em todas as aplicações.
The electrochemical properties of olmesartan (OLME) were investigated by cyclic voltammetry (CV) and differential pulse voltammetry (DPV) at hanging mercury drop electrode (HMDE). All studies were based on the irreversible and adsorption-controlled electrochemical reduction signal of OLME at about –1.2 and –1.5 V vs. Ag/AgCl at pH 5.0 in Britton-Robinson (BR) buffer. This adsorptive character of the molecule was used to develop a novel, fully validated, rapid, selective and simple differential pulse cathodic adsorptive stripping voltammeric (DPCAdSV) method for the direct determination of OLME in pharmaceutical dosage form and human urine without time-consuming steps prior to drug assay. Peak current of electrochemical reduction of OLME was found to vary linearly with the concentration in the range from 4.7 × 10⁻⁸ mol L-1 (0.0262 µg mL-1)
to 8.3 × 10⁻⁶ mol L-1 (4.636 µg mL-1). In this method, limit of quantification (LOQ) was found to
be 5.1 × 10⁻⁷ mol L-1 (0.284 µg mL-1). The method was applied to determine the content of OLME
in commercial pharmaceutical preparation and spiked human urine. It was found to be highly accurate and precise, having a relative standard deviation of less than 10% for all applications.
Keywords: olmesartan, differential pulse cathodic adsorptive stripping voltammetry,
pharmaceutical dosage form
Introduction
Hypertension is one of the main risk factors for the cardiovascular diseases and continues to be a major health problem in many countries. Olmesartan (OLME),
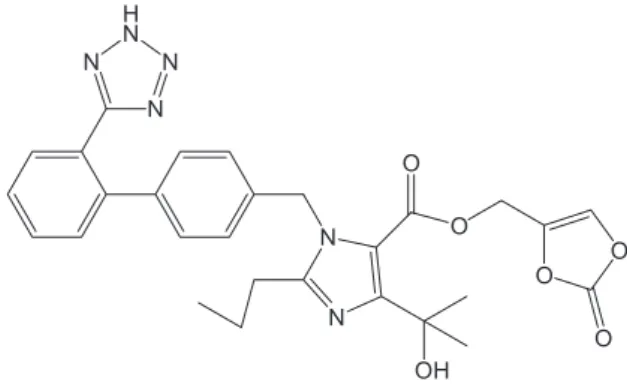
(5-methyl-2-oxo-1,3-dioxolen-4-yl)methoxy-4-(1- hydroxy-1-methylethyl)-2-propyl-1-{4-[2-(tetrazol-5-yl)-phenyl]phenyl}methylimidazol-5-carboxylate), is a potent and selective angiotensin AT1 receptor blocker which has been approved recently for the treatment of hypertension.1-4 Its empirical formula is C
29H30N6O6 and
a white to light yellowish-white powder with a molecular weight of 558.59. It is practically insoluble in water and sparingly soluble in methanol.
The drug contains a medoxomil ester moiety and is cleaved rapidly by an endogenous esterase to release the active metabolite OLME.5 Due to the fact that
hydrolysis of OLME in human plasma is extremely rapid,6 determination of OLME in plasma is the only
choice for the study of pharmacokinetic profile of OLME. Literature that was surveyed reveals that high-performance liquid chromatography (HPLC),7 high
performance thin-layer chromatography (HPTLC)8
and estimations in biological samples were performed in highly sensitive methods, such as HPLC, liquid chromatogaphy-mass spectrometry,9,10 HPLC coupled
to fluorescent detection.7-9 All these methods are neither
sufficiently sensitive, nor time-efficient and they require highly sophisticated instrumentation. The voltammetric techniques, such as cyclic voltammetry, differential pulse voltammetry and square-wave voltammetry are also used for the determination of organic molecules, including drugs and related molecules in pharmaceutical dosage forms and biological fluid.11 Çelebier et al.11 employed
square-wave voltammetric (SWV) method for determining OLME. In this study, however, adsorptive stripping voltammeric (AdSV) technique was preferred because the sensitivity is greatly enhanced when adsorptive stripping is also employed in any voltammetric method. AdSV is an efficient electroanalytical technique for the determination of sub-nanomolar and nanomolar level of a wide range of drugs with interfacial adsorptive character onto the working electrode surface. Its remarkable sensitivity is attributed to an effective accumulation step and an advanced measurement procedure that generates an extremely favorable signal to background ratio.12-16
In addition to its high sensitivity, this technique has the advantages of low detection limit, wide spectrum of the test material and analytes, relative simplicity,
insignificant matrix effect, and speed, which require equipment with lower cost. AdSV is a well established technique that is still developing, and it has a number of possible applications in the analysis of pharmaceutical and biological compounds.17-19
In this study, we developed and validated a differential pulse cathodic adsorptive stripping voltammetry (DPCAdSV) method for the rapid and accurate determination of OLME. The performance of the method was assessed against reversed-phase HPLC method by calculating t- and F-values.
Experimental
Materials
OLME standard sample (99%) was used to plot the calibration curve. The stock solution of OLME (1 × 10⁻³ mol L-1) was prepared in 25 mL of methanol
(Merck). The calibration solutions were prepared by appropriate dilution of the stock solution over the range of desired concentrations with Britton-Robinson (BR) buffer.
OLME and Olmetec® tablet (20 mg) were from
Pfizer (Istanbul, Turkey). The inactive ingredients include: hydroxypropylcellulose, hypromellose, lactose, low-substituted hydroxyl-propylcellulose, magnesium stearate, microcrystalline cellulose, red iron oxide, talc, titanium dioxide and yellow iron oxide.
All chemicals used in the preparation of BR buffer solution are phosphoric acid (Riedel), boric acid (Riedel), acetic acid (Merck), and sodium hydroxide (Merck). Double-distilled deionized water was supplied from Human Power I+, Ultra Pure water system (produced by ELGA
as PURELAB Option-S). All the data were obtained at ambient temperature.
Apparatus
All voltammetric measurements, i.e., cyclic voltammetry (CV) and DPCAdSV, were carried out using a CH-instrument electrochemical analyzer (CHI 760). A three-electrode cell system incorporating the hanging mercury drop electrode (HMDE, BAS CGME 1108 ) as the working electrode, a platinum wire as the auxiliary electrode (BAS MW-1034) and an Ag/AgCl electrode as the reference electrode (MF 2052 RE-5B) was used in all experiments.
An Agilent 1200 liquid chromatographic system (Agilent Technologies, Waldbronn, Germany) was equipped with a vacuum degasser (G1322A), a quaterner pump (DE6295841), an auto sampler (G1329A), a column
thermostat (G1316A), and a UV-Vis diode array detector (model G1315D) that works at 190-690 nm.
The analytical column was a Phenomenex Gemini C18 column (3µ 110A 150 × 4.60 mm2, Knauer, Berlin,
Germany).
All pH measurements were made with Thermo Orion Model 720A pH ion meter by using combined Orion glass pH electrode (912600).
Preparation and analysis of samples
To prepare the solutions of tablets, the drug contents of ten tablets were weighed initially, then finely powdered and mixed in order to obtain a homogeneous powder. The average mass per tablet was determined. A powder sample equivalent to one tablet was weighed and transferred into a 50.0 mL calibrated flask and then 25-30 mL of methanol were added. The contents of the flask were sonicated for 30 min to achieve complete dissolution of OLME. After the dissolution step, the flask was filled up to the mark with methanol. The solution was transferred to a centrifuge tube and centrifuged for 30 minutes at 1500 rpm after sufficient shaking. Ten milliliters of sample from the clear supernatant liquor were withdrawn and diluted quantitatively to 100.0 mL with BR buffer and pH was adjusted to the desired value. This solution was kept at +4.0 °C in the dark. Sufficient volumes from this solution were transferred into a calibrated volumetric flask of 10.0 mL, the pH was controlled and the volume was completed to the mark with BR buffer, then content of flask was transferred to an electrochemical cell and voltammetric measurements were performed.
Urine samples obtained from healthy individuals were stored frozen until assay. After gentle thawing, 1.0 mL aliquot volume of urine was added to the electrochemical cell containing 9.0 mL of BR buffer and then sufficient volumes from standard solution were transferred, after deaeration with argon, measurements were performed to determine the OLME content of the cell using direct calibration methods.
Voltammetric procedure
In all voltammetric studies (CV, differential pulse voltammetry (DPV), DPCAdSV) 10.0 mL of OLME solution in BR were placed into the electrochemical cell for each time. Electrode connections were adjusted and then cell content was deoxygenated with purified argon (99.99% purity) for 10 min before the first run and 30 s between all individual successive runs. After 2 s equilibration time, voltammograms were recorded by applying a negative-going scan.
Chromatographic procedure
The reversed-phase HPLC method was developed to provide a specific procedure suitable for the rapid quality control analysis of OLME and as the reference method for the voltammetric assay.
The mobile phase was chosen to be methanol-0.01% trifluoroacetic acid mixture. After several trials in various proportions and different pH values, a satisfactory separation was obtained with a mobile phase consisting of methanol-0.01% trifluoroacetic acid (60:40 v/v) (pH 3). Retention time for OLME was observed at 2.8 min and the optimum wavelength was determined to be 254.0 nm under isocratic conditions and a flow rate of 1.0 mL min-1. All
solvents were filtered through 0.45 µm membrane filters and degassed in an ultrasonic bath.
OLME and rofecoxib (internal standard) stock solutions (1 × 10³ µg mL-1) were prepared in methanol. The standard
working concentrations of mixed OLME (20 µg mL-1) and
rofecoxib (40 µg mL-1) were prepared in the mobile phase
using methanol-0.01% trifluoroacetic acid (60:40 v/v). This solution was subjected to liquid chromatography (LC) analysis. Solutions and mobile phases were freshly prepared prior to use. For calibration purposes, a range of 0.4-20.0 µg mL-1 OLME and 40 µg mL-1 rofecoxib (internal
standard) were prepared and 20 µL injections were carried out in triplicates.
Results and Discussion
Electrochemical behaviors of OLME
The electrochemical behavior, diffusion and adsorption properties of OLME were studied using CV and DPV. In CV studies, double well-defined reduction peaks of OLME were observed at a potential about –1.2 and –1.5 V (pH 5.0). The peak we observed at –1.2 V was not studied further. There is no peak when blank BR buffer was scanned at the same condition, and peak current increases linearly with increasing concentration of OLME. A reverse scan after the reduction peaks does not display any anodic counterpart (Figure 2).
The influence of scan rate (v) on the cathodic peak current (ip) was investigated by CV. Increasing
the scan rate from 0.02 to 2 V s-1 causes the peak
potentials to shift to more negative potential values, indicating that the electroreduction step is not reversible.20
(Figure 3A). The equation for the logarithm of peak current
ip
cversus logarithm of scan rate (V s-1) was found to be
log (ipc) = 0.95 log v – 5.31 with R
2 = 0.997. Slope of the
curve (0.95 log ip
value of 1.0 for adsorbed species. The log ipvs. log v graph
is presented in Figure 3B, for OLME. The result indicates that the adsorption phenomenon is dominant.15
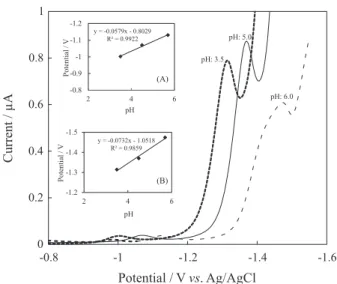
In electrochemical studies, pH is one of the variables that commonly and strongly influences the electrochemical behaviors of molecules. Therefore, the electrochemical behavior of OLME was studied as a function of pH in the pH range of 3.5-6.0. As can be seen from differential pulse voltammograms at different pH values, the potential of the cathodic peak shifts to more negative values and peak current decreases with the decrease in pH values (Figure 4). In the measurements obtained for pH values greater than 5, it was observed that the peak’s shape was distorted and the current value at the peak was lower. In DPV studies, first and second peak potentials vary linearly with the pH value as given by the equations Ep = 0.058 pH – 0.8029 with
R2 = 0.9922, Ep = 0.0732 pH – 1.0518 with R2 = 0.9859,
respectively.
The experimental values of the peak potential slope against pH curves in DPV studies were found to be 0.058 and 0.073 V per unit pH value in the given pH range. The value of the slope is very close to the theoretical value of 0.0592 V per unit pH required for the assumed 2e–/2H+
or 4e–/4H+ process of the electroreduction of OLME.21,22
(1)
In equation 1, ∂ is the number of protons participating in
reaction mechanism and the others are the usual constants with known values. Number of protons involved in the reaction mechanism was found to be 2 from the slope value of the plot of Epvs. pH.
To find out the number of electrons, the following equations were proposed to be used in CV for the adsorption process.20
(2)
and the relation
(3)
where ip is the peak current (in A), Q is the charge (in
C) consumed by the surface process as calculated by the integration of the area under the peak, n is the total number of electrons transferred in the electrode reaction, τ is the
surface coverage of adsorbed substance (in mol cm-2), A is
the working mercury electrode area (0.0145 cm2), F is the
Faraday constant (96485 C mol-1) and v is the scanning rate
Figure 2. Cyclic voltammograms of: (a) blank solution; (b) 1 × 10⁻⁴ mol L-1
OLME in BR buffer solution at pH 5.0; scan rate: 0.1 V s-1.
Figure 3. Influence of potential scan rate on both cathodic peak current and cathodic peak potential of 1.0 × 10⁻⁴ mol L-1 OLME. Inset: (A) curve
of peak current vs. scan rate; (B) curve of logarithm of peak current vs. logarithm of scan rate.
Figure 4. Influence of pH on diferential pulse voltammograms of 1.0 × 10⁻⁵ mol L-1 OLME. Inset: plot of peak potentials vs. pH value;
(in V s-1).14,21-23 Substituting the τ term of equation 3, into
equation 2, a new relation for n is obtained:
(4)
In the scan rate from 0.02 to 1.0 V s-1, the number
of electrons transferred in the electrode reaction (n) was calculated using equation 4 for each scan rate and using the slope of peak current vs. scan rate. In both methods (calculation and graphical) the number of electrons in the electrochemical step was predicted to be 2 (2.17 ± 0.14).
Diffusion coefficient of OLME was calculated from the cyclic voltammetric data using the method developed by Garrido et al.24 because OLME is found to be adsorbed
at HMDE electrode as described under adsorption properties.
(5)
The mean of the diffusion coefficient calculated from this equation was obtained to be 7.60 × 10⁻⁵ cm2 s-1.
Electrochemical determination of OLME
In present study, electrochemical assay of OLME was established with adsorptive techniques to achieve lower limits of detection than the values in the reported references. For this purpose, the instrumental parameters and experimental conditions such as pH, OLME concentration, deposition time and deposition potential were optimized for developing an assay method to determine OLME.
In order to obtain a well-defined differential pulse voltammetric peak shape and high peak current instrumental parameters such as frequency (f), scan increment (∆Ei), and
pulse amplitude (∆Ea) were optimized for 1 × 10
-6 mol L-1
OLME in a BR solution of pH 5.0. The optimum instrumental parameters were found to be f = 15 Hz,
∆Ei = 4 mV and ∆Ea = 50 mV.
The effect of pH on both the peak current and the peak shape was given in the previous sections. In the optimization of the pH value, not only the peak current was chosen as an important parameter, but also peak shape, peak symmetry, linearity range and solubility of OLME were chosen as other important parameters. In order to get a useful peak shape and larger linearity range, a pH value of 5.0 was selected as optimum although peak current values were higher at higher pH values (Figure 4).
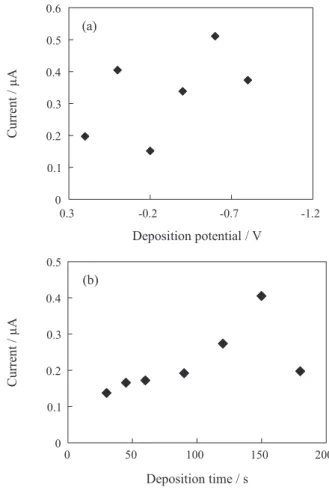
In the stripping method, the influence of the deposition potential on the DPCAdSV signal was studied for a 1 × 10⁻⁶ mol L-1 OLME solution in the range from +0.2
to –1.0 V. Variation of the peak current (ip) vs. deposition
potential for 1 × 10⁻⁶ mol L-1 OLME is given in Figure 5a.
The maximum peak current in the deposition step was observed for the deposition potential of –0.6 V. The influence of deposition time on peak current was also optimized in the range from 15 to 210 s for 1 × 10⁻⁶ mol L-1 OLME. The
optimum deposition time was found to be 150 s (Figure 5b).
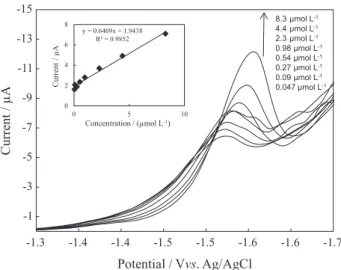
To establish the linearity range of OLME in the proposed method, standard solutions having different OLME concentrations in the range from 4.7 × 10⁻⁸ mol L-1
(0.026 µg mL-1) to 8.3 × 10⁻⁶ mol L-1 (4.64 µg mL-1) were
measured (Figure 6). The means of three measurements that were obtained in this study were plotted against the corresponding concentrations. Çelebier et al.11 employed
a voltammetric method without adsorptive stripping which provided a linear range of 1-14.6 µg mL-1. Their range
is significantly narrower compared to the range in the present study. In the linear region from 4.7 × 10⁻⁸ mol L-1
(0.0262 µg mL-1) to 8.3 × 10⁻⁶ mol L-1 (4.636 µg mL-1), the
following calibration obeys:
ip(µA) = 0.6409 × COLM(µM) + 1.9438, R2 = 0.9852 (6)
The characteristics of the calibration plots are summarized in Table 1.
Application of the proposed method: the dosage form and the biological samples
In order to evaluate the applicability of the proposed method, OLME was determined in pharmaceutical dosage forms and spiked human urine samples. The results of the analysis of pharmaceutical preparations and urine samples are presented in Table 2 and samples of spiked human urine in Table 3. The accuracy of the proposed method was determined by its recovery values. The average recovery values are in good agreement with relative standard deviation (RSD) values less than 10%, which is a good evidence for the validity of the method. Thus, the precision is very satisfactory for the analysis of biological samples as well as bulk formulations. These results indicate that the content of OLME in the pharmaceuticals and biological
fluids can be safely determined by using the proposed voltammetric method without interference from other substances in the samples after a simple dilution step.
Validation of method
Validation of an analytical method is the process that establishes that the performance characteristics of the method meet the requirements of the intended analytical applications. The elements required for method validation are the linearity range, limits of detection and quantification,
Figure 6. DPCAdSV of calibration solutions. Inset: calibration curve for corresponding concentrations.
Table 1. Regression data of the calibration curve for assay of OLME by DPCAdSV
Calibration parameters DPCAdSV Linearity range /
(mol L-1)
4.70 × 10⁻⁸-8.30 × 10⁻⁶
Calibration equation ip(µA) = 0.6409 × COLME (µmol L-1) + 1.9438
Slope of calibration curve (m) / (A L mol-1)
0.6409
Intercept / A 1.94 × 10⁻⁶
Standard deviation (SD) of calibration / A
6.67 × 10⁻⁸
SD of slope / (A L mol-1) 8.67 × 10⁻³
SD of intercept (s) / A 3.26 × 10⁻⁸
Limit of detection (LOD) / (mol L-1)
1.53 × 10⁻⁷ (0.0855 µg mL-1)
Limit of quantification (LOQ) / (mol L-1)
5.09 × 10⁻⁷ (0.2849 µg mL-1)
Regression coefficient (R2)
0.9852
Repeatability of peak currenta (RSD / %)
6.36
Repeatability of peak potentiala (RSD / %)
2.32
aCalculated for 3 replicate measurements.
Table 2. Results of proposed method for determination of OLME from the solution of Olmetec® tablets
Samplea Nominal value per tablet / mg Found values per tablet / mg Recovery valueb RSD / %c
I 20 20.50, 20.19, 19.88 100.95 ± 3.85 1.54
II 20 19.35, 19.44, 19.80 97.65 ± 2.96 1.22
aSamples given the linear region; bresults of recovery values are given as mean (at 95% confidence level); cRSD: relative standard deviation.
Table 3. Results of OLME amounts in human urine spiked by standard OLME determined using the proposed DPCAdSV method
Samplea Spiked amount / µg Found amount / µg Recovery value / %b RSD / %c
Standard in urine I 5.5 5.31, 5.73, 5.54 102.36 ± 4.31 1.69
Standard in urine II 12.0 12.29, 12.68, 12.48 104.03 ± 4.04 1.56
precision, accuracy, reproducibility, stability, selectivity and robustness.25 For the results of the concentration studies,
see the section of electrochemical determination of OLME. Limit of detection (LOD) and quantification (LOQ) values were calculated using the following relationships: LOD = 3s / m and LOQ = 10s / m26 where s is the standard
deviation of the intercept of the calibration curve and
m isthe slope of the related calibration curve; the LOD and LOQ values are 1.53 × 10⁻⁷ mol L-1 (0.086 µg mL-1)
and 5.09 × 10⁻⁷ mol L-1 (0.284 µg mL-1), respectively.
Both LOD and LOQ values confirm the sensitivity of the proposed method when they are compared against the values reported by Çelebier et al.11 (LOD: 0.50 µg mL-1
and LOQ: 1 µg mL-1). The accuracy of the measurement
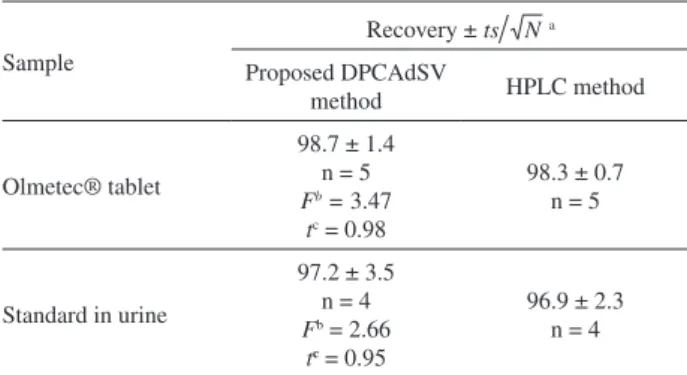
by means of the described procedure was checked by calculating the recovery of a known concentration of OLME following the proposed method at optimum instrumental and experimental conditions. Recovery values range from 97.6 to 101.0% for tablet analysis, from 102.0 to 104.0% for urine analysis (Tables 2 and 3). From these recovery values, it is concluded that the proposed method is highly accurate. The performance of the method was also assessed by calculation of t- and F-values compared with the reversed-phase HPLC method. The mean values that were obtained in a Student t-test and F-test at 95% confidence limit for ten degrees of freedom and the results recorded in Table 4 showed that the calculated t- and F-values did not exceed the theoretical values, and there is a good agreement with the results of the HPLC.27
Conclusions
In this study, electrochemical properties of OLME were studied on hanging mercury drop electrode with adsorptive stripping voltammetric method for the first time,
to the best of our knowledge. Electrochemical behaviors of pharmaceutical compounds may have valuable findings in understanding of the mechanism of their action and/ or determining their concentration in living organisms at various times after intake. The method developed here provides a sensitive, fast, cost-effective, high through-put and simple approach to the determination of OLME in tablet dosage forms, and spiked human urine sample. Also, the method developed in this study is compared with
t-test and F-test against the HPLC method and the results revealed that the new method is reliable. Furthermore, when applied to urine sample, the proposed method offers the advantage of no requirement of prior extraction procedure.
References
1. Koga, K.; Yamagishi, S.; Takeuchi, M.; Inagaki, Y.; Amano, S.; Okamoto, T.; Saga, T.; Makita, Z.; Yoshizuka, M.; Mol. Med.
2002, 8, 591.
2. Mizuno, M.; Sada, T.; Ikeda, M.; Fukuda, N.; Miyamoto, M.; Yanagisawa, H.; Koike, H.; Eur. J. Pharmacol.1995, 285, 181. 3. Brunner, H. R.; Clin. Ther.2004, 26, 28.
4. Chilman Blair, K.; Rabasseda, X.; Drugs Today2003, 39, 745. 5. Schwocho, L. R.; Masonson, H. N.; J. Clin. Pharmacol. 2001,
41, 515.
6. Kobayashi, N.; Fujimori, I.; Watanabe, M.; Ikeda, T.; Anal. Biochem.2000, 287, 272.
7. Nakamura, H.; Inoue, T.; Arakawa, N.; Shimizu, Y.; Yoshigae, Y.; Fujimori, I.; Shimakawa, E.; Toyoshi, T.; Yokoyama, T.; Eur. J.
Pharmacol.2005, 512, 239.
8. Laeis, P.; Puchler, K.; Kirch, W.; J. Hypertens.2001, 19, 21. 9. Liu, D.; Hu, P.; Matsushima, N.; Li, X.; Li, L.; Jiang, J.;
J. Chromatogr. B: Biomed. Sci. Appl.2007, 856, 190. 10. Vaidya, V. V.; Roy, M. N.; Yetal, S. M.; Joshi, S. S.; Parekh,
S. A.; Chromatographia2008, 67, 147.
11. Çelebier, M.; Süslü, I.; Altınöz, S.; Anal. Methods2013, 5, 1301. 12. Wang, J.; Analytical Electrochemistry; Wiley-VCH: New York,
2000.
13. Barek, J.; Pecková, K.; Vyskočil, V.; Curr. Anal. Chem. 2008, 4, 242.
14. Ignjatović, L. M.; Barek, J.; Zima, J.; Stević, M. C.; Collect. Czech. Chem. Commun. 2008, 73, 97.
15. Němcová, L.; Zima, J.; Barek, J.; Collect. Czech. Chem. Commun. 2009, 74, 1477.
16. Jemelková, Z.; Zima, J.; Barek, J.; Collect. Czech. Chem.
Commun. 2009, 74, 1503.
17. Dogan, B.; Ozkan, S. A.; Electroanalysis2005, 17, 2074. 18 Jain, R.; Dwivedi, A.; Mishra, R.; J. Hazard. Mater.2009, 169,
667.
19. Jain, R.; Radhapyari, K.; Jadon, N.; J. Colloid Interface Sci.
2007, 314, 572.
Table 4. Comparison of the proposed method with the HPLC method in determination of OLME in commercial tablet and biological sample
Sample
Recovery ± a
Proposed DPCAdSV
method HPLC method
Olmetec® tablet
98.7 ± 1.4 n = 5 Fb = 3.47
tc = 0.98
98.3 ± 0.7 n = 5
Standard in urine
97.2 ± 3.5 n = 4 Fb = 2.66
tc= 0.95
96.9 ± 2.3 n = 4
aMean ± RSD for 95% confidence level; btabulated F-values for 95%
confidence level and are 6.39 and 9.28; ctabulated t-values for 95%
20. Nicholson, R. S.; Shain, I.; Anal. Chem. 1964, 36, 706. 21. Eriksson, A.; Nyholm, L.; Electrochim. Acta 1999, 44, 4029. 22. Montoya, M. R.; Mellado, J. M. R.; J. Electroanal. Chem. 1996,
417, 113.
23. Wang, L.; Zhang, Z.; Ye, B.; Electrochim. Acta 2006, 51, 5961. 24. Garrido, J. A.; Rodriguez, R. M.; Bastida, R. M.; Brillas, E.;
J. Electroanal. Chem. Interfacial Electrochem. 1992, 324, 19. 25. Guzman, A.; Agui, L.; Pedrero, M.; Yanez-Sedeno, P.;
Pingarron, J. M.; Electroanalysis2004, 16, 1763.
26. Ozturk, F.; Tasdemir, I. H.; Durmus, Z.; Kılıc, E.; Collect.Czech.
Chem. Commun. 2010, 75, 685.
27. Holme, D. J.; Peck, H.; Analytical Biochemistry, 3rd ed.; Wesley
Longman: New York, 1998.
Submitted: December 19, 2013