Abstract
This paper presents the effect of sequence loading on fatigue crack growth of API X65 steel tested in room temperature. Most of pipeline steels are subjected to wide spectrum of loading during the length of service. Influence of load history effect can cause a tricki-er assessment to the fatigue behaviour. The objective of this study is to determine the fatigue crack growth behaviour under sequence loading. The material used in this study is X65 steel grade, broadly used in transporting the oil and gas. The constant amplitude load-ing under mode-I loadload-ing and stress ratio of 0.1 and 0.7 are inves-tigate. The effects of sequence load are presents by the two-level block loading. The retardation effect is more intense for block sequence loading. At least about 9.7x10⁴ delayed numbers of cycles was observed which is two times longer compared to constant amplitude loading. The load sequence was suggested affected by retardation consequently delayed the crack growth. It was further observed an increase of overload load ratio consequently resulted a crack grows faster about 18%. It was concluded a lengthy in crack growth was associated with the delay cycles suggesting that the fatigue life depends mainly on size of delay zone and compressive residual stress near the crack tip.
Keywords
Fatigue crack growth, API X65 steel, constant amplitude loading, sequence loading
Discerning the Fatigue Crack Growth Behavior
of API X65 Steels Under Sequence Loading
1 INTRODUCTION
Most of the engineered structures and mechanical components are intimately related to the cyclic loading either constant amplitude (CA) loading or variable amplitude (VA) loading. The unavoida-ble flaw or stress riser is a dominant contributor to the initial cracks. These cracks subsequently grow until the critical crack length reached and subsequently reduced the strength of structures to a point where fracture occurs. A process of failure which involve cyclic load is known as fatigue crack
N. I. I. Mansor a S. Abdullah a,* A. K. Ariffin a
a Department of Mechanical and
Materials Engineering, Faculty of Engineering and Built Environment, Universiti Kebangsaan Malaysia, 43600 UKM Bangi, Selangor, Malaysia. [email protected], [email protected], [email protected]
* Corresponding author: [email protected]
http://dx.doi.org/10.1590/1679-78253057
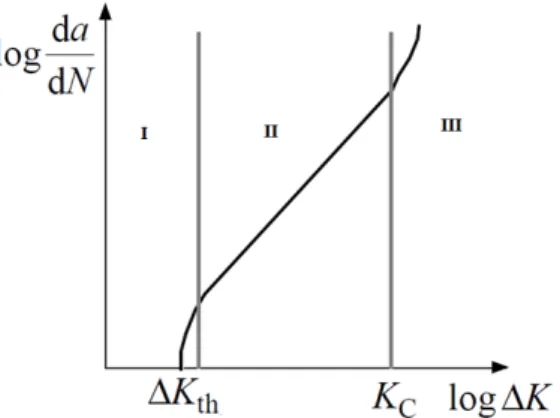
growth (FCG). Therefore, the use of damage-tolerance design was introduced to ensure the life span of a given structural components in the presence of growing cracks. The fatigue crack growth rates (FCGR), was widely accepted to ascertain the progression of fatigue cracking by adopting the max-imum stress intensity factor (SIF), Kmax and the range of SIF, K determined by K = Kmax – Kmin with Kmin being the minimum stress intensity factor as a mechanical driving forces for growth of cracks. This important notation initiated by Irwin in 1950s, worked well in quantifying the crack tip driving force. It is presumed, the Kmax causing the rupture of crack tip bonds while K causing a cyclic plastic damage near the crack tip. As shown in Fig. 1, a sigmoidal curve can be identical by stage I, II and III. Stage I signify a region with low values of K and da/dN (less than 10−9 m/cycle). Fatigue cracks appears dormant below the fatigue threshold, Kth while stage II indicate an intermediate region (10−9 to 10−6 m/cycle) and stage III denote by upper region featuring an accelerating of crack growth (above 10−6 m/cycle) (Rushton and Taheri 2003).
Figure 1: Schematic depicts a sigmoidal crack growth curve with three identical stages of (I) Kth crack arrest,
(II) stable crack growth and (III) Kc or KIC controlling in crack growth.
Several analytical FCG models prediction is obtainable in the literature for many generalised geometries including an edge crack, centre crack and embedded penny crack. The desire to formu-late a crack growth under CA loading was led to the development of the Paris formulation as pro-posed by Paul Paris and Erdogan describe as da ( )m
C K dN
(Zhan et al., 2014). The experimental was
Paris formulation derived by Forman et al. (Jones et al. 2012) in a suggested form as (1 )( )m
c
da C K
dN R K K
and Walker et al. (Blasόn et al. 2016) in a form as
(1 )
( ) (1 )
m
n
da A K dN R
. Later, in 1970 Elber was
discov-ered the concept of crack closure and recognised that crack growth rate is a function of Keff where Keff = Kmax–Kopen (Martelo et al. 2015). More recent model has been developed such as Newman, Johnson (Murthy et al. 2004), two parameter fatigue crack growth model-Kujawski (Kujawski 2005) and Huang-model (Huang et al. 2008). However, no single model is successfully suit to all materials which considers the influence of all parameters at a time (Beden et al. 2009).
Nevertheless estimating the fatigue lives under CA loading varies significantly from VA loading. The participation of the load sequencing or load interaction effects under VA loading affect the rate of fatigue crack growth (FCG) and complicate the lives prediction. Maljaars et al. (2015) estimated the crack growth rates of thick-walled C–Mn steel with welded attachment. The fatigue life was effectively enlarge by a sequence of overload. The retardation model of Space-state was used to simulate the crack growth of C-Mn semi-elliptical surface cracks. The Newman strip yield model was adopted to calculate the crack closure. The model offered a three dimensional assessment of fatigue cracks that benefit for ships, bridges and offshore structures. It was found the model was able to practice for estimating the crack growth incorporated with load interactions. Murthy et al. (2004) explained the cracks growths depend not only on the minimum and maximum loading cycle and crack length, but also on previous loading history. Acceleration and/or retardation in crack growth rate are greatly expected due to the nature of VA loading. Toribio et al. (2015) elucidates the retardation or acceleration effect with regard to FCG being closely related to VA loading se-quences which depending of the combination of load parameters, geometry of specimen, material properties and environment. Overloads are generally retarding a crack growth, while underloads are known to accelerate a crack growth (Huang et al. 2008 and Maljaars et al. 2015). However, as re-ported by Benachour et al. (2013) the degree of retardation was primarily associated with range of stress intensity factor (SIF), a number of large and small amplitude and the number of cycles con-tinued instantly after the last peak stress is applied.
Because of the complexity nature of loading condition (e.g combination of dynamic and static load of ice, wave and wind) it prompt to complicate life estimation. Thus, this study was driven by requisite of accurate estimation of FCG rates of offshore structure primarily on aged pipeline. The objective of this study is to characterise the effects of crack growth rates influenced by continues block sequence of API X65 offshore pipeline steels. The effect of load history likely to affect the FCG rates which in turn retard or accelerate the propagation rates.
2 METHODOLOGY
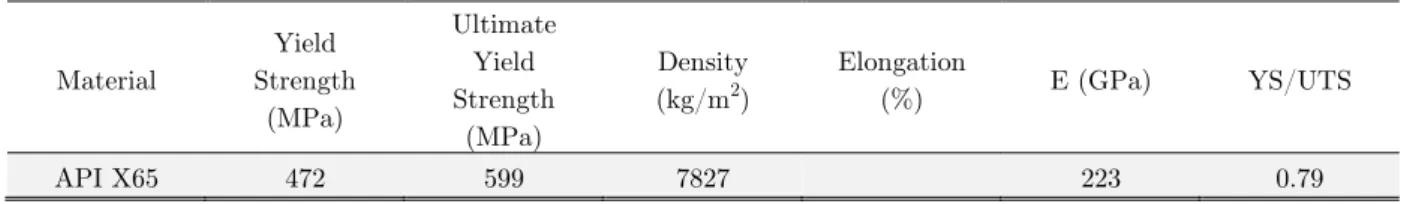
The material used in this studied is API steel grade of X65 broadly used as crude oil for offshore pipelines. The specimens were cut in accordance with ASTM E8 prior to tensile test. The static test was conducted at ambient laboratory condition with a crosshead speed of 10-3 mm/s using universal testing machine. The mechanical properties and chemical composition (wt %) of the steel studied was as follows:
Material
Yield Strength
(MPa)
Ultimate Yield Strength
(MPa)
Density (kg/m2)
Elongation
(%) E (GPa) YS/UTS
API X65 472 599 7827 223 0.79
Table 1: The monotonic properties of the API X65 steel.
Elements C Si S Ti Cr Mn Ni Mo Fe
Weight (%) 6.24 0.23 0.11 0.3 0.16 1.60 1.29 0.6 Balance
Table 2: The chemical composition of the API X65 steel (wt %).
2.1 Fatigue Crack Growth Test
(a) (b)
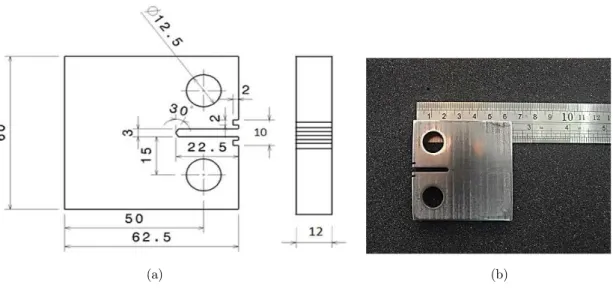
Figure 2: Geometry of the specimen (a) dimension (in mm), (b) actual machined specimen for the FCG test.
Figure 3: The 100kN servo-hydraulic fatigue testing machine.
(a) (b)
(c) (d)
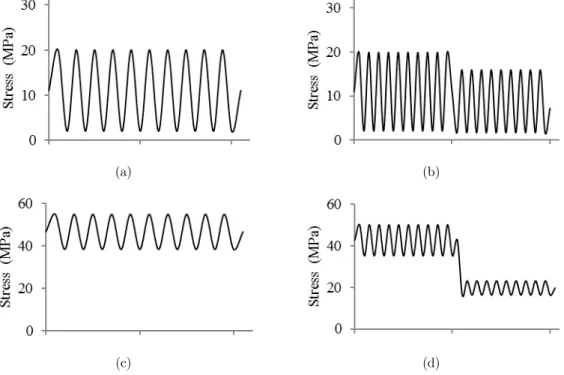
Figure 4: Load sequence for fatigue crack growth test of stress ratio of 0.1 and 0.7 under (a) CAL (b) Hi-Lo loading (c) CAL (d) Hi-Lo loading.
Prior to crack growth test, the surface area of crack tip was mirror polished to 1200 grit finish. Cleaning process was followed by soaking in acetone and rinsed with distilled water. A scribe lines were drawn on the surface parallel to the specimen axis to facilitate the monitoring crack growth during cyclic loading (Pereira et al. 2007). At each 1 mm of crack growth, the accumulated number of cycles was recorded. The behaviour of crack growth was determined from the FCG model. A fitting through the least squares method was utilised to determine the appropriate constant for the various equations. The distribution of the collected data was studied through a statistical works as given formula:
1 2
1 ( )
2 x
f x e
(1)
where µ is denote mean of x, is denote standard deviation of x, is a 3.14 and e is a 2.72.
The linear elastic fracture mechanics (LEFM) based on stress intensity factor, KI was endorsed for the satisfactory of plastic zone size near the crack tip. The equation (2) and equation (3) were a general formula that describes the KI. Prior to the LEFM, it requisite a small plastic zone size as compared to the specimen geometry. An idealised of plastic zone ahead of crack tip according to Irwin was derived from the Westergaard stress function calculated as shown in equation (4).
Y I
P K
B W
(2)
2 3 4 3
2
2
. 0.886 4.64. 13.32. 14.72. 5.56. 1
a
a a a a
W Y
W W W W
a W (3)
where P is a force, B is a thickness, W is a width and Y is a dimensionless parameter which de-scribe specimen shape function.
2 1 2y y K r
(4)
where α = 2 for plane stress and α = 3 for plane strain, K is the stress intensity factor, and σy is the yield strength.
3 RESULTS AND DISCUSSIONS
3.1 Distribution of Fatigue Crack Growth Data
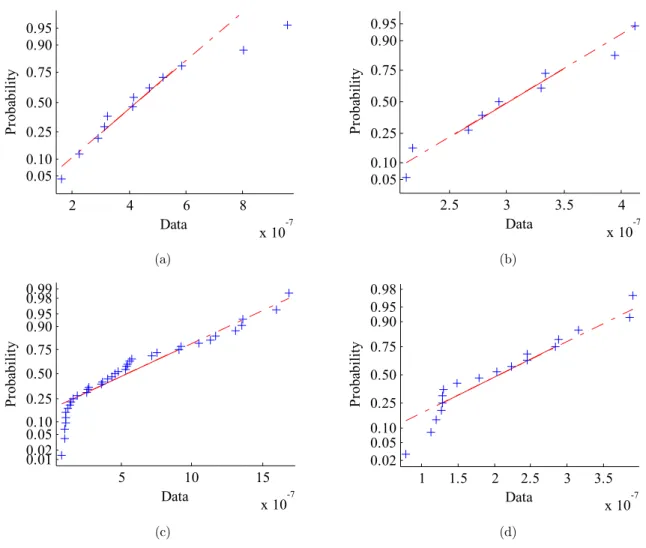
The graphical assessment of normality was showed in Fig.5. It was suggested the data set was normal-ly distributed for every load ratio. The normal probability was plotted to compare between the theo-retical and actual data point generate from the probability plot. The actual data was observed ad-hered to the theoretical normal distribution clearly observed at constant R of 0.1 and 0.7 as shown in Fig. 6. The data set was characterised as linear. A normality test known as Liliefors was recognised for a small sampling size was performed to provide conclusive evidence of the goodness-of-fit for each distribution data set. Considering the significant level of 5%, the null hypothesis was obtained indicat-ed it fails to reject the distribution is normal with the p-value ranging from 0.1-0.5 which slightly larger than significant value. Similar observation was reported in Rathod et al. (2011).
-5 0 5 10 15
x 10-7 0 2 4 6 Fr eque nc y
Crack growth rate da/dN (m/cycle)
0 1 2 3 4 5 6
x 10-7 0 1 2 3 4 Fr eque nc y
Crack growth rate da/dN (m/cycle)
-1 -0.5 0 0.5 1 1.5 2 x 10⁻⁶ 0 5 10 15 Fr eq ue nc y
Crack growth rate da/dN (m/cycle)
-1 0 1 2 3 4 5
x 10-7 0 2 4 6 8 Fr eq ue nc y
Crack growth rate da/dN (m/cycle)
R=0.1 R=0.7
R=0.1(Hi-Lo) R=0.7(Hi-Lo)
2 4 6 8 x 10⁻⁷ 0.05 0.10 0.25 0.50 0.75 0.90 0.95 Data Pr ob ab ilit y
2.5 3 3.5 4
x 10-7 0.05 0.10 0.25 0.50 0.75 0.90 0.95 Data Pr oba bi lit y (a) (b)
5 10 15
x 10-7 0.01 0.02 0.05 0.10 0.25 0.50 0.75 0.90 0.95 0.98 0.99 Data Pr ob ab ili ty
1 1.5 2 2.5 3 3.5
x 10-7 0.02 0.05 0.10 0.25 0.50 0.75 0.90 0.95 0.98 Data Pr ob abili ty (c) (d)
Figure 6: Normal probability of CA loading and block loading of (a) R 0.1 (b) R 0.7 (c) R 0.1 (Hi-Lo) and (d) 0.7 (Hi-Lo).
Constant Amplitude Loading
The results obtained from the CA loading were put forward as a basis for the analysis with respect to the block loading. An accumulated number of cycled to failure for a constant and sequence load-ing was shown in Fig. 7. The extended number of cycles was attained for spectrum loadload-ing indicat-ed spectrum loading pronouncindicat-ed to increase the fatigue life. The specimens were fracturindicat-ed after 4.8 x 10⁴ and 5.0 x10⁴ cycles of constant loading of R 0.1 and 0.7 respectively. Fractured was occurred as it reached or exceeded the fracture toughness of the material prior to loading cycle(Zerbst et al. 2013). Final fractured was observed occurred at 27 mm and 24 mm crack length for R of 0.1 and 0.7.
pro-nounces in region II FCG. However this stable region was denoted as the most significant phase to be studied to precisely estimate the fatigue life span (Li et al. 2015). The actual physical of crack growth can be explained by macroscopic scale as shown in schematic Fig. 9. In Fig. 10, it shows a schematic of slip formation observed within microscopic scale. It was suggested the slanted at the crack tip during loading caused a slip of atomic planes. The occurrence of plastic deformation was presumed due high stress near the vicinity of the crack tip even at very low load. Slip of atomic planes at the crack tip was closely related to the shear stress.
0 2 4 6 8 10
x 104 0
0.01 0.02 0.03 0.04
Number of cycles, N
Cr
ack
leng
th,
a (m
)
R=0.1 R=0.7 R=0.1(Hi-Lo) R=0.7(Hi-Lo)
Figure 7: Extension of crack length in function of number of cycles.
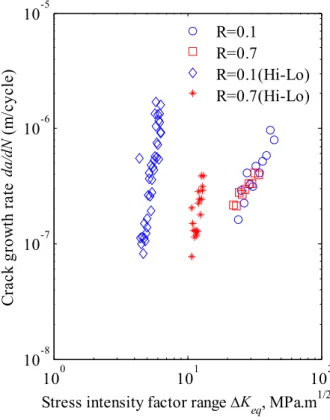
100 101 102
10-8 10-7 10-6 10-5
Stress intensity factor range K
eq, MPa.m
1/2
Cr
ack
gr
ow
th
rat
e
da
/d
N (m
/c
ycl
e)
R=0.1 R=0.7
R=0.1(Hi-Lo) R=0.7(Hi-Lo)
(a) (b) (c)
(d) (e) (f)
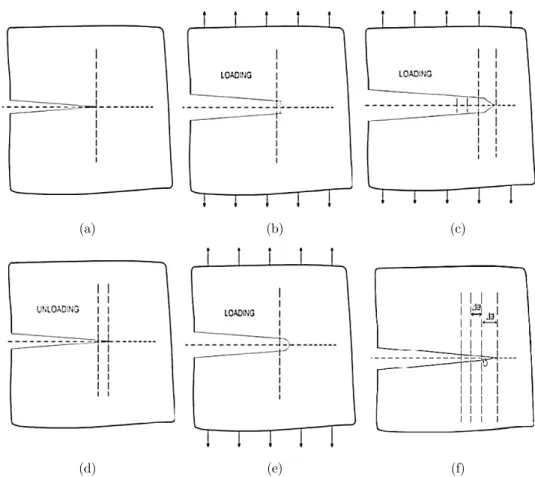
Figure 9: Schematic of crack growth during loading and unloading (a) load applied in principle stress (b) gradually crack advances (c) sharpening at the crack tip (d) unloading (e) plastic deformation
blunting at the crack tip due to high load applied (e) increased of crack length along the dotted line due repetitive of loading and unloading.
(a) (b) (c)
Figure 10: Schematic of slip of atomic at planes under a highly magnification of microscopic scale the slip at the crack tip followed as (a) loading condition (b) slanted at the crack tip resulted a slip
Two-level Block Sequence
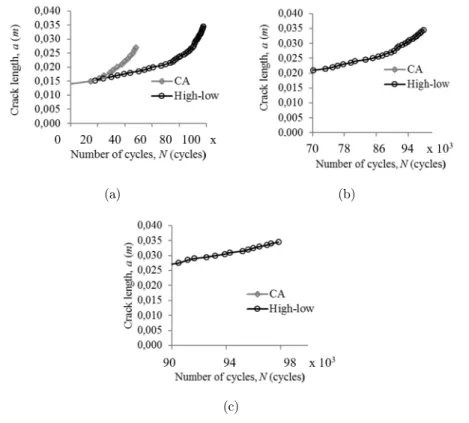
Fig. 7 shows the application of two block loading high-to-low (Hi-Lo) caused a significantly crack delayed. A factor of 2 times longer of crack growth rates was observed for R=0.1 in comparison between CA loading and Hi-Lo loading. It was resulted about 9.1 x 10⁴ number of cycles required to break the specimen under Hi-Lo loading. It was suggested, the load sequence caused a retardation consequently delayed the crack growth. Fig. 11(a)-(c) showed an interval spaces indicated a delay of crack growth. In general, plastic zone was produced at crack tip under CA loading. A tensile over-load directed onto the cracked body subsequently caused additional localised inelastic plastic zone at the crack tip. Following of removal overload consequently resulted an elastic phase over the plas-tic zone spring back and left the compressive residual stresses along the crack length. The tensile and compressive residual stress at the crack tip was expected to satisfy the equilibrium state of internal force. It was recognised, the maximum unloading stress was between the ranges of yield strength, Sy – 2Sy.
Thus the larger plastic zone subsequently will give the stronger compressive residual stress act-ed at crack length thus suppressact-ed the crack growth within the plastic zone (Benachour et al. ; Huang et al. 2008). As the crack passed the plastic zone, the propagation rate continued with base-line rate which corresponded to the CA loading. The schematic of plastic zone ahead of crack tip and schematic of equilibrium state was shown in Fig. 12 and Fig. 13 respectively. Fig. 14 shows the CA loading and the effect of block overload towards the crack growth rates of R=0.1. An increment of plastic zone size and the SIF was expectable due to the crack advanced, thus it gave a beneficial effect to the material as it consequently retards the propagation. The da/dN (m/cycles) was decel-erate a few times indicated an increase of delayed crack length caused by the formation of larger plastic zone. A similar pattern of overload was observed by Huang et al.(2008) with just single ap-plication of overload.
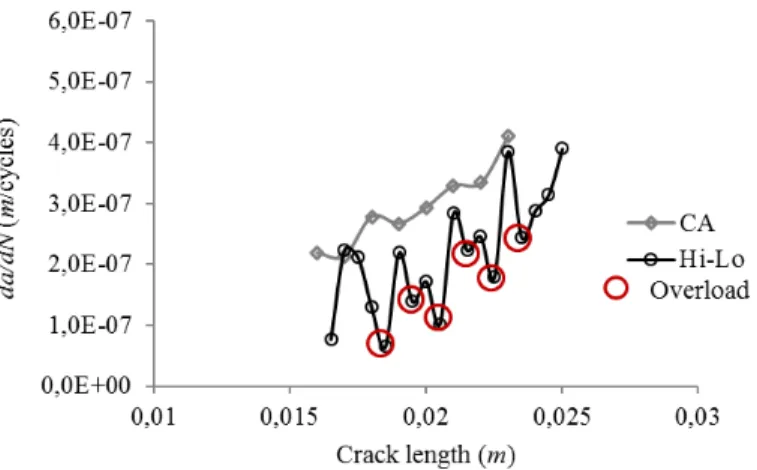
It was further observed by retained the R=0.7 at each sequence block, it subsequently increased the propagation life. An accumulated of 7.8 x 10⁴ cycles was obtained as shown in Fig. 15. A de-layed about 96% of cycled was found due to load sequence effect as compared to the CA loading. Fractured was occurred at 25 mm indicated crack growth was faster as compared R=0.1. An in-tense of initial acceleration was observed in Fig. 16 indicating the rates of crack growth was faster thus shorten the fatigue crack length. The accelerated crack was tended to vanish the beneficial effect of load sequence. It was also denoted an increase of R values showed a detrimental effect of delayed plastic zone size (Pereira et al. 2007).
(a) (b)
(c)
Figure 11: Extension of crack length in function of numbers of cycles of R 0.1 (a) CA and block loading (b) crack length interval from 70 x 103 – 100 x103 (c) crack length interval from 90 x 103 – 100 x 103.
Figure 12: Sketch chowing crack blunting at the crack tip was correlated with creation of plastic zone.
Figure 14: The effect of Hi-Lo for R 0.1.
(a) (b)
(c)
Figure 15: Extension of crack length in function of numbers of cycles of R 0.7 (a) CA and block loading (b) crack length interval from 60 x 103 – 100 x103 (c) crack length interval from 90 x 103 – 100 x 103.
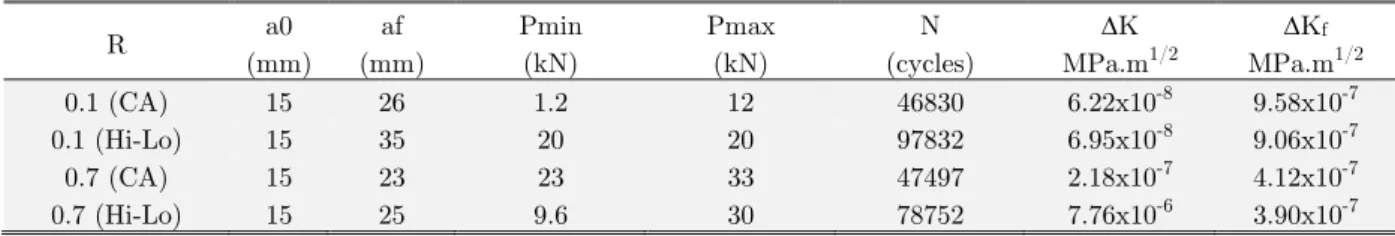
R a0
(mm) af (mm)
Pmin (kN)
Pmax (kN)
N (cycles)
K MPa.m1/2
Kf
MPa.m1/2
0.1 (CA) 15 26 1.2 12 46830 6.22x10⁻⁸ 9.58x10⁻⁷
0.1 (Hi-Lo) 15 35 20 20 97832 6.95x10⁻⁸ 9.06x10⁻⁷
0.7 (CA) 15 23 23 33 47497 2.18x10⁻⁷ 4.12x10⁻⁷
0.7 (Hi-Lo) 15 25 9.6 30 78752 7.76x10⁻⁶ 3.90x10⁻⁷
Figure 16: The effect Hi-Lo loading for R 0.7.
4 CONCLUSIONS
The determination of this study was highlight regarding to the load sequence effects of FCG of off-shore pipeline steel. The two-level block sequence designated as Hi-Lo was tested experimentally in this studied. Both blocks were designed to retain the stress ratio of 0.1 and 0.7. It was found a number of cycles delayed about 2 times longer as compare to baseline cyclic R of 0.1. At R of 0.7 about 96% number of cycles delayed was obtained correspond to the load sequence effect. In regard to effect of the load sequence, crack growth faster with the increased in R. An increased of the R also promoted crack acceleration thus vanished the beneficial effect of crack delays. The FCG rates within the steady state region were associated mainly by the SIF range. Following the sudden de-creased of either the maximum SIF or SIF range between two-level block sequences generates a primary and secondary plastic zone as a result of overload retardation. The delayed of crack growth more intense when the amount of load decreased was lesser. The transient state of FCG rates was observed in da/dN-a curve. It was suggested the deceleration of cracks growth was due to the for-mation of plastic zone at the crack tip. It was also presumed the compressive residual stress was created due to unloading to satisfy the equilibrium stress state.
References
Beden, S., Abdullah, S., Ariffin, A. (2009). Review of fatigue crack propagation models for metallic components. European Journal of Scientific Research 28(3): 364-397.
Benachour, M., Benachour, N., Benguediab, M. (2013). Effect of single overload ratio and stress ratio on fatigue crack growth. International Journal of Mechanical, Aerospace, Industrial, Mechatronic and Manufacturing Engineer-ing 7(12): 2542-2546.
Blasón, S., Correia, J.A.F.O., Apetre, N., Arcari, A., De Jesus, A.M.P., Moreira, P., Fernández-Canteli, A. (2016). Proposal of a fatigue crack propagation model taking into account crack closure effects using a modified CCS crack growth model. Procedia Structural Integrity 1:110-117.
Jones, R., Molent, L., Walker, K. (2012). Fatigue crack growth in a diverse range of materials. International Journal of Fatigue 40(0): 43-50.
Kujawski, D. (2005). On assumptions associated with ΔKeff and their implications on FCF predictions. International
Journal of Fatigue 27(10–12): 1267-1276.
Li, S., Kang, Y., Zhu, G., Kuang, S. (2015). Microstructure and fatigue crack growth behavior in tungsten inert gas welded DP780 dual-phase steel. Materials & Design 85:180-189.
Li, Y., Wang, H., Gong, D. (2012). The interrelation of the parameters in the Paris equation of fatigue crack growth. Engineering Fracture Mechanics 96(0): 500-509.
Maljaars, J., Pijpers, R., Slot, H. (2015). Load sequence effects in fatigue crack growth of thick-walled welded C–Mn steel members. International Journal of Fatigue 79:10-24.
Martelo, D.F., Chapetti, M.D. (2015). Analysis of the importance of the crack closure in the driving force for the fatigue crack growth in metastable austenitic stainless steels. Procedia Materials Science 9:387-395.
Mohanty, J.R., Verma, B.B., Ray, P.K. (2009). Prediction of fatigue crack growth and residual life using an expo-nential model:Part I(Constant Amplitude Loading). International Journal of Fatigue 31(3):418-424.
Murthy, A.R.C., Palani, G.S., Iyer, N.R. (2004). State-of-the-art review on fatigue crack growth analysis under vari-able amplitude loading. Journal of the Institution of Engineers India 85:118-129.
Pereira, M.V.S., Darwish, F.A.I., Camarão, A.F., Motta, S.H. (2007). On the prediction of fatigue crack retardation using Wheeler and Willenborg models. Materials Research.
Rathod, V., Yadav, O.P., Rathore, A., Jain, R. (2011). Probabilistic modeling of fatigue damage accumulation for reliability prediction. Journal of Quality and Reliability Engineering 2011(10).
Rushton, P.A., Taheri, F. (2003). Prediction of crack growth in 350wt steel subjected to constant amplitude with over- and under-loads using a modified Wheeler approach. Marine Structures 16(7):517-539.
Toribio, J., González, B., Matos, J.C., Ayaso, F.J. (2015). Effect of sudden load decrease on the fatigue crack growth in cold drawn prestressing steel. International Journal of Fatigue 76:53-59.
Zerbst, U., Beretta, S., Köhler, G., Lawton, A., Vormwald, M., Beier, H. T., Klinger, C., Černý, I., Rudlin, J., Heck-el, T., Klingbeil, D. (2013). Safe life and damage tolerance aspects of railway axles – A Review. Engineering Frac-ture Mechanics 98: 214-271.