ACPD
10, 9463–9646, 2010Review: southern Asian pollution
outflow
M. G. Lawrence and J. Lelieveld
Title Page
Abstract Introduction
Conclusions References
Tables Figures
◭ ◮
◭ ◮
Back Close
Full Screen / Esc
Printer-friendly Version
Interactive Discussion Atmos. Chem. Phys. Discuss., 10, 9463–9646, 2010
www.atmos-chem-phys-discuss.net/10/9463/2010/ © Author(s) 2010. This work is distributed under the Creative Commons Attribution 3.0 License.
Atmospheric Chemistry and Physics Discussions
This discussion paper is/has been under review for the journal Atmospheric Chemistry and Physics (ACP). Please refer to the corresponding final paper in ACP if available.
Atmospheric pollutant outflow from
southern Asia: a review
M. G. Lawrence1,2and J. Lelieveld1,3
1
Max Planck Institut for Chemistry, Atmospheric Chemistry Department, Mainz, Germany 2
University of Mainz, Institute for Physics of the Atmosphere, Mainz, Germany 3
Cyprus Institute, Nicosia, Cyprus
Received: 28 February 2010 – Accepted: 8 March 2010 – Published: 15 April 2010 Correspondence to: M. G. Lawrence (mark.lawrence@mpic.de)
ACPD
10, 9463–9646, 2010Review: southern Asian pollution
outflow
M. G. Lawrence and J. Lelieveld
Title Page
Abstract Introduction
Conclusions References
Tables Figures
◭ ◮
◭ ◮
Back Close
Full Screen / Esc
Printer-friendly Version
Interactive Discussion Abstract
Southern Asia is one of the most heavily populated regions of the world. Biofuel and biomass burning play a disproportionately large role in the emissions of most key pol-lutant gases and aerosols there, in contrast to much of the rest of the Northern Hemi-sphere, where fossil fuel burning and industrial processes tend to dominate. This
re-5
sults in polluted air masses which are enriched in carbon-containing aerosols, carbon monoxide, and hydrocarbons. The outflow and long-distance transport of these pol-luted air masses is characterized by three distinct seasonal circulation patterns: the winter monsoon, the summer monsoon, and the monsoon transition periods. During winter, the near-surface flow is mostly northeasterly, and the regional pollution forms a
10
thick haze layer in the lower troposphere which spreads out over millions of square km between southern Asia and the Intertropical Convergence Zone (ITCZ), located several degrees south of the equator over the Indian Ocean during this period. During summer, the heavy monsoon rains effectively remove soluble gases and aerosols. Less solu-ble species, on the other hand, are lifted to the upper troposphere in deep convective
15
clouds, and are then transported away from the region by strong upper tropospheric winds, particularly towards northern Africa and the Mediterranean in the tropical east-erly jet. Part of the pollution can reach the tropical tropopause layer, the gateway to the stratosphere. During the monsoon transition periods, the flow across the Indian Ocean is primarily zonal with the trade winds, and strong pollution plumes originating from
20
ACPD
10, 9463–9646, 2010Review: southern Asian pollution
outflow
M. G. Lawrence and J. Lelieveld
Title Page
Abstract Introduction
Conclusions References
Tables Figures
◭ ◮
◭ ◮
Back Close
Full Screen / Esc
Printer-friendly Version
Interactive Discussion 1 Introduction
In 1999, several hundred scientists from around the world gathered in the Maldives, lo-cated in the northern Indian Ocean, as well as onboard two research ships and at sev-eral Indian coastal sites, to carry out the Indian Ocean Experiment (INDOEX). A central idea was to make use of the “unique natural laboratory” offered by the Indian Ocean
5
troposphere, “probably the only place in the world where an intense source of conti-nental aerosols, anthropogenic trace species and their reaction products (e.g., sulfates and ozone) from the Northern Hemisphere is directly connected to the pristine air of the Southern Hemisphere by a cross equatorial monsoonal flow into the intertropical con-vergence zone (ITCZ)” (see http://www-indoex.ucsd.edu/publications/proposal/).
Dur-10
ing the several years leading up to the 1999 campaign, INDOEX grew into a major international undertaking, including several pre-INDOEX cruises, the development of ground stations with various instrumentation, and culminating in an Intensive Field Phase (IFP) from January to April 1999, which included two research vessels, five aircraft, balloon sondes, constant level balloons, and retrievals from several
satel-15
lites. INDOEX was exemplary in integrating these field and satellite measurements with chemistry-transport and climate modeling. The findings have resulted in several hundred publications, including two special sections each in the AmericanJournal of Geophysical Research and the Indian journal Current Science, as well as dozens of other publications in these and other journals, including several articles inScienceand
20
Nature.
INDOEX made it clear that the large-scale pollutant export from southern Asia was much more substantial than had been expected, and modeling studies have even pre-dicted that the Asian air pollution emissions (also from other parts of Asia) will play an increasingly important role in the air quality of North America and Europe (Lelieveld
25
ACPD
10, 9463–9646, 2010Review: southern Asian pollution
outflow
M. G. Lawrence and J. Lelieveld
Title Page
Abstract Introduction
Conclusions References
Tables Figures
◭ ◮
◭ ◮
Back Close
Full Screen / Esc
Printer-friendly Version
Interactive Discussion be clearly seen in visible satellite images, and which is responsible for a significant
perturbation to the regional atmospheric energy balance. Shortly after INDOEX, this aerosol layer came to be known as the “Asian Brown Cloud,” or “ABC”. Since then, it has been broadly accepted that the acronym “ABC” should be generalized to “Atmo-spheric Brown Clouds” (Ramanathan and Crutzen, 2003), in recognition of the fact that
5
pollutant outflow layers like this, containing various types of aerosols and trace gases, are by no means confined to the southern Asian region. A major international effort to better understand such pollution layers which has grown out of this is the UNEP ABC program (http://www.rrcap.unep.org/abc/). The first focus of UNEP/ABC has been the ABC-Asia component, which has set up an array of monitoring sites and produced
10
several assessments of the Asian ABCs and their effects.
INDOEX was not the only experiment that has been focused on pollutant outflow in this region; a number of other smaller field campaigns and independent modeling studies have also provided information on the composition of the regional atmosphere and ocean during the winter months. Furthermore, the winter monsoon is not the
15
only period of interest for pollutant outflow. During INDOEX, several of the scientists participating in the campaign began thinking forward and posed the question “what happens to all that pollution during the summertime, when the summer monsoon deep convection is prevalent over the Indian subcontinent?” We were especially curious if any of this pollution could make its way over to Europe in the upper tropospheric
20
easterlies. This seed eventually grew into the field campaign MINOS (Mediterranean Intensive Oxidants Study), which was based out of Crete in 2001. MINOS provided clear evidence that the airspace above the Mediterranean is a “crossroads” of pollution (Lelieveld et al., 2002) from Europe, North America, and indeed from the summer monsoon outflow of southern Asia. A further insight into the seasonality of the air
25
ACPD
10, 9463–9646, 2010Review: southern Asian pollution
outflow
M. G. Lawrence and J. Lelieveld
Title Page
Abstract Introduction
Conclusions References
Tables Figures
◭ ◮
◭ ◮
Back Close
Full Screen / Esc
Printer-friendly Version
Interactive Discussion During the decade since INDOEX, the advancement in our understanding of
pollu-tant export from southern Asia has been tremendous. In this review, we discuss the most salient findings on this topic. For the sake of this review, we consider southern Asia to be the region depicted in Fig. 1, which includes the region which is often sepa-rately characterized as southeastern Asia. We begin by describing the current state of
5
knowledge of pollutant emissions from this region (Sect. 2), and then give an overview of the seasonal regional meteorological characteristics (Sect. 3). Following this, we review the studies characterizing the pollutant export during each of the three key pe-riods: the winter monsoon (Sect. 4), the summer monsoon (Sect. 5) and the monsoon transition periods (Sect. 6). Finally, we conclude (Sect. 7) with a summary of the major
10
lessons learned over the last decade and an outlook to remaining research needs on this topic during the coming decades. Parts of this review build on an earlier review of the southern Asian pollution outflow (Lawrence, 2004), which is occasionally referred to in order to indicate the development in our state of understanding since then.
2 Estimates of current southern Asian emissions and future increases
15
Southern Asia is a region with a vibrant mixture of cultures which comprises over a quarter of the world’s population. Stretching from Afghanistan and Pakistan in the west to Indonesia and Papua New Guinea in the east, and bounded on the north by China and the former Soviet Union and on the south by the Indian Ocean, the widely-varying landscape includes seashores, tropical rainforests, vast plains, and the foothills of the
20
Himalayas. People dominate much of this landscape, partly gathered in megacities like Delhi and Bangkok, but also dotting the extensive rural environment in small vil-lages, many without electricity and running water. One activity that is common to all people amidst this immense diversity is fuel consumption for energy production, for instance biofuel burning in cookstoves, fossil fuel burning in vehicles, and burning coal
25
ACPD
10, 9463–9646, 2010Review: southern Asian pollution
outflow
M. G. Lawrence and J. Lelieveld
Title Page
Abstract Introduction
Conclusions References
Tables Figures
◭ ◮
◭ ◮
Back Close
Full Screen / Esc
Printer-friendly Version
Interactive Discussion Hemisphere, the sheer size and rapid growth of the southern Asian population and the
often poorly-controlled burning conditions lead to large emissions of various pollutants, including: greenhouse gases like carbon dioxide (CO2) and methane (CH4); ozone precursors such as nitrogen oxides (NOx=NO+NO2), carbon monoxide (CO) and Non-Methane Volatile Organic Compounds (NMVOCs); aerosol particle precursors such as
5
sulfur dioxide (SO2); and primary particles comprised of various materials or mixtures such as soot and organic compounds.
2.1 Regional trace gas emissions
Pollutant sources in Asia are changing so rapidly that any overview of current emis-sions only provides a snapshot, with a relatively large degree of uncertainty. Various
10
sources of information on Asian emissions exist, such as official national databases, and gridded databases developed for regional modeling studies (e.g., Streets et al., 2003, 2006; Akimoto et al., 2006; Ohara et al., 2007; Cofala et al., 2007). In order to make an internally consistent comparison of the characteristics of southern Asian emis-sions with those from other major emitter regions of the Northern Hemisphere (NH),
15
here we make use of the global emissions data in the Emissions Database for Global Atmospheric Research (EDGAR, version 3.2FT2000; Oivier et al., 2005). These data, which are for the year 2000, should be representative of the prevailing conditions dur-ing the INDOEX and MINOS campaigns (1999 and 2001, respectively). Four regions are selected for comparison here, as depicted in Fig. 1. The total emissions of several
20
trace gases for these regions, along with the global totals for each gas, are listed in Ta-ble 1, broken down into several major source categories. TaTa-ble 2 lists the percentages of the global totals represented by each region, along with the relative contribution of each major source category to the total emissions for each region. This is an extension of the comparison that we presented previously in Lelieveld et al. (2001), but based on
25
ACPD
10, 9463–9646, 2010Review: southern Asian pollution
outflow
M. G. Lawrence and J. Lelieveld
Title Page
Abstract Introduction
Conclusions References
Tables Figures
◭ ◮
◭ ◮
Back Close
Full Screen / Esc
Printer-friendly Version
Interactive Discussion As noted above, there is a considerable degree of uncertainty in most of these
val-ues. The emissions are mostly computed as the products of activity data (e.g., mass of fuel burned) times emissions factors (mass of emissions per unit of activity). The activ-ity data, especially for residential activities like cooking with stoves, can be very difficult to ascertain, and some emissions factors are based on upscaling of only one or a few
5
measurements appropriate to the various combustion or other industrial processes in different regions. In most cases a serious, quantitative uncertainty estimate is not even possible at present. This is reflected in the significant quantitative differences which have been shown to exist between various emissions datasets, including EDGAR (e.g., Butler et al., 2008). Furthermore, for the Asian region large discrepancies have been
10
found between bottom-up emissions inventories like these, versus top-down emissions estimates based on combining observations and model simulation results. Kasibhatla et al. (2002) showed that top-down estimates based on CO observations downwind of eastern Asia implied much higher emissions rates than in emissions datasets available at that time. Indeed, follow-up work by Streets et al. (2006) has confirmed this and
15
revised the CO emissions estimates from China substantially upward, particularly due to industrial processes like cement and brick kilns and iron and steel production, and furthermore conclude that “emissions from the residential sector might still be under-estimated.” Nevertheless, despite these uncertainties, data such as these are currently the best available for global modeling studies and as a basis for mitigation efforts, and
20
a few basic, qualitative, features in the emissions distribution are clearly evident from the comparison in Tables 1 and 2.
One of the clearest features is that emissions from southern Asia are strongly influ-enced by inefficient combustion processes, especially emissions from biofuel burning in cookstoves. This can be seen clearly in Table 2, which shows that Biofuel
Burn-25
ACPD
10, 9463–9646, 2010Review: southern Asian pollution
outflow
M. G. Lawrence and J. Lelieveld
Title Page
Abstract Introduction
Conclusions References
Tables Figures
◭ ◮
◭ ◮
Back Close
Full Screen / Esc
Printer-friendly Version
Interactive Discussion Other types of inefficient combustion are also prevalent in southern Asia, such as the
widespread use of two-stroke engines, which are often made even more inefficient by running them on adulterated fuels (e.g., kerosene mixed in with diesel). Compared to more efficient combustion (e.g., modern automobiles), these inefficient combustion processes burn at lower temperatures, resulting in less emissions of NOx, and they
5
burn less well to completion, resulting in higher CO/CO2 ratios and a greater content of unburned or only partially oxidized VOCs. This is also reflected in Table 2: southern Asia contributes a disproportionally large share to the total global emissions of CO and NMVOC, approximately 1.5 times as large as its relative contribution to the total global CO2and NOxemissions. Similar tendencies are seen in an analysis of emissions from
10
individual Asian countries (Wuebbles et al., 2007) based on the data from Streets et al. (2003); such analyses show that the emissions from the southern and northern Asian regions (based on Fig. 1) are dominated by India and China, respectively, with these two countries accounting for 60%, 64%, and 54% of the total Asian emissions of NOx, CO and NMVOC, respectively.
15
A few other broad features of the emissions distributions are clear in Tables 1 and 2. First, in southern Asia, Biomass Burning (BMB) is also a significant source of most of the gases (except SO2), representing a notably larger fraction of the regional emis-sions for most of the gases than is contributed by biomass burning in the other three main NH emitter regions (especially for CO2, though with a few exceptions, such as
20
CO in North America, due to unusually strong fires in the northwestern USA during the year 2000). On the other hand, the fraction of biomass burning emissions in southern Asia is smaller than in the global total emissions for all of the gases, which is due to the predominance in this category of emissions from deforestation in Africa and South America. Second, the per capita energy usage in southern Asia is considerably smaller
25
ACPD
10, 9463–9646, 2010Review: southern Asian pollution
outflow
M. G. Lawrence and J. Lelieveld
Title Page
Abstract Introduction
Conclusions References
Tables Figures
◭ ◮
◭ ◮
Back Close
Full Screen / Esc
Printer-friendly Version
Interactive Discussion North America for CO2 and NOxin terms of their distribution across the source
cate-gories, being dominated by fossil fuel burning. However, they differ notably for CO and NMVOCs, for which biofuel burning becomes particularly important in northern Asia, and for which the other source categories such as industrial processes play strongly varying roles. Northern Asia is also responsible for a disproportionately large fraction
5
of the global total SO2emissions, mainly due to the sulfur-rich coal which is burned in Chinese power plants.
The spatial distributions of total NOxand CO emissions in Asia are shown in Fig. 2, along with the regional population distribution. Particularly densely-populated regions in southern Asia include the northern part of India (the Indo-Gangetic Plain) and the
10
southern tip of India, Bangladesh, Indonesia (primarily Java) and the Philippines, along with several major cities like Mumbai, Bangkok and Hanoi. In northern Asia the most densely-populated regions include northeast China, the Szechuan Basin, the Pearl River Delta (including Hong Kong), Korea, and Japan. The emissions distributions for both NOxand CO largely follow the population distribution, which is not surprising,
15
given that in global emissions inventories like EDGAR, the emissions from several of the source categories are distributed primarily by population. There are, however, a few notable exceptions, including the disproportionately high CO emissions compared to population in several regions, especially where biofuel and biomass burning in less populated rural regions are prevalent, such as throughout parts of Myanmar, Thailand,
20
Laos, Cambodia, Vietnam, and especially the islands of Borneo and western Suma-tra. In contrast to this, the NOxemission distribution tends to be clustered more tightly around the most densely-populated regions, especially in northeastern China, and is generally less spread out than CO emissions, due to the greater CO emissions from distributed and rural sources, especially biomass burning. (Note that the total Asian CO
25
ACPD
10, 9463–9646, 2010Review: southern Asian pollution
outflow
M. G. Lawrence and J. Lelieveld
Title Page
Abstract Introduction
Conclusions References
Tables Figures
◭ ◮
◭ ◮
Back Close
Full Screen / Esc
Printer-friendly Version
Interactive Discussion Finally, the emissions of most gaseous pollutants in Asia (both northern and
south-ern) are growing at a tremendous rate (e.g., Akimoto, 2003), due to growing popu-lations, accompanied by rapid industrialization and agricultural developments. This anticipated rapid growth in Asia is depicted in Fig. 3, and is compared with the antic-ipated changes for the nations of the OECD (Organization of Economic Co-operation
5
and Developments). While there is a considerable spread in the likely range of changes for each gas, it is clear that the emissions of nearly all gases are expected to increase in Asia, while emissions of most gases from the OECD nations could either increase or decrease (with the exception of SO2, which will almost certainly decrease, and CO2, which will almost certainly increase). There is, however, an even greater uncertainty in
10
future scenario estimates than in the current emissions inventories discussed above. In the end, the actual increase in anthropogenic emissions of various pollutants will de-pend on which new regulations are implemented and enforced in the individual coun-tries, which will in turn depend in part on the local tolerance for increasing pollution levels, from the perspective of it being one of many daunting social issues, and will also
15
depend on the detailed scientific information on emissions and their impacts which is available to policy makers.
2.2 Regional aerosol emissions
In addition to the trace gases discussed in the previous section, and likely even more important for health and climate effects, southern Asia also has substantial and
grow-20
ing emissions of aerosols and aerosol precursors, with trends in the emissions similar to those discussed in the previous section for gases. Sulfate aerosols, which derive mostly from SO2, can make an important contribution to the air pollution in some re-gions, but on the whole are a much larger problem in northern Asia than in southern Asia (see Table 1). The same applies to desert dust particles, being of natural origin, as
25
ACPD
10, 9463–9646, 2010Review: southern Asian pollution
outflow
M. G. Lawrence and J. Lelieveld
Title Page
Abstract Introduction
Conclusions References
Tables Figures
◭ ◮
◭ ◮
Back Close
Full Screen / Esc
Printer-friendly Version
Interactive Discussion too, contributing about 10% of the particulate mass observed over the northern Indian
Ocean (Lelieveld et al., 2001). On the other hand, southern Asia is particularly influ-enced by emissions of carbon-containing aerosols and precursors, since these tend to be most strongly emitted by inefficient combustion processes. Organic carbon primary aerosols and precursors of Secondary Organic Aerosols (SOA) tend to generally be
5
closely related to gas-phase NMVOC emissions, which were discussed in the previous section (see Tables 1 and 2). Another important product of inefficient combustion is Black Carbon (BC; the terminology used for black carbon varies from study to study, with some authors using “Elemental Carbon (EC)”, “refractory carbon”, “Refractory Or-ganic Matter (ROM)”, “soot”, and “Soot Carbon (SC)” interchangeably with BC, and
10
others using these terms to denote some specific subset of the total BC, often depen-dent on which measurement techniques are employed). BC is an effective absorber of sunlight, in contrast to most other aerosols, which are effective scatterers, and thus it plays a unique role in the regional anthropogenic climate effects, as discussed below in Sect. 4.
15
The uncertainties in BC emissions are very large. The total BC emissions from India have been estimated by Venkataraman et al. (2005) to be 0.41 Tg(BC)/yr, with 0.17 Tg(BC)/yr from biofuel burning (especially fuelwood in cookstoves), 0.14 Tg(BC)/yr from open biomass burning, and 0.1 Tg(BC)/yr from fossil fuel burning. As noted above in Table 2 for CO and NMVOC, in India (and generally in southern Asia)
20
biofuel burning makes a much larger relative contribution to the total BC emissions than throughout most of the rest of the world. One uncertainty which remains to be resolved has been pointed out by Dickerson et al. (2002). Like the study of Venkataraman et al. (2005), most emissions inventories indicate a total BC source from India of ap-proximately 0.5 Tg(BC)/yr (or∼0.7 Tg(BC)/yr from southern Asia, with an upper limit of
25
ACPD
10, 9463–9646, 2010Review: southern Asian pollution
outflow
M. G. Lawrence and J. Lelieveld
Title Page
Abstract Introduction
Conclusions References
Tables Figures
◭ ◮
◭ ◮
Back Close
Full Screen / Esc
Printer-friendly Version
Interactive Discussion Another uncertainty which has proven very difficult to resolve, as was already
ap-parent shortly after INDOEX, is to determine whether the dominant source for BC in the southern Asian outflow is Fossil Fuel Burning (FFB) or biofuel and biomass burn-ing (BFB+BMB). Several studies (Novakov et al., 2000; Mayol-Bracero et al., 2002; Salam et al., 2003; Stone et al., 2007) have concluded FFB must be the main BC
5
source (from just over half to up to 90% of the total). These studies have employed “top down” approaches, such as measuring ratios of BC to total carbon (the sum of BC and organic carbon), as well as ratios of BC to other aerosol components such as potassium, water-soluble ions, organic markers and trace metals. However, other top down studies have instead concluded that BFB+BMB is likely to be the primary BC
10
source, based on the concentrations of biomass burning tracers like potassium and acetonitrile (Guazotti et al., 2003), the ratio of BC to CO (Dickerson et al., 2002), the ratio of radiocarbon monoxide (14CO) to CO north and south of the ITCZ (Lelieveld et al., 2001), and by considering correlations of aerosol optical depth with fire count data based on satellite observations with the ATSR instrument (Leon et al., 2001).
15
Yet others, such as Ball et al. (2003), found that BC was well-correlated with markers for both FFB and BFB+BMB, indicating a mixture of the two sources, and speculat-ing that perhaps some other unaccounted processes could be involved. Guazotti et al. (2003) offer a particularly useful insight which may help to explain at least some of the discrepancy in these top down studies: for airmasses from India, they found
20
BFB+BMB to be the dominant source (74% of the total), while for airmasses originat-ing from the Arabian peninsula, FFB was found to be dominant (63%). Furthermore, based on “bottom up” studies using regional and global emissions inventories (Reddy and Venkataraman, 2002a, b; Dickerson et al., 2002; Mayol-Bracero et al., 2002; Bond et al., 2004; Venkataraman et al., 2005; Parashar et al., 2005), one would also expect
25
ACPD
10, 9463–9646, 2010Review: southern Asian pollution
outflow
M. G. Lawrence and J. Lelieveld
Title Page
Abstract Introduction
Conclusions References
Tables Figures
◭ ◮
◭ ◮
Back Close
Full Screen / Esc
Printer-friendly Version
Interactive Discussion different conclusions in these studies is depicted in Fig. 4.
After this decade of debate, a major new step towards resolving this discrepancy has been made by the recent study of Gustafsson et al. (2009), which uses the alternate approach of measuring the14C content of the aerosol particles. This unambiguously indicates the fraction originating from FFB versus BFB+ BMB, since fossil fuels are
5
completely depleted in14C (which has a half-life of 5730 years), while aerosols deriving from BFB+BMB will have a 14C concentration (relative to12C) which is the same as measured in contemporary biomass (a small uncertainty, of the order of 10%, arises due to the difference in14C enrichments found in freshly-produced living biomass com-pared to wood from old or dead trees, especially due to the influence of elevated
at-10
mospheric14CO2 levels in the mid-1900s which resulted from nuclear bomb testing). Using measurements from a site on the west coast of India and from a site on the Maldives (southwest of India), made during the offshore flow period of the winter mon-soon (see Sect. 3), they found that about two-thirds of the bulk carbonaceous aerosols (including both BC and organic carbon) were produced by BFB+BMB, the other third
15
originating from FFB. This result is very consistent between the two sites. They also employed two different techniques of separating out the BC component from the total carbonaceous aerosol. For one method of isolating the BC (yielding “Soot Carbon”, or SC), a similar fraction of about 2/3 from BFB+BMB was computed, again being nearly the same for the two measurement sites. For the other isolation method
(yield-20
ing “elemental carbon”, or EC), however, only about half was computed to originate from BFB+BMB, the other half from FFB; furthermore, for this component, the results differed notably between the two sites, with the Indian coastal site aerosols indicating about 60% of the EC derived from BFB+ BMB. The reason for this difference is un-clear; although it may be related to the regional origins of the airmasses being sampled
25
ACPD
10, 9463–9646, 2010Review: southern Asian pollution
outflow
M. G. Lawrence and J. Lelieveld
Title Page
Abstract Introduction
Conclusions References
Tables Figures
◭ ◮
◭ ◮
Back Close
Full Screen / Esc
Printer-friendly Version
Interactive Discussion will be the most critical processes to focus on, but FFB processes will be important to
target as well.
The aerosol and gas emission characteristics discussed in this section are one of the key elements in determining the characteristics of southern Asian pollution outflow. Another key element is the regional meteorology, which exhibits important variations on
5
various timescales, from diurnal and synoptic up to seasonal and interannual. The key characteristics of the regional meteorology are described in the next section, prior to discussing the combined effects of emissions and meteorology on the pollution outflow in the sections following that.
3 Meteorological setting of southern Asia
10
The regional meteorology of southern Asia is dominated by the Asian monsoon cir-culation. An overall picture of the key surface-level monsoon flow regimes is given in Fig. 5. The monsoon meteorology can be broken down into three basic periods: the summer or southwest (SW) monsoon, the winter or northeast (NE) monsoon, and the Monsoon Transition Periods (MTP).
15
The torrential rains of the Asian summer monsoon are well known – for example, Cherrapunji in eastern India receives almost 12 m of rain per year. Every summer, steady onshore winds bring air from the ocean over the continent (Fig. 5a), which has been heated by the tropical overhead sun. The moist, hot air in the surface layer rises, due to buoyancy as well as orographic forcing over features such as the Western Ghats
20
Mountains at the Indian coast. The rising air cools, causing water to condense, form-ing cloud droplets and heatform-ing the airmasses due to the enthalpy (latent heatform-ing) of condensation, which reinforces the buoyant rising motion. This results in moist, deep convection, in which the air parcels can ascend several km in the cores of cumulus con-vective towers, often reaching and sometimes even penetrating the tropopause. The
25
ACPD
10, 9463–9646, 2010Review: southern Asian pollution
outflow
M. G. Lawrence and J. Lelieveld
Title Page
Abstract Introduction
Conclusions References
Tables Figures
◭ ◮
◭ ◮
Back Close
Full Screen / Esc
Printer-friendly Version
Interactive Discussion seen as a major feature of the region in satellite images. Deep convection can build up
to virtually explosive energies, with updraft speeds in this region often exceeding 1 m/s, and sometimes exceeding 10 m/s, and can transport largely intact air parcels from the surface to the Upper Troposphere (UT) in less than an hour.
Once the air reaches the UT, it typically encounters much faster winds than those
5
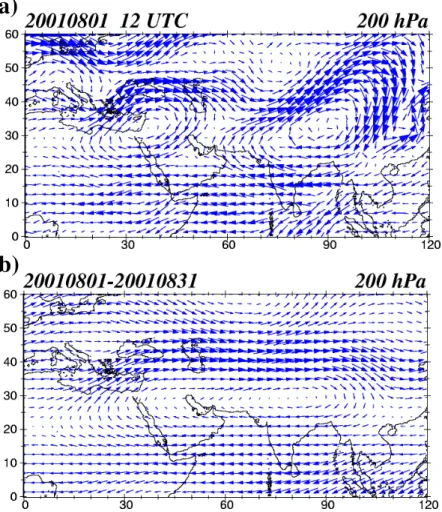
which are found near the surface. Over southern Asia, the convergence of air masses from the outflow of the monsoon convection results in a high pressure region in the UT typically centered somewhat south of Tibet, around which air tends to flow in an anti-cyclonic (clockwise) direction. Another prevalent UT anticyclone is located to the west of this over Arabia. A snapshot of these two anticyclones is depicted in Fig. 6a.
10
The two anticyclones meander back and forth to the east and west, so that averaged over a month their central north-south branches tend to cancel each other out, and the mean circulation of the region is dominated by a large, elongated anticyclone, depicted in Fig. 6b. The combined east-to-west branches on the south side form the tropical easterly jet, which is in contrast to the westerlies which usually prevail in the UT of the
15
NH tropics.
During the summer monsoon, the most frequent intense convection is found in the ITCZ, where air masses from the northern and southern meteorological hemispheres converge. Throughout most of the world the ITCZ is located within a few degrees of the equator. Over Asia in summer, in contrast, it is generally located between 5◦N and
20
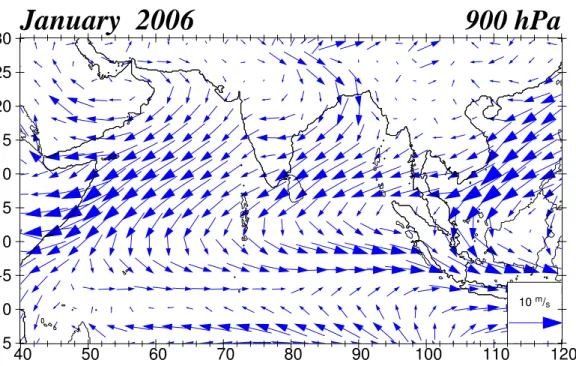
30◦N, directly over many of the highly populated and polluted regions of southern Asia. During the winter, the ITCZ migrates south with the solar heating, and is typically found between about 5◦S and 15◦S. The wintertime winds over much of southern Asia are generally from the NE to the SW (see Fig. 7), with some exceptions, especially the easterlies over central India, and the northwesterlies near the Himalayas. This period
25
ACPD
10, 9463–9646, 2010Review: southern Asian pollution
outflow
M. G. Lawrence and J. Lelieveld
Title Page
Abstract Introduction
Conclusions References
Tables Figures
◭ ◮
◭ ◮
Back Close
Full Screen / Esc
Printer-friendly Version
Interactive Discussion cloud-free northern Indian Ocean down to the equator. Typical travel times are about
7–10 days to reach the ITCZ (Eth ´e et al., 2002; de Gouw et al., 2001), where much of the air is then transported upwards in deep convective clouds. A nice demonstration of the typical flow patterns and variability during this period can be seen in the trajectories (Fig. 8) of 17 constant-level balloons which were released from the Indian coastal city
5
of Goa (near Mumbai).
Finally, during the MTP (around May and September), the ITCZ moves tens of de-grees to the north or south over a period of several weeks, the meridional monsoon winds weaken, and strong zonal winds transport emissions from Africa and southeast Asia over the central Indian Ocean.
10
The rest of this review will focus on the export of pollutants during the winter monsoon (Sect. 4), the summer monsoon (Sect. 5) and the MTPs (Sect. 6). From a meteorologi-cal standpoint, the summer monsoon has been studied in far greater depth, particularly by Indian meteorologists over the last century, due to its essential role in the supply of fresh water and thus in human health and agriculture. There are various theories about
15
the factors controlling the monsoon behavior, especially the characteristics of the sum-mer rainy period, including the overall amount and distribution of precipitation (spatial and temporal, including the “breaks” in the monsoon rains), which are discussed in a number of reviews of the monsoons (e.g., Gadgil, 2003; Webster et al., 1998). On the other hand, from the perspective of atmospheric chemistry and the export of
pollu-20
tion, the winter monsoon has thus far received the largest amount of attention. This is related to the much reduced removal rate of pollutants in the dry season and the asso-ciated potential for near-surface transport, as studied in the INDOEX and pre-INDOEX field campaigns which are discussed in the next section. The few measurements and modeling studies of long-range export of pollution during the summer monsoon and
25
ACPD
10, 9463–9646, 2010Review: southern Asian pollution
outflow
M. G. Lawrence and J. Lelieveld
Title Page
Abstract Introduction
Conclusions References
Tables Figures
◭ ◮
◭ ◮
Back Close
Full Screen / Esc
Printer-friendly Version
Interactive Discussion 4 The wintertime brown cloud
This section provides an overview of our understanding of the outflow of atmospheric pollutants from southern Asia during the wintertime, when the monsoon flow is primar-ily offshore towards the south (Fig. 5b). This outflow results in a thick layer of sunlight reflecting and absorbing aerosols and gases, an “Atmospheric Brown Cloud” covering
5
much of the region, both over continental southern Asia and over the Indian Ocean down past the equator to the ITCZ. This pollution outflow can readily be seen in visible satellite images (see Fig. 9 for an example), and is responsible for a significant pertur-bation to the regional atmospheric energy balance, especially due to the presence of a significant component of sunlight-absorbing carbonaceous aerosols. In this section we
10
will use the term “Southern Asian Wintertime Atmospheric Brown Cloud” (SAW-ABC) to refer to this lower-atmospheric pollution layer.
Numerous studies have examined the vast extent of the SAW-ABC, as well as its origins, chemical composition, and effects on the regional climate. Many of these pub-lications are based on INDOEX, and on subsequent analyses of the INDOEX
obser-15
vations and closely-related modeling studies. However, there have also been several other smaller field campaigns which took place before or after the INDOEX intensive field phase, as well as independent modeling and satellite-based studies that have provided further information on the composition of the atmosphere in this region dur-ing the winter months. In this section, we first give an overview of INDOEX and other
20
field campaigns which have examined the SAW-ABC, then describe the meteorological characteristics of the outflow, followed by a discussion of our state of knowledge about the pollutant origins, the chemical composition and chemical processing of gases and aerosols in the SAW-ABC, and its annual variability and potential future trends. We conclude the section with a discussion of the main observed, simulated, and
antic-25
ACPD
10, 9463–9646, 2010Review: southern Asian pollution
outflow
M. G. Lawrence and J. Lelieveld
Title Page
Abstract Introduction
Conclusions References
Tables Figures
◭ ◮
◭ ◮
Back Close
Full Screen / Esc
Printer-friendly Version
Interactive Discussion 4.1 Overview of INDOEX and other regional field campaigns
Most of our understanding of the outflow in the SAW-ABC derives from the Indian Ocean Experiment (INDOEX), a massive undertaking in several phases extending over five years, starting with an exploratory pre-INDOEX cruise in 1995 and culminating in an Intensive Field Phase (IFP) from January to April 1999. This section provides an
5
overview of INDOEX and several smaller field campaigns along with ongoing satellite observations and model studies.
Three major, interrelated objectives were noted in the INDOEX proposal (http: //www-indoex.ucsd.edu/publications/proposal/):
– Assess the significance of sulfates and other continental aerosols for global
ra-10
diative forcing;
– Assess the magnitude of the solar absorption at the surface and in the tropo-sphere including the ITCZ cloud systems; and
– Assess the role of the ITCZ in the transport of trace species and pollutants and their resultant radiative forcing.
15
As made clear in the discussion below, substantial progress was made not only on these objectives, but also on many other issues relevant to understanding the SAW-ABC and its effects. In order to achieve this, various types of measurements from numerous platforms were needed. Summaries of these are provided in various IN-DOEX publications, including the ININ-DOEX Operations Plan (Moore et al., 1999) and
20
the main campaign overview paper (Ramanathan et al., 2001), as well as several other overviews (Mitra, 1999, 2001, 2004; Lelieveld et al., 1999, 2001). INDOEX consisted of a First Field Phase (FFP) in 1998 and an Intensive Field Phase (IFP) in 1999, along with a few cruises and ground-based observations during the pre-INDOEX phase (1995– 1997). Table 3 provides a listing of the ship cruises during the various phases of
25
ACPD
10, 9463–9646, 2010Review: southern Asian pollution
outflow
M. G. Lawrence and J. Lelieveld
Title Page
Abstract Introduction
Conclusions References
Tables Figures
◭ ◮
◭ ◮
Back Close
Full Screen / Esc
Printer-friendly Version
Interactive Discussion cruise is not shown; the track was from Durban, South Africa to Colombo, Sri Lanka,
mostly on a south-to-north route along about 55◦E). Five aircraft were involved in the INDOEX IFP. Three were based out of the Mal ´e Airport in the Maldives: the NCAR C-130, the Dutch Cessna Citation, and the French Myst ´ere 20 (“M20”). In addition, two aircraft were based out of the Seychelles, as part of the APE-THESEO campaign
(Ste-5
fanutti et al., 2004): the German DLR Falcon, and the Russian Geophysica. The op-erations of these two aircraft were coordinated with the INDOEX opop-erations; however, they were mostly focused on cirrus properties in the upper troposphere, and will not be referred to in the discussion in this section. The flight trajectories for the two main air-craft measuring the SAW-ABC outflow in the northern Indian Ocean, the NCAR C-130
10
and the Dutch Citation, are shown in Figs. 12 and 13, respectively. The French Myst ´ere 20 flights with a backscatter lidar were mostly flown into the continental outflow to the north of the Maldives.
For the INDOEX IFP, along with the ships and aircraft, a ground station with extensive instrumentation was installed at the Kaashidhoo Climate Observatory (KCO) in the
15
Maldives, and surface observations were made at several sites along the Indian west coast, including Trivandrum and Goa. Balloon sondes were launched from KCO and from the ships, measuring ozone and meteorological parameters, and constant level balloons to observe air mass trajectories were launched from Goa (see Fig. 8). Finally, retrievals were made available from several satellites, among them the EUMETSAT
20
geostationary weather satellite Meteosat-5, which was relocated in early 1998 to 63◦E, over the Indian Ocean, to support the campaign.
In addition to these diverse observations, numerous model simulations were per-formed in support of the INDOEX measurements, both in the planning phase prior to the campaign, as well as for guiding the measurements during the campaign through
25
ACPD
10, 9463–9646, 2010Review: southern Asian pollution
outflow
M. G. Lawrence and J. Lelieveld
Title Page
Abstract Introduction
Conclusions References
Tables Figures
◭ ◮
◭ ◮
Back Close
Full Screen / Esc
Printer-friendly Version
Interactive Discussion paved the way for making such forecasts an important component of the flight planning
of nearly all atmospheric chemistry field campaigns already during the first few years after INDOEX, as summarized in Lawrence et al. (2003a).
After INDOEX, numerous individual research cruises were conducted examining the SAW-ABC outflow in the Arabian Sea, the Bay of Bengal, and the central Indian Ocean.
5
Among these were: a cruise with the Dutch RV Pelagia in the western Indian Ocean in April 2000 (Warneke and de Gouw, 2001); the BOBEX (Bay of Bengal Experiment) cruise with the RV Sagar Kanya during February–March 2001 (Naja et al., 2004; Lal et al., 2006; Ramachandran and Jayaraman, 2003); the PESO (Pilot Expedition to the Southern Ocean) cruise with the RV Sagar Kanya during January to April 2004, from
10
western India down to the Southern Ocean and back (Moorthy et al., 2005a; Pant et al., 2009), and a similar cruise during January to April 2006, reaching Antarctica with the Russian RV Akademik Boris Petrov (Vinoj et al., 2007). These have been compli-mented by island measurements, in particular ongoing measurements in the Maldives at the ABC Maldives Climate Observatory in Hanimadhoo (“MCOH”; Ramanathan et
15
al., 2007a), along with others, for instance, aerosol observations made on Minicoy is-land in the Arabian Sea (Moorthy and Satheesh, 2000) and Port Blair in the Bay of Bengal (Moorthy et al., 2003). An effort to integrate some of the observations from the mainland and islands into a focused network is underway in a new program called ARFI (Aerosol Radiative Forcing over India; Satheesh et al., 2009). A particular
high-20
light of the island-based measurements has been a small campaign called MAC (Mal-dives AUAV Campaign), which took place in March 2006, using AUAVs (automated unmanned aerial vehicles) flying in a stacked configuration to investigate the modifi-cation of the solar radiation budget by aerosols in the SAW-ABC (Ramanathan et al., 2007b; Ramana et al., 2007; Corrigan et al., 2008).
25
ACPD
10, 9463–9646, 2010Review: southern Asian pollution
outflow
M. G. Lawrence and J. Lelieveld
Title Page
Abstract Introduction
Conclusions References
Tables Figures
◭ ◮
◭ ◮
Back Close
Full Screen / Esc
Printer-friendly Version
Interactive Discussion March–May 2006. An overview of the campaign is given by Moorthy et al. (2008), and
numerous papers with results relevant to the SAW-ABC are in a special issue of the Journal of Earth System Science (vol. 117, No. S1, July 2008), along with further re-sults being published elsewhere (e.g., Satheesh et al., 2009). The primary objective of ICARB was “to characterize the physico-chemical properties and radiative effects
5
of atmospheric aerosols and trace gases over the Indian landmass and the adjoining oceanic regions of the Arabian Sea, northern Indian Ocean, and Bay of Bengal” (Moor-thy et al., 2008). An overview schematic of the campaign operations is given in Fig. 14. ICARB included ground-based measurements at various sites in India and on island stations (Colombo, Minicoy and Port Blair), an extensive ship cruise with the RV Sagar
10
Kanya, and 26 flights with the Indian NRSA Beechcraft 200 aircraft, based out of five different locations in India during the campaign (see Fig. 15 for details). The observa-tions period bridges the winter monsoon period and the monsoon transition period of late spring; in particular, the ICARB Sagar Kanya cruise leg in the Bay of Bengal was still during the winter monsoon, and some of these results will be noted in this section,
15
while the Arabian Sea leg was mainly during the monsoon transition period, and will be discussed in Sect. 6.
It is worth noting that in addition to these observations in the SAW-ABC outflow, many continental source-region observations have been made at sites throughout In-dia and other southern Asian countries, which have provided numerous insights into
20
urban and rural aerosol and gas pollutants. Since the focus in this paper is on the out-flow measurements, particularly over the marine regions, we will not attempt to provide a comprehensive overview of the continental observations as well. Several observa-tions, particularly at coastal sites, will be referred to in the following sections in order to support various points. Furthermore, in the context of this section it is worth briefly
dis-25
ACPD
10, 9463–9646, 2010Review: southern Asian pollution
outflow
M. G. Lawrence and J. Lelieveld
Title Page
Abstract Introduction
Conclusions References
Tables Figures
◭ ◮
◭ ◮
Back Close
Full Screen / Esc
Printer-friendly Version
Interactive Discussion several continental sites (e.g., Beegum et al., 2008; Dumka et al., 2008; Singh et
al., 2008; Badarinath and Kharol, 2008; Niranjan et al., 2008), which complimented the outflow observations.
The first of the 2004 ISRO-GBP campaigns (February 2004) was focused on using mobile labs which traveled over 15 000 km together and covered a substantial
cross-5
section of India. This campaign found notable pollution levels throughout the country (Moorthy et al., 2005b; Niranjan et al., 2005; Jayaraman et al., 2006; Nair et al., 2006; Singh et al., 2006). Coastal regions were found to usually have higher aerosol mass densities (50–150 µg/m3) than in the semiarid interior continental (typically around or below 30 µg/m3); small regions of enhanced aerosol mass densities were found around
10
industrialized and urban centers in both coastal and inland regions. An interesting hy-pothesis put forth from the observations along the eastern coast (Niranjan et al., 2005) is that part of the aerosol outflow from the eastern Indo-Gangetic Plain over the Bay of Bengal, where the small urban aerosols will pick up moisture and tend to grow rapidly into accumulation mode, may end up being recirculated back over the central
15
and southern eastern Indian coast, contributing substantially to the high aerosol opti-cal depths (AODs) observed there (the AOD is an indication of the amount of radiation at a given wavelength that is scattered or absorbed as the beam passes through the atmosphere; for an AOD of 1.0, the amount of radiation which is transmitted is e−1 of the intensity before passing through the atmosphere). Another important finding from
20
this campaign was that ozone levels tended to be higher downwind of heavily popu-lated regions than in the urban centers (Lal et al., 2008b; this is discussed further in Sect. 4.3.2). The second campaign (December 2004) focused particularly on the Indo-Gangetic Plain region, which was expected to be highly polluted based both on the im-pressions from the first campaign, as well as expectations from emissions distributions
25
ACPD
10, 9463–9646, 2010Review: southern Asian pollution
outflow
M. G. Lawrence and J. Lelieveld
Title Page
Abstract Introduction
Conclusions References
Tables Figures
◭ ◮
◭ ◮
Back Close
Full Screen / Esc
Printer-friendly Version
Interactive Discussion the “Delhi fog”, severe haze events which occur repeatedly during the wintertime, with
substantial ramifications such as regular shut-downs of the international airport (also extending to other urban regions around Delhi). The measurements (Tripathi et al., 2006; Ganguly et al., 2006; Ramachandran et al., 2006; Dey and Tripathi, 2007; Nair et al., 2007) clearly showed the high levels of aerosol pollution in this region; similarly,
5
trace gas observations (Lal et al., 2008a) showed very high levels of CO (frequently above 1000 nmol/mol) and NOx(frequently exceeding 20 nmol/mol). The mean aerosol loads were about 280 µg/m3, ranging from 100–400 µg/m3, resulting in mean aerosol optical depths (at 500 nm wavelength) in the range of 0.4–1.4. The single scattering albedo (SSA, the ratio of scattering to the sum of scattering and absorption) was as
10
low as 0.76 (at 500 nm wavelength) during fog events at the Hissar site (to the north of Delhi), indicating substantial absorption in some regions; this is in turn due to signifi-cant BC levels, measured to typically be in the range of 10–30 µg/m3, up to 65 µg/m3 during fog events in Delhi. As we will discuss below, in the continental outflow sin-gle scattering albedos are typically somewhat higher than this, suggesting that during
15
transport the atmospheric processing of the particulates may still add scattering com-pounds such as sulfate and organics, whereas deposition processes of the presumably well-mixed aerosols efficiently removes all types of aerosol compounds, including BC.
4.2 Outflow characteristics
4.2.1 Outflow channels and layers
20
The outflow of pollutants contributing to the SAW-ABC occurs primarily in two distinct layers: a pollutant plume within the MBL, from the surface to the MBL cap at about 800– 1000 m, and in an elevated layer between about 1–3 km. The flow in these two layers is qualitatively similar and dominated by the NE monsoon flow, though in the upper layer the airmasses generally have a slightly more easterly origin (Ramanathan et al.,
25
ACPD
10, 9463–9646, 2010Review: southern Asian pollution
outflow
M. G. Lawrence and J. Lelieveld
Title Page
Abstract Introduction
Conclusions References
Tables Figures
◭ ◮
◭ ◮
Back Close
Full Screen / Esc
Printer-friendly Version
Interactive Discussion into several different channels, which are similar near the surface and in the elevated
outflow layer, except that the airmasses in the elevated layer will generally originate more frequently from the heavily populated regions towards the east, in southern and southeastern Asia. Three primary flow channels were initially suggested by Krishna-murthi (1997a, b), and a fourth was added following INDOEX by Verver et al. (2001).
5
These four channels are depicted in Fig. 5b; from east to west they are: (1) western Arabian Sea; (2) Indo-Pakistan Desert off the Indian west coast; (3) western Bay of Bengal; (4) SE Asia. The channels are active intermittently, depending on the weather systems that are present in the region. Table 4 shows that channel 1 was the most persistent during the core INDOEX IFP, being active over 80% of the time, while
chan-10
nels 2 and 3 were active about half of the time, and channel 4 only about 1/3 of the time. Channels 2 and 3 were most relevant to the SAW-ABC measurements during the INDOEX campaign, which were made mainly in the region south and southwest of the Indian subcontinent (Lelieveld et al., 2001). An interesting side-note on the out-flow channels is worth making here: it was recently discovered (Anderson, 2009) that
15
the airflows basic to the SAW-ABC are also relevant for the traveling routes of insects, helping to explain the sudden appearance each year starting in October of millions of dragonflies on the Maldives, where they would normally not be expected in significant numbers (since they cannot reproduce there due to the lack of open fresh water). The insects may even be providing sustenance for migratory birds that also make use of
20
the tailwind to travel between India and Africa. It is unclear whether the substantial pollution in the SAW-ABC may be having an impact on these insects and migratory birds.
The separation of the outflow into a surface and an elevated layer was observed repeatedly during INDOEX and has been brought out in numerous analyses of the
25
ACPD
10, 9463–9646, 2010Review: southern Asian pollution
outflow
M. G. Lawrence and J. Lelieveld
Title Page
Abstract Introduction
Conclusions References
Tables Figures
◭ ◮
◭ ◮
Back Close
Full Screen / Esc
Printer-friendly Version
Interactive Discussion coast. During the day, the land heats up to temperatures exceeding the Sea Surface
Temperature (SST); the dry convective lofting of the warmed surface-layer airmasses over the land combined with the resultant pressure gradient results in a circulation with onshore flow (“sea breeze”) near the surface and a return flow at about 800–1000 m altitude, as depicted in Fig. 16. At night, the land cools offto temperatures below the
5
SST, and the reverse circulation (“land breeze”, see Fig. 20) develops. Due to the largely cloud-free conditions and the strong tropical solar radiation, a relatively strong land-sea breeze develops at the Indian east coast, although it is somewhat complicated by orographic flows due to the Western Ghats coastal mountain range (Mohanty et al., 2001), which have a mean altitude of about 800 m a.s.l. (above sea level).
10
The coastal airmasses lofted by the sea breeze into the region above the MBL are known as the “land plume”; in the context of the SAW-ABC they have also often been referred to simply as the “elevated layer”. Evidence of a strong land plume had al-ready been noted during the pre-INDOEX cruises, based on temperature profiles from radiosondes (Raman et al., 2002), but the substantial implications that this has for
15
aerosol and trace gas pollutant outflow first became clear during INDOEX. During the campaign, the elevated pollution layer was observed in various aerosol and trace gas measurements from several platforms, and it quickly became clear that for many com-ponents, the majority of the outflow (e.g., in terms of AOD or component mass) occurs in this elevated layer, rather than directly in the MBL (e.g., Manghnani et al., 2000;
20
Lelieveld et al., 2001; Ramanathan et al., 2001; Leon et al., 2001, Reiner et al., 2001; M ¨uller et al., 2001a, b; Sheridan et al., 2002; Chazette et al., 2003; Franke et al., 2003); similar observations have also been made since INDOEX, for example lidar aerosol vertical profile measurements clearly showing this phenomenon at Pune (Raj et al., 2008) and off both the east and west coasts during ICARB (Satheesh et al., 2009).
25
ACPD
10, 9463–9646, 2010Review: southern Asian pollution
outflow
M. G. Lawrence and J. Lelieveld
Title Page
Abstract Introduction
Conclusions References
Tables Figures
◭ ◮
◭ ◮
Back Close
Full Screen / Esc
Printer-friendly Version
Interactive Discussion The formation mechanism of the land plume, based on the analysis of Simpson and
Raman (2004), is sketched in Fig. 16a, and its effect on the potential temperature pro-files near the surface is shown in Fig. 16b. Over land, the strong heating at the surface causes a superadiabatic (unstable) temperature profile immediately above the surface, and a well-mixed boundary layer, with a constant potential temperature, which then
5
increases again in the stable layer above the PBL. In the MBL close to the coast, the temperature profile is stable, transitioning to a well-mixed MBL capped by an inversion a few hundred km away from the coast. An observation of a potential temperature pro-file closely matching these idealized characteristics is shown in Fig. 17a, along with the collocated ozone profile (Fig. 17b), depicting the elevated pollution levels in the land
10
plume. The elevated pollution layers vary in their form and degree of pollution, with a further example of an extreme case of a land plume with O3mixing ratios approaching 100 nmol/mol shown in Fig. 18c (note that units of ppbv are used in this and several other figures in the published literature, which is equivalent to the SI unit nmol/mol). In this case, the land plume is connected to relatively rapid outflow (Fig. 18a), and to a
15
shift in the wind direction to more easterly origins above the boundary layer (Fig. 18b), characteristic for the wind direction profiles in this region. Numerous gases as well as aerosol properties such as absorption and scattering were observed to be present at enhanced mixing ratios in the elevated layers, as depicted in the examples in Fig. 19. Elevated layers such as these are frequently – though not always – present in
obser-20
vations made in the region during INDOEX and other measurements campaigns. Due to the horizontal scale on which the land-sea breeze occurs, which offthe Indian west coast was found to be between 80 and 130 km (Subrahamanyam et al., 2001), it is generally difficult to capture these effects with global models, as has been noted by de Laat et al. (2001a) and Lelieveld et al. (2001). Additional mechanisms may also
con-25
ACPD
10, 9463–9646, 2010Review: southern Asian pollution
outflow
M. G. Lawrence and J. Lelieveld
Title Page
Abstract Introduction
Conclusions References
Tables Figures
◭ ◮
◭ ◮
Back Close
Full Screen / Esc
Printer-friendly Version
Interactive Discussion For this region, Aloysius et al. (2008) have hypothesized that the convergence of winds
from central and northern India at higher altitudes (around 500–600 hPa), together with subsidence associated with negative vorticity in the region, could potentially contribute to elevated pollution layer over the Bay of Bengal. Their data show a correlation of AOD with aerosol flux convergence and flux vorticity, supporting a role for this mechanism.
5
Despite the potential contributions to the elevated layers from various mechanisms, recent strong support for the primary role of the land-sea breeze in producing these elevated layers has been provided by simulations with a mesoscale model (Simpson and Raman, 2006) and with a global model which includes a zoom feature allowing the resolution to be increased to better than 0.5◦ in the horizontal over the zoom
re-10
gion (Verma et al., 2006); the high zoom resolution of the global model allows it to reproduce the land-sea breeze circulation, whereas it is not represented in they lower resolutions typically used in global models. Several features emerge from these two studies taken together. First, the extensive and strong nature of the land-sea breeze in this region is shown, with infrared satellite images showing it to extend up to 200 km
15
offshore (Simpson and Raman, 2006; note that this is rare, since typically land-sea breeze circulations are limited to within about 100 km of the coast). Simpson and Ra-man (2006) also found that this extreme horizontal extent was occasionally evident in the trajectories of the constant-level balloons (Appu et al., 2001; Eth ´e et al., 2002) shown earlier in Fig. 8. The convergence of the sea breeze with the NE monsoon
20
winds results in strong upwelling in the boundary layer. Verma et al. (2006) computed that both the mean horizontal velocity of the sea breeze (3.4 m/s) and the ascent rate are about twice as large in March as in February 1999. For March, the mean ascent rate computed with the global model is about 0.25 Pa/s, which is equivalent to about 12 h for transport from the surface to 1 km (about 100 hPa pressure difference);
inter-25
ACPD
10, 9463–9646, 2010Review: southern Asian pollution
outflow
M. G. Lawrence and J. Lelieveld
Title Page
Abstract Introduction
Conclusions References
Tables Figures
◭ ◮
◭ ◮
Back Close
Full Screen / Esc
Printer-friendly Version
Interactive Discussion the elevated layer each day, resulting in the elevated pollutant mixing ratios such as
those shown in Figs. 17 and 18.
Though secondary to the elevated layer in terms of polluted airmasses, there is also a substantial outflow from the continent directly in the MBL. This can especially be an-ticipated, since the aerosols and shorter-lived trace gas pollutants over land are often
5
most concentrated near the surface. Long-term measurements of aerosol profiles from 1989–1997 over Trivandrum in southern India show that on average during wintertime, the aerosol number density is roughly constant over a mixing height of about 400 m, falling offabove this with a scale height of 500–1000 m (Parameswaran, 2001). An in-teresting feature of the pollutant outflow in the MBL was the appearance of very strong
10
horizontal gradients in pollution levels, noted by Simpson and Raman (2005) based on aerosol measurements from the RV Sagar Kanya (Jayaraman et al., 2001) and CO measurements from RV Ron Brown (Stehr et al., 2002). Simpson and Raman (2005) propose that this is caused by the transition from sea breeze to land breeze in the evening, as depicted in Fig. 20. During the daytime, the sea breeze effectively lofts
15
pollutants into the elevated layer, and prevents a significant outflow directly in the MBL. In the evening, the transition to the land breeze allows a “pollution front” to be trans-ported out over the ocean, and then carried further by the NE monsoon winds. In regions where the wind is relatively steady between the coast and the observations point, this results in diurnal cycles in the pollution (where the phase depends on the
20
distance from the coast). These pollution fronts can also be observed as “stripes” of sharp gradients in infrared satellite images (D ´esalmand et al., 2003), where high aerosol concentrations block the IR radiation from the sea surface and lower the re-trieved temperatures. The first evidence of this diurnal behavior was already gathered during the pre-INDOEX FFP campaign in 1998, when rapid increases of an order of
25
ACPD
10, 9463–9646, 2010Review: southern Asian pollution
outflow
M. G. Lawrence and J. Lelieveld
Title Page
Abstract Introduction
Conclusions References
Tables Figures
◭ ◮
◭ ◮
Back Close
Full Screen / Esc
Printer-friendly Version
Interactive Discussion the basic features are also present in the zoom region of a global model (Verma et al.,
2006), confirming this as an important mechanism in controlling the pollutant outflow in the regional MBL.
The split layers in the SAW-ABC will have important implications for the large scale effects, for instance due to differences in the impact of warming by absorbing aerosols
5
located near the surface (which would tend to substantially increase atmospheric in-stability) compared to warming in the residual layer (which can strengthen the MBL inversion cap). Since the radiative forcing of aerosols depends on the reflectivity of the underlying surface, the presence of clouds below the inversion can have a strong impact on aerosols transported aloft (Haywood et al., 1997). Satellite measurements
10
show that when aerosol layers that are advected over a partly cloudy MBL, i.e. at a cloud coverage >0.4, the aerosol radiative forcing can even switch from a net
cool-ing to a net warmcool-ing effect (Chand et al., 2009). Furthermore, the split layers make long-term monitoring of the pollutant outflow more complicated, since island stations with only ground-based instruments may not be observing the most important part of
15
the outflow, thus arguing for the need for regular balloon soundings and lidar measure-ments where possible – and perhaps in the future the implementation of routine AUAV (unmanned airborne vehicle) measurements at some of the remote ABC monitoring sites such as MCOH.
Finally, in addition to the surface layer and the elevated pollution outflow layer
dis-20
cussed above, there is also evidence of several other layers higher up, which vary strongly from day to day, including:
– a layer at about 3–4 km altitude which carries pollution primarily from Southeast Asia, especially from biomass burning (Lelieveld et al., 2001; Chatfield et al., 2007),
25
ACPD
10, 9463–9646, 2010Review: southern Asian pollution
outflow
M. G. Lawrence and J. Lelieveld
Title Page
Abstract Introduction
Conclusions References
Tables Figures
◭ ◮
◭ ◮
Back Close
Full Screen / Esc
Printer-friendly Version
Interactive Discussion African (de Laat, 2002), although a recent, more detailed analysis (Chatfield et al.,
2007) has shown that primary contributions come from stratospheric input of O3 and from convective lofting of pollutants out of the polluted MBL of the northern Indian Ocean;
– upper tropospheric pollution from southern Asia in the return flow of the Hadley
5
Cell, after the polluted airmasses are lofted by convection in the ITCZ (de Laat et al., 2001b; Phadnis et al., 2002).
This “crossroads” of pollution above the Indian Ocean is reminiscent of the situation over the Mediterranean Sea (see Sect. 5), and has some important consequences for the analysis of the SAW-ABC, such as the differences in the anthropogenic
contribu-10
tion to the column-integrated AOD versus the surface layer aerosol concentrations, as discussed in Sect. 4.4.
4.2.2 Transit times, lofting in the ITCZ and interhemispheric exchange
After leaving the continent, pollutants in the SAW-ABC are transported over the ocean until they reach the ITCZ. The typical transit time from the southern coast of India to
15
the ITCZ has been estimated to be about a week to ten days, based on constant-level balloons and trajectory calculations (Eth ´e et al., 2002) and on the ratios of the concentrations of pollutants with different chemical lifetimes (de Gouw et al., 2001). This transport time, combined with the effects of chemical processing, dilution, and surface deposition, results in substantial north-south gradients of various gases and
20
aerosols, such as the example for AOD shown in Fig. 21. These strong gradients, including the sharp gradient across the ITCZ, were first noted in measurements made on the pre-INDOEX and INDOEX ship cruises (e.g., Rhoads et al., 1997; Moorthy et al., 1997; Jayaraman et al., 1998, 1999, 2001; Satheesh et al., 1998; Naja et al., 1999; Stehr et al., 2002; Quinn et al., 2002; Chand et al., 2001, 2003; Kamra et
25