www.atmos-chem-phys.net/15/9611/2015/ doi:10.5194/acp-15-9611-2015
© Author(s) 2015. CC Attribution 3.0 License.
Continental pollution in the western Mediterranean basin: vertical
profiles of aerosol and trace gases measured over the sea during
TRAQA 2012 and SAFMED 2013
C. Di Biagio1, L. Doppler2,3,4, C. Gaimoz1, N. Grand1, G. Ancellet2, J.-C. Raut2, M. Beekmann1, A. Borbon1, K. Sartelet5, J.-L. Attié6,7, F. Ravetta2, and P. Formenti1
1LISA, UMR CNRS 7583, Université Paris Est Créteil et Université Paris Diderot, Institut Pierre Simon Laplace,
Créteil, France
2Sorbonne Universités, UPMC Univ. Paris 06, Université Versailles St-Quentin, CNRS/INSU, LATMOS-IPSL, Paris, France 3Freie Universität Berlin, Berlin, Germany
4Deutscher Wetterdienst, Meteorological Observatory Lindenberg, Lindenberg, Germany
5CEREA, Joint Laboratory École des Ponts ParisTech – EDF R & D, Université Paris-Est, 77455 Marne la Vallée, France 6Laboratoire d’Aérologie, University of Toulouse, UMR 5560 CNRS, Toulouse, France
7CNRM GAME, UMR 3589 CNRS, Meteo-France, Toulouse, France Correspondence to:C. Di Biagio ([email protected])
Received: 1 March 2015 – Published in Atmos. Chem. Phys. Discuss.: 18 March 2015 Revised: 17 July 2015 – Accepted: 21 July 2015 – Published: 27 August 2015
Abstract. In this study we present airborne observations of aerosol and trace gases obtained over the sea in the west-ern Mediterranean basin during the TRAQA (TRansport and Air QuAlity) and SAFMED (Secondary Aerosol Forma-tion in the MEDiterranean) campaigns in summer 2012 and 2013. A total of 23 vertical profiles were measured up to 5000 m above sea level over an extended area (40–45◦N and
2◦W–12◦E) including the Gulf of Genoa, southern France,
the Gulf of Lion, and the Spanish coast. During TRAQA and SAFMED the study area experienced a wide range of meteorological conditions which favoured pollution export from different sources located around the basin. Also, sev-eral events of dust outflows were measured during the cam-paigns. Observations from the present study show that con-tinental pollution largely affects the western Mediterranean both close to coastal regions and in the open sea as far as
∼250 km from the coastline. The measured aerosol
scatter-ing coefficient varies between ∼20 and 120 Mm−1, while
carbon monoxide (CO) and ozone (O3)mixing ratios are in the range of 60–165 and 30–85 ppbv, respectively. Pollution reaches 3000–4000 m in altitude and presents a very com-plex and highly stratified structure characterized by fresh and aged layers both in the boundary layer and in the free tropo-sphere. Within pollution plumes the measured particle
con-centration in the Aitken (0.004–0.1 µm) and accumulation (0.1–1.0 µm) modes is between∼30 and 5000–6000 scm−3
(standard cm−3), which is comparable to the aerosol
concen-tration measured in continental areas under pollution condi-tions. Additionally, our measurements indicate the presence of highly concentrated Aitken layers (10 000–15 000 scm−3)
observed both close to the surface and in the free troposphere, possibly linked to the influence of new particle formation (NPF) episodes over the basin.
1 Introduction
Atmospheric aerosols play an important role on climate through their participation in several chemical, dynamical, and radiative processes. At present, large uncertainties still persist in the estimation of the aerosol direct and indirect ef-fects mainly due to the difficulty of fully characterising their spatial and vertical distribution and properties (Boucher et al., 2013).
High levels of anthropogenic aerosol particles and pollutants are measured in the Mediterranean (Lelieveld et al., 2002), which is also indicated as one of the main hot spots for air quality issues (Monks et al., 2009).
The north-western part of the Mediterranean basin, due to its proximity to highly polluted industrialised areas (such as the Po Valley in northern Italy and the Fos/Berre in south-ern France) and large coastal cities (Barcelona, Genoa, Mar-seilles, Nice, and Valencia), is frequently affected by conti-nental outflows and severe pollution episodes (Mallet et al., 2005; Pérez et al., 2008; Pey et al., 2010). The strength of these episodes is particularly intense during summer when stable meteorological conditions and the high level of inso-lation promote photochemical reactions and the build-up of ozone and other pollutants (e.g. Millán et al., 2000).
A number of studies have investigated the dynamics of pollution export over the western basin with the aim of char-acterising the impact of anthropogenic emissions over this region. Most of these studies have been conducted in con-tinental coastal areas and provide information on the verti-cal distribution of aerosols and their properties mainly close to local pollution sources. They include ground-based obser-vations with lidars (Soriano et al., 2001; Pérez et al., 2004; Ancellet and Ravetta, 2005), and airborne campaigns, such as MECAPIP (MEso-meteorological Cycles of Air Pollution in the Iberian Peninsula) and RACAPMA (RegionAl Cycles of Air Pollution in the west central Mediterranean Area) in coastal Spain (Millán et al., 1996, 1997), and ESCOMPTE (Experience sur Site pour Contraindre les Modeles de Pollu-tion atmospherique et de Transport d’Emissions) in southern France (Drobinski et al., 2007). The results of these studies have highlighted the important role of pollution in modulat-ing the atmospheric composition in this part of the basin and the high variability of the aerosol distribution and properties in relation to different export conditions (Flamant and Pelon, 1996; Soriano et al., 2001; Mallet et al., 2005). In particu-lar, the interaction between synoptic circulation and local dy-namics, such as orography and sea breezes, has been shown to strongly impact the vertical distribution, layering, and ag-ing of particles along coastal regions (e.g. Millan et al., 1997; Gangoiti et al., 2001; Pérez et al., 2004; Velchev et al., 2011). The capability of reproducing this complexity by air qual-ity models represents a real challenge (Jimenez et al., 2006; Jiménez-Guerrero et al., 2008), and experimental observa-tions gives a fundamental support to test the performances of the model outputs over the western Mediterranean environ-ment.
The large set of observations conducted in the last few decades in the western Mediterranean has permitted mostly to characterise the dynamics and processes of pollution ex-port in the surroundings of the basin. However, at the present time we lack an extensive representation of the mean load, distribution, and physico-chemical and optical properties of the atmospheric aerosols, and the trace gases distribution, in the whole region, in particular over the remote sea. In
addi-tion, there is a significant lack of observations over some key areas, as for example the Gulf of Genoa, directly under the influence of the outflow from the highly polluted Po Valley (Velchev et al., 2011).
In this study we present vertical profile measurements of aerosols and trace gases acquired during 24 scien-tific flights performed with the ATR-42 French research aircraft during the TRAQA (TRansport and Air QuAl-ity) and SAFMED (Secondary Aerosol Formation in the MEDiterranean) campaigns in summer 2012 and 2013 in the framework of the Chemistry-Aerosol Mediterranean Experiment (CHARMEX, https://charmex.lsce.ipsl.fr/). The TRAQA and SAFMED flights explored an extended region of the western Mediterranean basin between 40–45◦N and
2◦W–12◦E including the Gulf of Genoa, southern France,
the Gulf of Lion, and the Spanish coast. Measurements were performed over the sea at various distances from the coast-line with lidar and in situ instruments. During TRAQA and SAFMED the western basin was under diverse synoptic con-ditions which led to the occurrence of different pollution ex-port regimes (mistral/tramontane events, outflow from the Po Valley and the Iberian Peninsula) and allowed for the sam-pling of atmospheric aerosols of different origins and types.
The main objective of the present work is to provide ob-servations of the vertical distribution of aerosols and trace gases related to the export of anthropogenic pollution at the regional scale of the western Mediterranean basin. The de-tailed knowledge of the vertical structure of the atmosphere is very important to understand the impact of continental pol-lution over the basin.
The paper is organised as follows: in Sects. 2, 3, and 4 we describe the flight trajectories and strategy during TRAQA and SAFMED, the in situ measurements carried out on board the ATR-42 aircraft, and the meteorological conditions ob-served during the campaigns. In Sect. 5 we present the re-sults. The aerosol and trace gases vertical profiles are shown in Sect. 5.1 and 5.2. Section 5.3 is dedicated to analyse the variability of the pollution plume composition and at-mospheric structure also in relation to the different outflow conditions. Airborne measurements in the presence of lay-ers with high concentrations of fine particles are discussed in Sect. 5.4. The main conclusions are reported in Sect. 6.
2 Overview of flights
TRAQA 2012
SAFMED 2013
Italy France
Spain
V31
V24 V16
V19 V26
V21-23b V28b
V20 V25
V32 V30
V52
V22a V23a V22b
V49
Italy France
Spain
Longitude (deg)
V27a-27b
V28a
X Vertical profiles
V46-48 V51
Ersa Barcelona
Frioul
AERONET stations
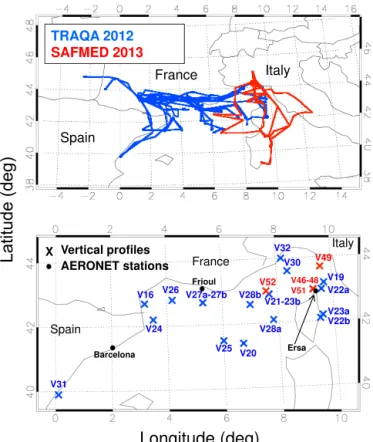
Figure 1.Upper panel: flight trajectories of the TRAQA (20 June–
13 July 2012) and the SAFMED (24 July–1 August 2013) cam-paigns. The aircraft was based in Toulouse, France (43◦36′N, 1◦26′E), during TRAQA and in Genoa, Italy (44◦24′N, 8◦55′E), during SAFMED. Lower panel: detail on the investigated area and geographical position of the different vertical soundings analysed in this paper. The position of the three AERONET stations of Barcelona, Frioul, and Ersa considered in this study is also shown.
Toulouse (43◦36′N, 1◦26′E, France) during TRAQA and in
Genoa (44◦24′N, 8◦55′E, Italy) during SAFMED.
Twenty-four flights which recorded a total of ∼75 h of data were
flown. Seventeen of the 24 flights presented in the paper were performed during TRAQA (flight numbers V16 to V32) and 7 during SAFMED (V46 to V52). All flights were carried out during daytime, when light-induced chemistry favours the pollution levels. Most often two flights per day, with interme-diate stops in different airports in southern France, Corsica, and Sardinia, were performed. The majority of flights were over the sea, with some exceptions investigating inland areas in southern France and central Italy. Information concerning the TRAQA and SAFMED flights is summarised in Table 1. The general flight strategy consisted of plane flights with lidar observations and vertical ascents/descents to sound the vertical atmospheric column (from ∼60–100 m to 3000–
5000 m a.s.l.) and identify main meteorological and aerosol features, followed by straight levelled runs (SLRs) within the detected aerosol layers. In this study we focus on vertical profile data. A total of 23 profiles were acquired in 20–30 min
each by performing a spiral trajectory∼10–20 km wide.
Fig-ure 1 also identifies the geographical position of each sound-ing. As shown in Fig. 1 the profiles were performed at dif-ferent distances from the coastline, from a minimum of∼5–
10 km for V31 and V32 to more than∼250 km for V20 and
V25, and covered almost all the different sectors of the west-ern basin.
3 Measurements and methods
The basic equipment of the ATR-42 aircraft includes sensors for the measurements of meteorological parameters (pres-sure, temperature, relative humidity, wind components), ra-diative fluxes (down- and up-welling shortwave and long-wave radiation), and carbon monoxide (CO) and ozone (O3) mixing ratios.
Aerosol sampling was performed using the AVIRAD sys-tem (Formenti et al., 2011). AVIRAD is an iso-axial and iso-kinetic inlet which, at the normal cruise speed of the ATR-42 (∼93 m s−1), samples air at a volumetric flow of ∼350 L min−1. The 50 % passing efficiency of the inlet was
tested to be 12 µm diameter. Various sampling lines depart from AVIRAD to connect to different instruments mounted inside the aircraft cabin: (i) a three-wavelength nephelometer (TSI Inc., model 3563) for the measurement of the dry parti-cle volume total scattering (σs)and hemispherical backscat-tering (σbs)coefficients at 450, 550, and 700 nm; (ii) a seven-wavelength aethalometer (Magee Sci., model AE31) for the measurement of the particle absorption coefficient (σa) at
370, 470, 520, 590, 660, 880, and 950 nm; (iii) an optical particle spectrometer (GRIMM Inc., model 1.129) for the measurement of the particle number concentration over 32 size classes between 0.3 and 32 µm in diameter; (iv) a con-densation particle counter (CPC, TSI Inc., model 3775) for the measurement of the total particle number concentration in the diameter range of 0.004–3.0 µm; and (v) three lines for aerosol sampling on filter membranes and a four-stage cascade impactor (Dekati Inc) to measure the bulk and size-segregated particle composition. In addition, the ATR-42 was equipped with a passive cavity aerosol spectrometer probe (PCASP, model 100X) optical particle spectrometer for the measurement of the aerosol number concentration over 31 size classes between 0.1 and 3.0 µm. The PCASP was in-stalled outside the cabin on the left side of the aircraft fuse-lage.
In this study we consider measurements of the (i) aerosol scattering coefficient from the nephelometer, (ii) parti-cle concentration from the CPC and PCASP instruments (GRIMM data are not considered since they are available only below∼350 m during TRAQA), (iii) CO and O3trace
Table 1.Summary of information on the TRAQA and SAFMED flights.
Measurement Flight Date Take off-landing Departure– Geographic area Description campaign number time (UTC) arrival investigated
TRAQA 2012 V16 20/06/2012 13:12–16:34 Toulouse–Toulouse Gulf of Lion Test flight
V17∗ 22/06/2012 09:01–12:54 Toulouse–Toulouse South-western France (over land) and the Atlantic Ocean
Test flight, biogenic emissions.
V18∗ 26/06/2012 07:13–09:18 Toulouse–Bastia Gulf of Genoa Export of pollution from northern Italy/Po Valley, north-westerly winds
V19 26/06/2012 10:42–13:46 Bastia–Toulouse Gulf of Genoa Export of pollution from northern Italy/Po Valley, north-westerly winds
V20 27/06/2012 04:07–08:00 Toulouse–Nimes Sea area south of Mar-seille/Toulon
Export of pollution during a mistral/tramontane event
V21 27/06/2012 09:39–13:16 Nimes–Toulouse Western coast of Corsica Export of pollution from northern Italy/Po Valley, north-westerly winds
V22 29/06/2012 05:13–08:50 Toulouse–Bastia Eastern coast of Corsica Dust outbreak
V23 29/06/2012 10:13–14:12 Bastia–Toulouse Eastern and western coasts of Corsica
Dust outbreak
V24 03/07/2012 13:19–17:12 Toulouse–Toulouse Sea area north-east of Barcelona
Export of pollution from Barcelona, westerly/south-westerly winds
V25 04/07/2012 07:18–10:54 Toulouse–Toulouse Sea area south of Mar-seille/Toulon
Following Barcelona pollution plumes
V26 04/07/2012 15:25–18:36 Toulouse–Toulouse Gulf of Lion Following Barcelona pollution plumes
V27 06/07/2012 08:00–11.55 Toulouse–Toulouse Sea area south of Marseille Export of pollution during a moderate mis-tral/tramontane event
V28 06/07/2012 14:01–17:45 Toulouse–Toulouse Sea area south of Nice/Toulon Export of pollution during a moderate mis-tral/tramontane event
V29∗ 07/07/2012 08:19–10:59 Toulouse–Nimes Southern France (over land) Biogenic emissions
V30 07/07/2012 13:03–17:10 Nimes–Toulouse Gulf of Genoa Export of pollution during a moderate mis-tral/tramontane event
V31 10/07/2012 13:41–17:21 Toulouse–Toulouse Eastern coast of Spain Characterisation of pollution near coastal sources
V32 11/07/2012 11:23–14:48 Toulouse–Toulouse South-eastern coast of France and Gulf of Genoa
Characterisation of pollution near coastal sources
SAFMED 2013 V46 24/07/2013 10:34–13:06 Genoa–Cagliari Gulf of Genoa and eastern coast of Corsica and Sardinia
Characterisation of pollution plumes in the Gulf of Genoa, Corsica, and Sardinia; westerly/south-westerly winds
V47∗ 24/07/2013 14:21–16:29 Cagliari–Genoa Eastern coast of Corsica and Sardinia and Gulf of Genoa
Characterisation of pollution plumes in the Gulf of Genoa, Corsica, and Sardinia; westerly/south-westerly winds
V48 25/07/2013 13:12–16:02 Genoa–Ersa Gulf of Genoa Characterisation of pollution in the Gulf of Genoa; westerly/south-westerly winds
V49 27/07/2013 11:08–13:07 Genoa–Alghero Central Italy (over land) Characterisation of pollution in central Italy
V50∗ 27/07/2013 15:33–16:48 Alghero–Genoa Eastern coast of Corsica and Gulf of Genoa
Characterisation of pollution plumes in the Gulf of Genoa, Corsica, and Sardinia; westerly/south-westerly winds and dust outbreak
V51 30/07/2013 13:05–15:50 Genoa–Ersa Gulf of Genoa Characterisation of pollution in the Gulf of Genoa; very low north/north-westerly winds
V52 01/08/2013 12:03–15:24 Genoa–Alghero Western coast of Corsica Characterisation of pollution in western Corsica; export of pollution from northern Italy/Po Valley; north-easterly winds
∗No vertical profiles performed during these flights.
measurements and their data analysis is provided in the fol-lowing sections.
The present analysis is based only on measurements ob-tained in cloud free conditions.
3.1 Aerosol scattering coefficient
A three-wavelength integrating nephelometer has been used to measure the dry particle volume total scattering (σs) co-efficient at 450, 550, and 700 nm. The sampling flow rate was 30 L min−1. Data were acquired at 6 s resolution during
was calibrated prior to each campaign with free-particle air and CO2as gases of low and high known scattering
coeffi-cient. Nephelometer measurements have been corrected for angular truncation and Lambertian non-idealities by apply-ing the formulae by Anderson and Ogren (1998). The mea-surement uncertainty ofσs is calculated taking into account
for the photon counting, gas calibration, and angular cor-rections uncertainties (Anderson et al., 1996; Anderson and Ogren, 1998). The total uncertainty ofσs is estimated to be
lower than 10 % at the three wavelengths.
The nephelometer measured the scattering coefficient in dry air conditions. This is due to the heating of the airflow while entering the aircraft cabin and the temperature in the cavity of the instrument. The relative humidity measured dur-ing the flights inside the nephelometer was<25 % in more than 90 % of cases, with values up to ∼40 % occasionally
observed at very low altitudes (<200 m) over the sea sur-face. A possible underestimation of the scattering coefficient may thus occur in case of hygroscopic aerosols, especially under high relative humidity conditions in the atmosphere.
The particle scattering Ångström exponent (αs)has been calculated from spectral nephelometer measurements with a power-law fit of the measured scattering coefficients versus wavelength.
3.2 Aerosol particle number concentration
The vertical profiles of the total particle number concentra-tion in the Aitken (dNAitken, 0.004–0.1 µm), accumulation
(dNAcc, 0.1–1.0 µm) and coarse (dNCoarse,>1.0 µm) modes have been obtained by combining CPC and PCASP data. The CPC and the PCASP measured at a sample flow of 1.5 and 0.06 L min−1, respectively, and with a time resolution of 1 s
for the PCASP and 5 and 1 s for the CPC during TRAQA and SAFMED, respectively.
The PCASP was factory calibrated with monodisperse polystyrene sphere latex (PSL) whose complex refractive in-dex at the instrument operating wavelengths (632.8 nm) is 1.59–0i. The measured sphere-equivalent optical diameter has been converted to a sphere-equivalent geometrical diam-eter (Dg)by taking into account the complex refractive index of the sampled aerosol (Liu and Daum, 2000). Given that in the very large majority of cases the aerosol sampling dur-ing TRAQA and SAFMED was associated with the export of pollution plumes, only pollution aerosols have been consid-ered for PCASP correction. Note that these data are not opti-mized for dust or marine aerosol observations. A large inter-val of inter-values (n∼1.50–1.72,k∼0.001–0.1 for UV–visible
wavelengths) are reported in the literature for the real and the imaginary parts of the refractive index for anthropogenic aerosols over Europe (e.g. Ebert et al., 2002, 2004; Müller et al., 2002; Mallet et al., 2003, 2011; Chazette et al., 2005; Raut and Chazette, 2008). For our calculations at 632.8 nm we fixed the imaginary part of the refractive index to 0.01, thus representing a mean absorbing aerosol, and then we
var-ied the real part between its minimum (1.50) and maximum (1.72) reported value.Dgis then set at the mean±one
stan-dard deviation of the values obtained for the different val-ues ofn. We assume in these calculations that the refractive index does not vary with height. After refractive index cor-rection theDgrange for the PCASP becomes 0.10–4.47 µm,
with an uncertainty between 1 and 25 %. The smallest and the largest size bins of the PCASP, for which the minimum and maximum edges respectively are not defined, have been excluded from the data sets, thus reducing the PCASPDg
range to 0.11–4.17 µm.
Once corrected for the refractive index, PCASP data have been combined with those from the CPC to calcu-late dNAitken, dNAcc, and dNCoarse. Values for dNAcc and
dNCoarse are obtained by integrating the PCASP number
concentrations in the 0.1–1.0 µm and 1.0–4.17 µm ranges, while dNAitken is estimated as the difference between CPC
concentration and the integral of PCASP data between 0.1 and 3.0 µm. The comparison between the PCASP and the GRIMM below 350 m altitude indicates that the former un-derestimates the aerosol concentration in the range of 0.4– 1.0 µm by about 50 % (the accuracy of the GRIMM has been verified by optical closure study against simultaneous aircraft nephelometer measurements). This is estimated to induce a
∼20 % underestimation of the dNAcc calculated here.
Con-versely, the PCASP underestimation in the 0.4–1.0 µm range has almost a negligible impact on dNAitken.
CPC measurements, and so dNAitkendata, were not
avail-able during SAFMED flights V49, V50, and part of V51.
3.3 Trace gases
Carbon monoxide (CO) and ozone (O3)mixing ratios were measured by the MOZART instrument described in detail by Nedelec et al. (2003). CO is a long-lived tracer for air masses influenced by combustion processes, whereas O3in the
tro-posphere is a photochemical product of the oxidation of CO and volatile organic compounds (VOCs) in the presence of nitrogen oxides (NOx). CO and O3are measured at a
reso-lution of 30 and 4 s, respectively. The nominal uncertainty is ±5 % for CO and ±2 % for O3 (Nedélec et al., 2003).
However, a recent airborne intercomparison in May 2014 in the framework of the French ChemCalInt project and the TGOE (Traceability in Gas-phase Observations in EUFAR) European Joint Research Activity has suggested a greater un-certainty (up to 30 %) of CO measurements by MOZART on-board the ATR-42 (A. Borbon, personal communication, 2015). Trace gas analysis will focus mostly on the vertical distribution of the1O3/1CO ratio rather than absolute
3.4 STP conversion
In order to compare measurements obtained at different alti-tudes the data presented here are reported at standard tem-perature and pressure (STP) using T =293.15 K and p=
1013.25 hPa (NIST, National Institute of Standards and Tech-nology, values). Hence, the scattering coefficient is scaled to STP conditions and the particle concentrations are given as particles per standard cm−3 (scm−3). For a generic
param-eter x measured at the temperature T and pressure p, the conversion at STP is calculated with the formula
x (STP)=x (T , p) T 293.15
1013.25
p . (1)
CO and O3do not need to be corrected for STP since the
mixing ratio does not depend on temperature and pressure. 3.5 Meteorological parameters
The vertical profiles of the pressure (p), the temperature (T), the relative humidity (RH) and the wind components to-wards the east and the north (U, V) measured on board the ATR-42 have been used to analyse the atmospheric struc-ture during flights. Starting from the measured parameters the potential temperature (θ ) has been also calculated as θ=T (p0/p)0.286 withp0=1013.2 mbar. For each profile
the height of the marine aerosol boundary layer (MABL) and planetary boundary layer (BL) has been estimated visually by looking at the vertical gradients ofT,θ, and RH. Mete-orological parameters have been also used to calculate the vertical profiles of the gradient Richardson number (Ri):
Ri=g
θ ∂θ ∂z
,
∂U
∂z
2
+
∂V
∂z
2!
. (2)
In Eq. (2), gis the gravitational acceleration andzis the height. The Ri number is the ratio between the buoyancy force and the wind shear and it is used to indicate dynamic stability and the formation of clear air turbulence. Turbu-lence can develop when Ri is below the critical threshold Ricrit=0.25, while it is inhibited for Ri >1 (e.g. Wallace and Hobbs, 2006). In this study the profiles of Riare used to provide indications of favourable/unfavourable conditions for the development of turbulence within the atmosphere. 3.6 Tracking the air mass back-trajectories
The Lagrangian trajectory model FLEXTRA (FLEXible TRAjectories, Stohl et al., 1995) has been used in se-lected cases to track the origin of sampled air masses. Five-day three-dimensional back-trajectories have been calculated using the ECMWF (European Centre for Medium-Range Weather Forecasts) operational analysis with a 0.5◦by 0.5◦
horizontal resolution and up to 30 vertical model levels below 4000 m. The model specific humidity and potential vorticity is also interpolated along the trajectory path.
4 Meteorological conditions, aerosol load, and pollution export regimes
In order to characterise the general aerosol conditions en-countered over the western Mediterranean basin during the TRAQA and the SAFMED campaigns, we have plotted the time series of the aerosol optical depth (τ,±0.02) at 440 nm
and the 440–870 nm Ångström exponent (α)measured with a Cimel sunphotometer (Holben et al., 1998) at the three AERONET stations of Barcelona, Frioul, and Ersa, located along the coast around the western basin (see Fig. 1). Level 1.5 cloud-screened data are used in this study. Data are shown in Fig. 2 and correspond to the period of the cam-paign of measurements plus 10 days before and after. Table 1 reports the date, location, and main meteorological and ex-port conditions encountered during TRAQA and SAFMED flights.
Over the analysed AERONET sites the aerosol optical depth was below 0.2 before the beginning of the TRAQA campaign and increased, especially at Barcelona and Ersa, to
∼0.3–0.5 (with 1< α <2) in the periods 23–26 June and 3– 13 July 2012. Isolated peaks ofτwere measured correspond-ing to two Saharan dust intrusion events which occurred on 17–23 June (τ∼0.6) and 29 June 2012 (τ∼1.4).
Sa-Figure 2.Aerosol optical depth at 440 nm (τ )and Ångström exponent (α)measured at the Barcelona, Frioul, and Ersa AERONET stations
during the TRAQA 2012 (left panels) and the SAFMED 2013 (right panels) campaigns. The time period for the different plots is±10 days
around the beginning/end of the two campaigns (data for the Barcelona station are not available over the entire 2012 period). The label D indicates the days affected by Saharan dust.
haran dust aerosols were sampled during flights V16 and V20 (episode of 17–23 June) and flights V22 and V23 (episode of 29 June).
During SAFMED the meteorological conditions were more stable and two distinct phases were observed: (i) a sta-ble anticyclone affected the whole western Mediterranean area in the first half up until the 26th of July, thus possibly favouring a more pronounced accumulation of photochem-ical pollution in this part of the basin. Relatively high val-ues of bothτ (∼0.2–0.8) andα(∼1–2.5) were measured at
the three sites of Barcelona, Frioul, and Ersa in this period; (ii) a cyclonic system moving from the Atlantic region to-wards Europe then affected the western basin on 28–29 July 2013. Very clean conditions (τ <0.1–0.2) were measured af-terwards over the entire region until the end of the SAFMED campaign. Winds were mostly westerly/south-westerly in the first period of the campaign (24–29 July 2013, flights V46, V47, V48, V49, V50), which means that the sampled air flow came mostly from the sea. Then, from 30 July to 1 Au-gust 2013 a north-easterly flow affected the SAFMED in-vestigated area, thus promoting the export of pollution from northern Italy towards the Gulf of Genoa (flights V51, V52). A strong mistral event (29 July–1 August) and two Saharan dust outbreaks (27–28 July and 1 August) affected the west-ern basin though not the vertical profile observations during SAFMED.
In order to identify the distribution of observations during TRAQA and SAFMED as a function of the aerosol type, in
Fig. 4 we plotted the distribution of the measured scattering coefficientσs at 450, 550, and 700 nm as a function of the
calculated scattering Ångström exponentαs for all vertical
profiles. The plot shows similar scattering intensity between cases dominated by coarse particles (αs<0.5–1.0), such as desert dust, and those dominated by fine particles (αs>1.0– 1.5), such as pollution aerosols. For both dust and pollution, σs peaks at about 100–120 Mm−1. The frequency of
occur-rence ofαs shows that pollution plumes represent the large
majority of the cases observed, with more than 70 % of mea-surements withαs>1.0.
5 Results
Figure 5 shows the box and whisker plots of the aerosol scat-tering coefficientσsat 450, 550, and 700 nm, particle
num-ber concentration in the Aitken (dNAitken)and accumulation (dNAcc)diameter ranges, and CO and O3 measured in the
boundary layer (BL) and in the free troposphere (FT) within pollution plumes for all the different vertical soundings anal-ysed in this study. This plot summaries the range of values observed during TRAQA and SAFMED. On average, the scattering coefficient and CO are larger in the BL compared to the FT, whilst similar ranges of values are measured in the two regions for dNAitken, dNAcc, and O3. Even within the
a)
26 June 2012 12UT, 925 hPa
b)
03 July 2012 12UT, 925 hPa
W
ind speed
(m s
-1
)
W
ind speed
(m s
-1
)
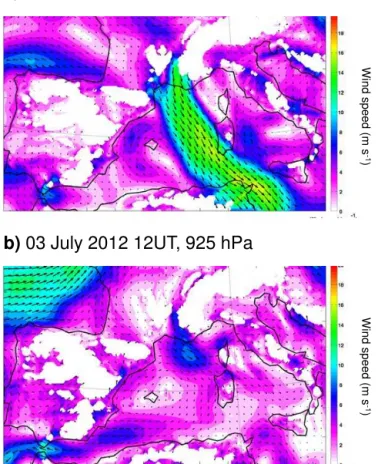
Figure 3. Example of wind maps at 925 mbar for 26 June and
3 July 2012. The maps are obtained from the WRF-Chem model (Weather Research and Forecasting – Chemistry) at 10 km horizon-tal resolution.
5.1 Vertical profiles of aerosol concentration and scattering coefficient
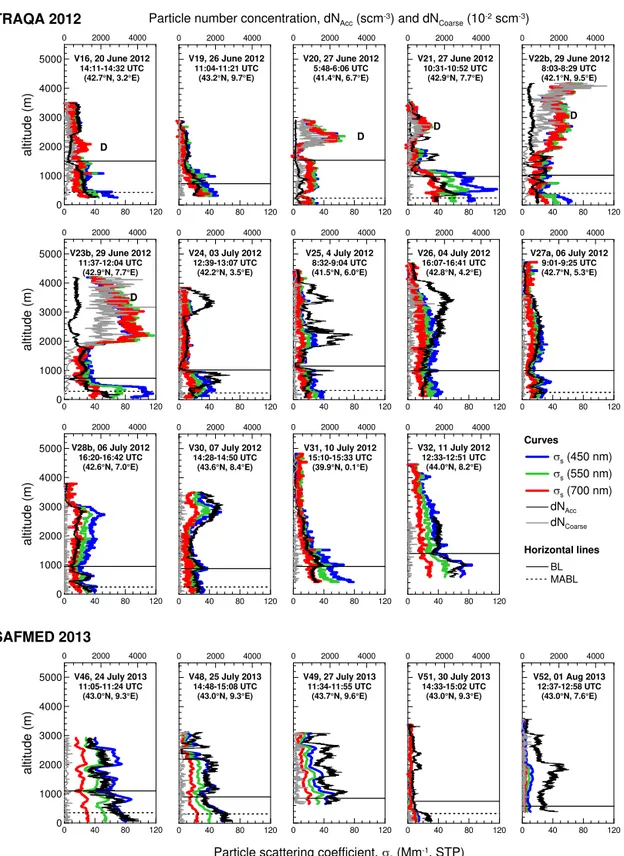
Figure 6 shows the vertical profiles of σs, dNAcc, and
dNCoarse during TRAQA and SAFMED flights. The date,
time and coordinates of each profile, as well as the heights of the top of the marine and planetary boundary layer (MABL and BL) estimated from meteorological data, are also indi-cated in the plot.
For the different vertical soundings the particle concen-trations dNAcc and dNCoarse vary in the range of ∼30–
3200 scm−3and∼0.05–40 scm−3, respectively, for plumes
withσsbetween 10 and 120 Mm−1. The structure in the
scat-tering profile is generally mirrored in dNAccprofile, and this
also reflects the pronounced spectral variability (i.e. decrease for increasing wavelength) of the scattering coefficient, typ-ical of pollution/anthropogenic particles. dNCoarsealso
con-tributes to the scattering signal in some cases especially at high altitudes (see V16, V20, V21, V22, and V23 above
∼2000 m), and this reflects the low spectral variability of
the scattering coefficient. These observations are associated with the dust intrusion episodes which occurred in the
west-ern Mediterranean basin during TRAQA, which will not be analysed in detail here. Aerosol layers affected by dust have been labelled with a “D” in Fig. 6.
Maxima of the scattering coefficient have been measured for TRAQA flights V21 and V23 (∼120 Mm−1for pollution
in the BL and∼100 Mm−1in the dust layer), whereas flights
V46, V48, V49, during the first and more polluted phase of SAFMED, are the richest in dNAcc(1500–3000 scm−3over
the whole column). Minima ofσsand dNAccare obtained for
flight V51 at the beginning of the second SAFMED phase when clean conditions were observed in the western Mediter-ranean.
Pollution plumes observed in the different flights extend from the boundary layer to the free troposphere up to 3000– 4000 m altitude. The vertical structure of the aerosol scatter-ing coefficient/particle concentration is linked to the variabil-ity of the atmospheric thermodynamic structure and is gen-erally characterized by a first layer confined in the MABL (<400 m, profiles V16, V20, V22, V25, V48, V51), fol-lowed by one or more layers within the BL. In the FT pollu-tion particles occur both as single isolated plumes each about 500–1000 m thick (V21, V24, V25, V30, V46, V49), or as a more uniform layer extending from the top of the BL up to 2500–4000 m altitude (V26, V27, V28, V32, V48). The highest values of both the scattering coefficient and dNAcc
for pollution are found within the MABL or BL in most cases, while a local minimum ofσs and dNAcc is generally
identified at the top of the BL. The scattering coefficient and the particle concentration measured in the FT are compara-ble with the values observed in the BL, and in a few cases even larger (V25, V26, V30). Only in one case (profile V31) doσs and dNAcc decrease monotonically with height. The
aerosol vertical distribution, both in the BL and in the FT, often presents a strongly stratified structure characterized by the presence of several thin sub-layers within one main iden-tified aerosol plume, as it can be seen in particular in the dNAccprofiles (V20, V21, V22, V25, V46, V49).
The particle concentration in the Aitken mode (0.004– 0.1 µm; dNAitken, not shown in Fig. 6) is generally below
5000–6000 scm−3 at all altitudes up to 4000 m within
pol-lution plumes. dNAitkenis correlated with dNAcc in most of
the observed cases, which indicates the common source of particles in these two size ranges. A few layers exceeding
∼10 000–15 000 scm−3were observed occasionally both in
the BL and in the FT. These will be discussed in more detail in Sect. 5.4.
The dNAccand dNAitkenmeasurements within the BL and
Figure 4.Left: scattering coefficient (σs) at 450, 550, and 700 nm versus the scattering Ångström exponent (αs). Cases with extremely negative (<−2) and positive (>4) values ofαs are always related with very low scattering coefficients, and are likely due to instrumental noise under low scattering conditions. Right: frequency of occurrence ofαsobtained considering vertical profiles data from all TRAQA and SAFMED flights.
40 80 120 160
CO,
O3
(p
pb
v)
BL FT BL FT CO O3
0 2000 4000 6000 20000
dN
Acc
,d
NAitken
(s
cm
-3)
BL FT BL FT dNAitken dNAcc
0 40 80 120
S
(M
m
-1,S
T
P
)
BL FT
450 nm
550 nm
700 nm
Figure 5. Box and whisker plot of the aerosol scattering coefficient (σs)at 450, 550, and 700 nm, particle concentration in the Aitken
(dNAitken)and accumulation (dNAcc)modes, and CO and O3measured within pollution plumes in the boundary layer (BL) and in the free
troposphere (FT).
observed close to the surface over the continents. Values of dN as high as in the BL are observed in the FT because of transport in specific conditions, as discussed below.
The observations of aerosol profiles obtained during TRAQA and SAFMED are representative of the complex transport regimes which characterises the export towards the western basin and that is mostly determined by the interac-tion between regional meteorology and local dynamics (e.g. Gangoiti et al., 2001). A first example is associated with the measurements in the area of Barcelona. As discussed in Pérez et al. (2004) the presence of mountains up to∼500–
3000 m altitude a few kilometres inland favours, during sum-mertime, the recirculation of pollutants along the coast of Spain. In these cases, the aerosols emitted at the surface in coastal areas are transported inland and uplifted by sea breezes and mountain winds, and then the plumes are re-injected at different altitudes and distances from the coast. During the TRAQA flights V24, V25, and V26, under the in-fluence of pollution outflow from the Barcelona area, we de-tected the presence of aerosol layers with elevated concentra-tions (dNAcc∼2000–3000 scm−3)up to 3500 m altitude at a distance of∼3 0 to 250 km from the coast of Spain. Another
example of complex dynamics linked to coastal orography is
that associated with the export from northern Italy and the Po Valley towards the Gulf of Genoa. The presence of the Apen-nine Mountains close to the Ligurian coast (max elevation
∼1500–2000 m) causes the uplift of continental air masses
so determining the injection of aerosol plumes at different altitudes both inside and outside the BL. Examples are given by flights V19, V21 and V52 for which pollution aerosols from northern Italy are measured up to∼2000–3000 m
alti-tude throughout the Gulf of Genoa. Finally, another meteo-rological condition which largely influences the aerosol ex-port and distribution over the western Mediterranean is the mistral/tramontane wind regime. Under the influence of the mistral flow, atmospheric aerosols can be dispersed as far as hundreds of kilometres over the open sea, as discussed by Salameh et al. (2007). Examples are given in profiles V20 and V28, performed at more than 100 km from the French coast, for which pollution layers associated with a mistral flow are measured up to 2000–3000 m altitude.
5.2 Trace gases vertical profiles
Figure 7 shows O3versus CO for all TRAQA and SAFMED
flights, while examples of CO and O3profiles, representative
0 40 80 120 0 1000 2000 3000 4000 5000 alt itu de (m)
0 2000 4000
V46, 24 July 2013 11:05-11:24 UTC
(43.0°N, 9.3°E)
0 40 80 120
0 2000 4000
V48, 25 July 2013 14:48-15:08 UTC
(43.0°N, 9.3°E)
0 40 80 120
Particle scattering coefficient, s(Mm-1, STP)
0 2000 4000
V49, 27 July 2013 11:34-11:55 UTC
(43.7°N, 9.6°E)
0 40 80 120
0 2000 4000
V51, 30 July 2013 14:33-15:02 UTC
(43.0°N, 9.3°E)
0 40 80 120
0 2000 4000
V52, 01 Aug 2013 12:37-12:58 UTC
(43.0°N, 7.6°E) SAFMED 2013
0 40 80 120
0 1000 2000 3000 4000 5000 a ltitu de (m)
0 2000 4000
BL MABL V16, 20 June 2012
14:11-14:32 UTC (42.7°N, 3.2°E)
0 40 80 120
0 2000 4000
V19, 26 June 2012 11:04-11:21 UTC
(43.2°N, 9.7°E)
0 40 80 120
0 2000 4000
Particle number concentration, dNAcc(scm-3) and dNCoarse(10-2scm-3)
V20, 27 June 2012 5:48-6:06 UTC (41.4°N, 6.7°E)
0 40 80 120
0 2000 4000
V21, 27 June 2012 10:31-10:52 UTC
(42.9°N, 7.7°E)
0 40 80 120
0 2000 4000
V22b, 29 June 2012 8:03-8:29 UTC (42.1°N, 9.5°E) TRAQA 2012
0 40 80 120
0 1000 2000 3000 4000 5000 a ltitu de (m)
0 2000 4000
V23b, 29 June 2012 11:37-12:04 UTC
(42.9°N, 7.7°E)
0 40 80 120
0 2000 4000
V24, 03 July 2012 12:39-13:07 UTC
(42.2°N, 3.5°E)
0 40 80 120
0 2000 4000
V25, 4 July 2012 8:32-9:04 UTC (41.5°N, 6.0°E)
0 40 80 120
0 2000 4000
V26, 04 July 2012 16:07-16:41 UTC
(42.8°N, 4.2°E)
0 40 80 120
0 2000 4000
0 40 80 120
0 1000 2000 3000 4000 5000 alt itu de (m)
0 2000 4000
V28b, 06 July 2012 16:20-16:42 UTC
(42.6°N, 7.0°E)
0 40 80 120
0 2000 4000
V30, 07 July 2012 14:28-14:50 UTC
(43.6°N, 8.4°E)
0 40 80 120
0 2000 4000
V31, 10 July 2012 15:10-15:33 UTC
(39.9°N, 0.1°E)
0 40 80 120
0 2000 4000
s(450 nm) s(550 nm)
s(700 nm) dNAcc dNCoarse V32, 11 July 2012
12:33-12:51 UTC (44.0°N, 8.2°E) Horizontal lines Curves D D D D D
V27a, 06 July 2012 9:01-9:25 UTC (42.7°N, 5.3°E)
Figure 6.Vertical profiles of the spectral scattering coefficientσs at 450, 550, and 700 nm and particle number concentration in the 0.1–
1.0 µm (dNAcc)and 1.0–4.0 µm (dNCoarse∗ )diameter ranges observed during TRAQA and SAFMED. Data are reported at STP (standard
temperature and pressure,T =293.15 K andP=1013.25 hPa). The heights of the top of the marine aerosol boundary layer (MABL) and
Table 2.Comparison of the number concentrations dNAitken(0.004–0.1 µm) and dNAcc(0.1–1.0 µm) observed during the TRAQA/SAFMED
field campaigns with those reported in literature for continental Europe. All literature data refer to airborne measurements.
Atmospheric layer Parameter TRAQA/SAFMED Literature values for continental Europe
Free troposphere (FT) dNAitken(scm−3) 0–19 250 812–9149b; 0–980e dNAcc(scm−3) 34–3233 20–80a; 25–85e; 0–500f
Boundary layer (BL) dNAitken(scm−3) 4–22 471 1037–31 370b; 1000–20 000c; 0–30 000d; 0–19 000e dNAcc(scm−3) 90–3215 70–560a; 10–50c; 400–1200e; 0–2000f
aPetzold et al. (2002), central Europe, July–August 1998; size range dN
Acc(>0.15 µm).bMallet et al. (2005), south-eastern France, June 2001; size range dNAitken(0.006–0.6 µm).cWiegner et al. (2006), Germany, May 2003; size range dNAitken(>0.01 µm), dNAcc(>0.3 µm).dJunkermann (2009), Po Valley, July–August 2002 and September–October 2003 ; size range dNAitken(>0.01 µm).eHamburger et al. (2012), central Europe, May 2008; size range dNAitken
(0.004–0.15 µm), dNAcc(>0.15 µm)fHighwood et al. (2012), central Europe, May 2008; size range dNAitken(0.004-0.15 µm), dNAcc(>0.15 µm).
40 80 120 160
20 40 60 80 100
3
40 80 120 160 Boundary layer (BL) Free troposphere (FT)
Figure 7.O3versus CO in the boundary layer (BL) and the free
tro-posphere (FT) for all TRAQA and SAFMED vertical profiles (dust observations excluded).
CO and O3vary in the range of 60–165 and 30–85 ppbv,
respectively. The 25th and 75th percentiles are 87 and 105 ppbv for CO and 49 and 62 ppbv for O3, representative
of moderate pollution conditions (i.e. Parrish et al., 1998). By comparison, the values measured over land in central Italy during flight V49 are in the range of 80–180 ppbv for carbon monoxide and 40–85 ppbv for ozone. CO and O3are
gener-ally correlated (correlation coefficient R2∼0.5–0.8) within
measured pollution plumes, and also correlated withσsand
NAcc both in the BL and in the FT, which indicates
pho-tochemically active plumes. CO is generally higher in the BL, and shows absolute maxima in the lowest levels (V20, V21, V24, V28, V46), then decreasing in the FT. Ozone presents a more complicated vertical structure due to the dif-ferent photochemical and dynamical processes which con-trol its formation and distribution. At first, local peaks of O3 correlated with CO are observed corresponding to
pol-lution plumes both in the BL and in the FT. An absolute maximum of O3is sometimes found near the top of the BL
(V24, V25, V30) possibly due to aged air masses trapped in the boundary layer. Isolated peaks of O3(∼75–80 ppbv) not
correlated with aerosols and CO are also measured in a few cases above 3000–3500 m (V21, V25, V27, V28, V52). The
analysis of back-trajectories indicates that these high-altitude ozone layers are associated with the descent of air masses travelling at about 7–8 km, which thus may suggest a down-ward transport from the upper troposphere or the tropopause region due to a stratosphere–troposphere exchange (Ancellet and Ravetta, 2005). Finally, absolute minima of O3 (∼15–
30 ppbv) are measured within the dust layers during flights V20 and V21, maybe related to the dust/ozone heterogeneous reactions which lead to O3 destruction, as documented in
several studies (Bonasoni et al., 2004; Haywood et al., 2011). 5.3 1O3/1CO and dNAitken/dNAccratios and
variability of pollution plume composition
Using the O3, CO, dNAitken and dNAcc measurements we
have estimated
– the O3–CO enhancement ratio (1O3/1CO), i.e. the
ra-tio of the ozone to carbon monoxide variara-tions com-pared to their baseline values. The1O3/1CO
enhance-ment ratio is frequently used to estimate the efficiency of O3 formation and its export (Parrish et al., 1993;
Zhang et al., 2006). From our observations (Fig. 7) we have estimated a background value of∼70 ppbv in the
BL and 60 ppbv in the FT for CO and∼30 ppbv for O3
both in the BL and in the FT;
– the Aitken-to-accumulation number ratio (dNAitken/dNAcc), which defines the relative
im-portance of particles in the Aitken and accumulation modes. dNAitken is generally associated with
gas-to-particle conversion and nucleation events and is higher in fresh plumes, while it decreases with increasing plume lifetime due to coagulation or condensation of water-soluble chemical species on the particle surface (Kulmala et al., 2004).
The combination of 1O3/1CO and dNAitken/dNAcc has
been used to retrieve additional information on the atmo-spheric vertical structure, layering, and particle aging.
Within detected pollution plumes,1CO and1O3reach up
cor-responding 1O3/1CO ratio which varies in the range of ∼0.10–2.0 for all cases. The1O3/1CO ratio is highly noisy
and this is due in part to the noise in the CO data, and in part also possibly associated with the slight mismatch between CO and O3caused by their different time resolution (30 s for
CO and 4 s for O3). The values of1O3/1CO obtained in this
study are comparable with the range of observations avail-able in the literature for fresh and moderately aged pollution plumes in the BL and in the lower FT (∼0.2–1.0) (Chin et al.,
1994; Parrish et al., 1998; Zhang et al., 2006; Cristofanelli et al., 2013). dNAitken/dNAcc is between about 1 and 20 in
most pollution cases, which indicates the presence of both fresh layers rich in Aitken particles and aged plumes poor in Aitken particles. Extremely high values of dNAitken/dNAcc
(∼50–200) are measured in a few cases in layers with very
low dNAccconcentrations.
The large variability in 1O3/1CO and dNAitken/dNAcc
indicates a strong heterogeneity, in terms of composition and lifetime for the different observed plumes. This heterogene-ity reflects the complexheterogene-ity in terms of sources, production processes, and transport mechanisms, which characterises the western basin. In order to illustrate this point, we have selected three examples representative of different conditions observed in different areas of the basin: (i) V19, performed in the Gulf of Genoa corresponding to continental outflow events from northern Italy/Po Valley; (ii) V20, performed in southern France during a mistral event; (iii) V24, which mea-sured the export of pollution from the area of Barcelona. The vertical profiles of the spectral scattering coefficientσs,
tem-peratureT, relative humidity RH, dNAcc, dNAitken, CO, O3,
1O3/1CO, dNAitken/dNAccand wind are reported in Fig. 8
for these cases.
1. V19: export from northern Italy/Po Valley. The pro-file shown for flight V19 (Fig. 8a) is characterized by the presence of three different aerosol structures: the first one below 800 m, characterized by a lower dNAitken/dNAcc(∼1–5) and relatively high1O3/1CO
(∼0.4–1.5), possibly associated with moderately aged
pollution; the second one between 800 and 2600 m, richer in fine particles (dNAitken/dNAcc∼5–15), so
possibly linked to fresher emissions; and the third one above 2600 m, where the dNAitken/dNAcc ratio rises
rapidly, as will be further discussed in Sect. 5.4. The export of fresh pollution at 800–2600 m from northern Italy as observed in V19 may be related to the peculiar orography of this region and the uplift of continental air masses. This is confirmed by the analysis of the back-trajectories (Fig. 9) which indicates that the air masses arriving at 1000 and 2000 m passed over the western Po Valley at an altitude of about 400–1200 m and were then uplifted near the Ligurian coast to enter the basin above the BL. Junkermann (2009) measured high levels of fine particles up to about 2000 m in the western Po Valley, which means that the altitudes of 400–1200 m reached
by our investigated air masses could have been suffi-cient for them to collect fresh emitted particles along their path. Conversely, below 800 m the air mass trajec-tory shows a longer subsidence over the sea surface in the troposphere which has possibly favoured the advec-tion of more aged plumes, or the mixing with sea salts, thus inducing the decrease of the dNAitken/dNAcc
ra-tio. It should be noted that the aerosol layer in the FT also shows relatively higher values of the1O3/1CO
ratio (∼0.6–1.0) compared to the more aged plume in
the BL. The enhanced amount of O3 in this air mass
can be linked to a high concentration of volatile pre-cursors which may have favoured the build-up of ozone during the plume evolution. In a recent work, Kaiser et al. (2015) suggest that in the Po Valley the high con-tent of formaldehyde, also observed by Junkermann et al. (2009), may be responsible for the excess of O3
pro-duction. Fresh layers in the FT up to ∼2000–3000 m
possibly associated with pollution export from north-ern Italy were also observed during flights V21 and V52 (not shown).
2. V20: export during a mistral/tramontane event. As shown in Fig. 8b, winds from the northwest are measured at all altitudes during flight V20. The aerosol profile in the BL is characterized in the first
∼400 m by the presence of a layer richer in dNAitken
(dNAitken/dNAcc>20) and CO (100 ppbv close to the surface; CO data not available between 150 and 650 m) possibly linked to fresh pollution, followed by the alternation of several layers characterized by a variable dNAitken (1000–6000 scm−3) and lower CO (∼70 ppbv). A local minimum of dNAitken and σs is
found at ∼400 m. For all these layers the O3 is very
low (∼30–40 ppbv) and the1O3/1CO ratio is<0.6– 0.8. At higher altitudes, between 1400 and 2000 m, we observe a layer enriched in O3(1O3/1CO∼1–2),
cor-responding to an almost aerosol-free region. This en-riched ozone layer might be possibly associated with a downward transport from higher tropospheric layers (as also suggested by the back-trajectories (Fig. 9)) or with mixing together with ozone rich layers along the air mass trajectory. Larger particles, from long-range trans-port of Saharan dust at latitudes below 30◦N, are
mea-sured between 2000 and 3000 m, with a minimum of O3 (∼15–20 ppbv) registered within the layer. Several
other flights were performed during mistral/tramontane episodes (V27, V28, V30, V32) and show, similarly to V20, the presence of several layers both in the BL and the FT.
0 20 40 60 80
s (Mm-1, STP), RH (%)
0 1000 2000 3000 4000
altitude
(m)
0 10 20 30 T (°C)
V19
26 June 2012 11:04-11:21 UTC (43.2°N, 9.7°E)
60 90 120 150 CO (ppbv) 20 40 60 80
O3(ppbv)
0 1000 2000 dNAcc(scm-3)
0 6000 12000 dNAitken(scm-3)
0 0.4 0.8 1.2 1.6 2
O3/ CO 0 10 20 100 200
dNAitken/dNAcc
dNAitken dNAcc
s
RH
T
CO O3
Wind vector
O3/ CO
dNAitken/dNAcc
a) b) c) d) e)
0 20 40 60 80
s (Mm-1, STP), RH (%)
0 1000 2000 3000 4000
altitude
(m)
0 10 20 30 T (°C)
V20
27 June 2012 5:48-6:06 UTC (41.4°N, 6.7°E)
60 90 120 150 CO (ppbv) 20 40 60 80
O3(ppbv)
0 1000 2000 dNAcc(scm-3)
0 6000 12000 dNAitken(scm-3)
0 0.4 0.8 1.2 1.6 2
O3/ CO 0 10 20 40 60
dNAitken/dNAcc
dNAitken dNAcc s
RH
T
CO
O3
Wind vector
O3/ CO
dNAitken/dNAcc
a) b) c) d) e)
0 20 40 60 80
s (Mm-1, STP), RH (%)
0 1000 2000 3000 4000 5000
altitude
(m)
0 10 20 30 T (°C)
V24
03 July 2012 15:39-16:07 UTC (41.5°N, 6.0°E)
60 90 120 150 CO (ppbv) 40 60 80
O3(ppbv)
0 1000 2000 dNAcc(scm-3)
0 6000 12000 dNAitken(scm-3)
0 0.4 0.8 1.2 1.6 2
O3/ CO 0 10 40 60
dNAitken/dNAcc
dNAitken dNAcc s
RH
T
CO
O3
Wind vector
O3/ CO dNAitken/dNAcc 5 ms
-1
a) b) c) d) e)
N
E
5 ms-1
N
E
5 ms-1
N
E
Figure 8.Aerosol and trace gases vertical profiles for flights V19 (export from northern Italy/Po Valley), V20 (mistral event), and V24
(export from the Barcelona area). The plots show the(a)spectral scattering coefficientσsat 450, 550, and 700 nm (blue, green, and red lines, respectively), temperature (T, black line), and relative humidity (RH, light blue line);(b)particle number concentration in the 0.004–0.1 µm
(dNAitken, purple line) and 0.1–1.0 µm (dNAcc, black line) diameter ranges;(c)CO (black dots) and O3(grey dots) mixing ratios;(d)ozone
enhancement factor1O3/1CO (grey dots) and Aitken-to-accumulation ratio dNAitken/dNAcc(pink dots); and(e)horizontal wind vector.
Longitude (deg)
Longitude (deg)
Longitude (deg)
V19
26 June 2012
V20
27 June 2012
V24
03 July 2012
Figure 9.Five-day backward air mass trajectories for the V19, V20, and V24 flights calculated with the FLEXTRA model. The upper panel
shows the trajectories over an extended latitude–longitude region, while the central panel focuses on the western Mediterranean area. The altitude of the air masses and its temporal evolution along the 5-day trajectories is reported in the lower panel of each plot.
the MABL, coming from the south-west and directly exported from the area of Barcelona. The layer is characterized by high CO (90–120 ppbv), and rel-atively low values of dNAitken (∼4000 scm−3) and O3 (∼50 ppbv), which possibly suggest the mixing
of pollution with marine particles close to the sea surface. A second layer of fresher particles, always coming from the south-west, is observed above the MABL between 200 and 600 m (dNAitken∼ 6000–
8000 scm−3, O
3∼70 ppb, with dNAitken/dNAcc∼5–15,
and 1O3/1CO∼0.8–1.5). A third, more aged,
sub-layer (dNAitken/dNAcc∼2–5,1O3/1CO∼0.8–1.0) is
observed within the BL between 600 and 1000 m. The FT is characterized by the presence of moderately aged plumes from ∼1000 to 2800 m (dNAitken/dNAcc∼2–
10, 1O3/1CO∼0.2–0.8), and a very aged plume at
2800–3800 m almost devoid in Aitken particles and richer in O3 (dNAitken/dNAcc<1, 1O3/1CO∼0.6–
1.5). A marked local minimum is observed at the top of the BL forσs, dNAcc, dNAitken, CO, and O3, suggesting
the presence of air masses with different origin between the BL and the FT. This is also confirmed by the analysis of the back-trajectories (Fig. 9), which indicates a low
level air masses coming from the Spanish coast in the BL, and air masses travelling at higher altitudes in the FT. In particular, the layer at 2800–3800 m is possibly associated with intercontinental transport from North America, as shown in the trajectory ending at 3500 m. A similar structure characterized by the alternation of fresher and more aged plumes in the BL and FT is also observed in V25 for which aerosol layers are detected up to 4000 m altitude.
The detailed analysis of these three events evidences the complexity of the atmospheric structure over the western Mediterranean basin in relation to the different dynamical processes involved.
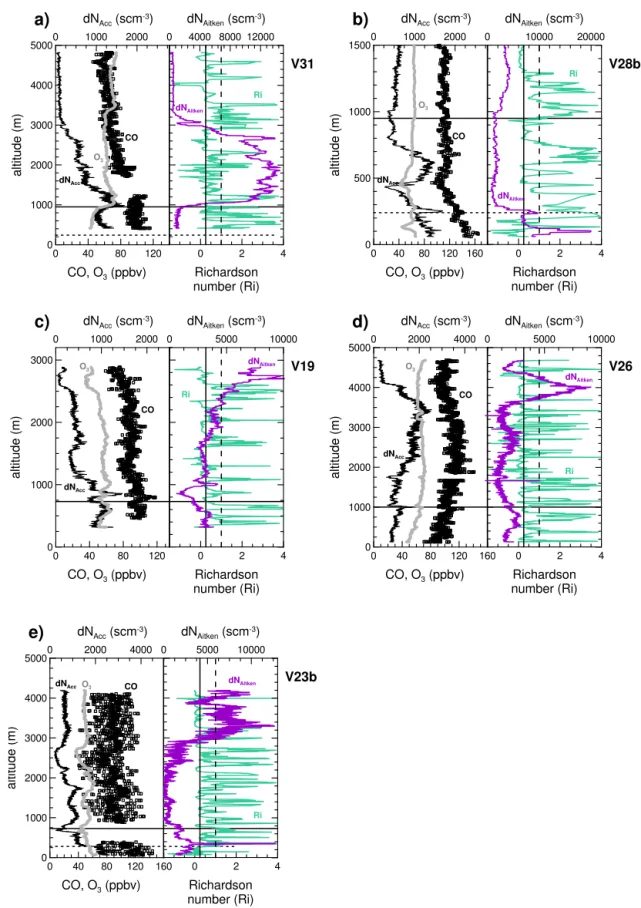
5.4 Layers with enhanced Aitken-mode particle numbers
Isolated layers with dNAitken values of ∼10 000–
15 000 scm−3 were observed occasionally both in the
BL and in the FT. The vertical profiles of dNAitkenfor some
selected cases are shown in Fig. 10.
For about half of the observed events the dNAitken layer
0 40 80 120
CO, O3(ppbv)
0 1000 2000 3000
altitude
(m)
0 1000 2000
dNAcc(scm-3)
V19
dNAcc
0 2 4
Richardson number (Ri)
0 5000 10000
dNAitken(scm-3)
dNAitken
Ri
O3
CO
c)
0 40 80 120 160
CO, O3(ppbv)
0 1000 2000 3000 4000 5000
altitude
(m)
0 2000 4000
dNAcc(scm-3)
V26
dNAcc
0 2 4
Richardson number (Ri)
0 5000 10000
dNAitken(scm-3)
dNAitken
Ri
O3
CO
d)
0 40 80 120 160
CO, O3(ppbv)
0 500 1000 1500
altitude
(m)
0 1000 2000
dNAcc(scm-3)
V28b
dNAcc
0 2 4
Richardson number (Ri)
0 10000 20000
dNAitken(scm-3)
dNAitken
Ri
O3
CO
b)
0 40 80 120
CO, O3(ppbv)
0 1000 2000 3000 4000 5000
a
ltitude
(m)
0 1000 2000
dNAcc(scm-3)
V31
dNAcc
0 2 4
Richardson number (Ri) 0 4000 8000 12000
dNAitken(scm-3)
dNAitken
Ri
O3
CO
a)
0 40 80 120 160
CO, O3(ppbv)
0 1000 2000 3000 4000 5000
altitude
(m)
0 2000 4000
dNAcc(scm-3)
V23b dNAcc
0 2 4
Richardson number (Ri)
0 5000 10000
dNAitken(scm-3)
dNAitken
Ri
O3 CO
e)
Figure 10.Vertical profiles of the accumulation and Aitken particle concentrations (dNAcc, black line, and dNAitken, purple line), CO (black
and O3, which suggests that the layer has been transported
from a region directly emitting in this size range. These cases are: V16 at ∼200–400 m, V21 at∼400–800 m, V28
at∼250 m, and V31 at∼1000–3000 m (only V28 and V31
are shown in Fig. 10). The most remarkable example is V31 (Fig. 10a), performed close to the coast of Spain near Valen-cia, for which the high dNAitkenlayer extends from the top of
the BL to∼3000 m altitude. The wind vector and the
back-trajectories (not shown) indicates that the air mass comes from the west–south-west above 1000 m, so the dNAitken
layer could be directly related to pollution export from the urban region of Valencia.
In all the other cases the high dNAitken layer is generally
not related to simultaneous dNAcc and O3increase. Two of
these cases (V16 at∼800–1000 m and V28 at∼100 m)
oc-cur in the BL.
For the V28 layer (Fig. 10b) the dNAitken is correlated
with CO which might indicate the influence of local emis-sions close to the surface level (i.e. ship emisemis-sions). CO val-ues are relatively high (140–160 ppbv) within the layer. It has been often assumed that new particle formation events (NPF) only occur in mostly clean environments (e.g. O’Dowd et al., 2010; Sellegri et al., 2010), and that they are suppressed un-der polluted conditions. In a recent study, Brines et al. (2015) also show the occurrence of NPF events in urban areas with high levels of pollution in the Mediterranean region. So, we explore the possibility of NPF in our observations. Given the size ranges of the CPC and PCASP, however, we cannot de-termine particle concentration within dNAitkenin the sole 4–
20 nm range, i.e. the size range involved in nucleation. So it is not possible to directly associate the V28 observations with NPF. In order to obtain a qualitative indication of the possi-ble occurrence of NPF, we have looked at the air mass dy-namics within the layer. Several studies suggest, in fact, that NPF might be favoured by turbulence and air mass mixing (e.g. Nilsson et al., 2001; Wehner et al., 2010). We have thus looked at the gradient Richardson number (Ri) which gives information on the atmospheric dynamical stability. Vertical profiles ofRiare also shown in Fig. 10. For V28 the verti-cal profile of Riindicates that below 200 m theRinumber is consistently below zero, which suggests well-established turbulent conditions possibly favouring NPF in this layer.
In other two cases (V19, Fig. 10c, and V26, Fig. 10d), under lower pollution conditions (CO<100), we measured high dNAitken concentration corresponding with low dNAcc
layers in the FT at∼2800–3000 m for V19 and 3500–4500 m
for V26. For V19 and V26 layers, dNAitken seems
anticor-related to CO. Also in this case the Richardson number is below Ricrit corresponding with Aitken peak, meaning that
conditions are favourable for turbulence within the layer, and this may indicate the possible role of NPF in this case as well. Finally, a case of high dNAitkenconcentration has been also
observed corresponding to dust particles between ∼3000
and 4000 m (V23b, Fig. 10e). This layer can be possibly linked to the photochemically induced nucleation which may
occur in the presence of dust and SO2as hypothesised in a
recent study by Dupart et al. (2012) and observed by Nie et al. (2014).
6 Conclusions
The data presented in this paper gives an overview of the dis-tribution of aerosols and trace gases within the tropospheric column up to 5000 m above the western Mediterranean basin. These data add to the very few available measurements of aerosol and trace gases vertical profiles over the sea surface in the central (e.g. Junkermann, 2001; Meloni et al., 2003; Di Iorio et al., 2003; Pace et al., 2015) and eastern (e.g. For-menti et al., 2002; Dulac and Chazette, 2003) parts of the basin thus improving the description of the atmospheric com-position and structure over the whole Mediterranean area.
Observations from the present study indicate that conti-nental pollution strongly affects the composition and struc-ture of the western Mediterranean basin both close to coastal regions and in the open sea. Pollution layers extend up to 250 km far from the coast and reach up to 3000–4000 m al-titude, presenting a complex and highly stratified structure. The measured particle concentration is comparable with the values reported for continental Europe (Petzold et al., 2002; Junkermann, 2009; Hamburger et al., 2012).
Pollution plumes with different compositions, origins, and lifetimes are observed in relation to the different observed dynamical export conditions and meteorological regimes. The aerosol and trace gas observations during TRAQA and SAFMED are consistent with the results of previous cam-paigns and with the interpretation of observed or well-known air mass dynamics and meteorological phenomena that occur in the western basin (Flamant and Pelon, 1996; Millan et al., 1997; Gangoiti et al., 2001; Pérez et al., 2004; Mallet et al., 2005).
The large heterogeneity in aerosol compositions, origins, and lifetimes as documented in this study can reflect a large heterogeneity of aerosol optical properties, with con-sequences for their direct radiative effect in this part of the basin. This will be investigated in a companion paper analysing the TRAQA and SAFMED in situ measurements of the aerosol absorption and scattering properties and their variability.
From the present observations, it is also worth noting the relatively high values of dNAitken measured both in the BL
of pollution into the upper troposphere, as is common in the western basin, might promote the occurrence of these events. The observations of the present study may thus also have very large implications due to the crucial role of NPF in controlling the atmospheric cloud condensation nuclei con-centration (Spracklen et al., 2008) and the associated aerosol indirect effect on climate.
Author contributions. J.-L. Attié, F. Ravetta, G. Ancellet, M.
Beek-mann, A. Borbon, P. Formenti and K. Sartelet designed the TRAQA and SAFMED experiments and coordinated the campaigns. C. Gaimoz, N. Grand, and C. Di Biagio operated the instruments on board the ATR-42 during the flights. C. Di Biagio performed data analysis with contributions from L. Doppler, P. Formenti, F. Ravetta, A. Borbon, G. Ancellet, J.-C. Raut, and M. Beekmann. G. Ancellet performed FLEXTRA simulations. J.-C.R. performed WRF-Chem simulations. C. Di Biagio wrote the manuscript.
Acknowledgements. All measurement presented here are from the
Chemistry-Aerosol Mediterranean Experiment project (ChArMEx, http://charmex.lsce.ipsl.fr), which is the atmospheric component of the French multidisplinary program MISTRALS (Mediterranean Integrated Studies aT Regional And Local Scales). ChArMEx-France was principally funded by INSU, ADEME, ANR, CNES, CTC (Corsica region), EU/FEDER, Météo-France, and CEA. TRAQA was funded by ADEME/PRIMEQUAL and MIS-TRALS/ChArMEx programmes and Observatoire Midi-Pyrénées. SAFMED was funded by the ANR project SAF-MED (Secondary Aerosol Formation in the MEDiterranean, grant SIMI6 ANR-12-BS06-0013). C. Di Biagio thanks the Centre National des Etudes Spatiales (CNES) for financial support.
The authors wish to thank the technicians, pilots and ground crew of SAFIRE (Service des Avions Francais Instruments pour la Recherche en Environnement) for facilitating the instrument integration and conducting flying operations. We thank S. Chevail-lier, L. Girault, R. Loisil, J. Pelon, S. Triquet, and P. Zapf for their contribution during the campaigns. We thank S. Basart, J. M. Baldasano, M. Mallet, P. Goloub, J. Piazzola and their staff for establishing and maintaining the Barcelona, Ersa, and Frioul AERONET sites. Helpful discussions with G. Pace are gratefully acknowledged. We thank also two anonymous reviewers whose suggestions helped to clarify the manuscript.
Edited by: C. Reeves
References
Ancellet, G. and Ravetta, F.: Analysis and validation of ozone vari-ability observed by lidar during the ESCOMPTE-2001 cam-paign, Atmos. Res., 74, 435–459, 2005.
Anderson, T. L. and Ogren, J. A.: Determining aerosol radiative properties using the TSI 3563 integrating nephelometer, Aerosol Sci. Technol., 29, 57–69, 1998.
Anderson, T. L., Covert, D. S., Marshall, S. F., Laucks, M. L., Charl-son, R. J., Waggoner, A. P., Ogren, J. A., Caldow, R., Holm, R. L.,
Quant, F. R., Sem, G. J., Wiedensholer, A., Ahlquist, N. A., and Bates, T. S.: Performance characteristics of a high-sensitivity, three-wavelength, total scatter/backscatter nephelometer, J. At-mos. Ocean. Tech., 13, 967–986, 1996.
Bonasoni, P., Cristofanelli, P., Calzolari, F., Bonafè, U., Evangelisti, F., Stohl, A., Zauli Sajani, S., van Dingenen, R., Colombo, T., and Balkanski, Y.: Aerosol-ozone correlations during dust transport episodes, Atmos. Chem. Phys., 4, 1201–1215, doi:10.5194/acp-4-1201-2004, 2004.
Boucher, O., Randall, D., Artaxo, P., Bretherton, C., Feingold, G., Forster, P., Kerminen, V.-M., Kondo, Y., Liao, H., Lohmann, U., Rasch, P., Satheesh, S. K., Sherwood, S., Stevens, B., and Zhang, X. Y.: Clouds and Aerosols, in: Climate Change 2013: The Phys-ical Science Basis. Contribution of Working Group I to the Fifth Assessment Report of the Intergovernmental Panel on Climate Change, edited by: Stocker, T. F., Qin, D., Plattner, G.-K., Tig-nor, M., Allen, S. K., Boschung, J., Nauels, A., Xia, Y., Bex, V., and Midgley, P. M., Cambridge University Press, Cambridge, United Kingdom and New York, NY, USA, 571–657, 2013. Boulon, J., Sellegri, K., Venzac, H., Picard, D., Weingartner, E.,
Wehrle, G., Collaud Coen, M., Bütikofer, R., Flückiger, E., Bal-tensperger, U., and Laj, P.: New particle formation and ultrafine charged aerosol climatology at a high altitude site in the Alps (Jungfraujoch, 3580 m a.s.l., Switzerland), Atmos. Chem. Phys., 10, 9333–9349, doi:10.5194/acp-10-9333-2010, 2010.
Brines, M., Dall’Osto, M., Beddows, D. C. S., Harrison, R. M., Gómez-Moreno, F., Níñez, L., Artíñano, B., Costabile, F., Gobbi, G. P., Salimi, F., Morawska, L., Sioutas, C., and Querol, X.: Traf-fic and nucleation events as main sources of ultrafine particles in high-insolation developed world cities, Atmos. Chem. Phys., 15, 5929–5945, doi:10.5194/acp-15-5929-2015, 2015.
Chazette, P., Randriamiarisoa, H., Sanak, J., Couvert, P., and Flamant, C.: Optical properties of urban aerosol from air-borne and ground based in situ measurements performed dur-ing the ESQUIF program, J. Geophys. Res., 110, D02206, doi:10.1029/2004JD004810, 2005.
Chin, M., Jacob, D. J., Munger, J. W., Parrish, D. D., and Doddridge, B. G.: Relationship of ozone and carbon monoxide over North America, J. Geophys. Res., 99, 14565–14573, 1994.
Cristofanelli, P., Fierli, F., Marinoni, A., Calzolari, F., Duchi, R., Burkhart, J., Stohl, A., Maione, M., Arduini, J., and Bonasoni, P.: Influence of biomass burning and anthropogenic emissions on ozone, carbon monoxide and black carbon at the Mt. Cimone GAW-WMO global station (Italy, 2165 m a.s.l.), Atmos. Chem. Phys., 13, 15–30, doi:10.5194/acp-13-15-2013, 2013.
Di Iorio, T., di Sarra, A., Junkermann, W., Cacciani, M., Fiocco, G., and Fua‘, D.: Tropospheric aerosols in the Mediterranean: 1. Microphysical and optical properties, J. Geophys. Res., 108, 4316, doi:10.1029/2002JD002815, 2003.