ACPD
11, 22033–22073, 2011Southeast Asian aerosol composition
W. Trivitayanurak et al.
Title Page
Abstract Introduction
Conclusions References
Tables Figures
◭ ◮
◭ ◮
Back Close
Full Screen / Esc
Printer-friendly Version Interactive Discussion
Discussion
P
a
per
|
Dis
cussion
P
a
per
|
Discussion
P
a
per
|
Discussio
n
P
a
per
Atmos. Chem. Phys. Discuss., 11, 22033–22073, 2011 www.atmos-chem-phys-discuss.net/11/22033/2011/ doi:10.5194/acpd-11-22033-2011
© Author(s) 2011. CC Attribution 3.0 License.
Atmospheric Chemistry and Physics Discussions
This discussion paper is/has been under review for the journal Atmospheric Chemistry and Physics (ACP). Please refer to the corresponding final paper in ACP if available.
The composition and variability of
atmospheric aerosol over Southeast Asia
during 2008
W. Trivitayanurak1,*, P. I. Palmer1, M. P. Barkley2, N. H. Robinson3, H. Coe3, and D. E. Oram4
1
School of GeoSciences, University of Edinburgh, Edinburgh, UK
2
Space Research Centre, University of Leicester, Leicester, UK
3
Centre for Atmospheric Science, University of Manchester, Manchester, UK
4
National Centre for Atmospheric Sciences, School of Environmental Sciences, University of East Anglia, Norwich, UK
*
now at: Department of Highways, Ministry of Transport, Thailand
Received: 7 July 2011 – Accepted: 2 August 2011 – Published: 4 August 2011
Correspondence to: P. I. Palmer ([email protected])
ACPD
11, 22033–22073, 2011Southeast Asian aerosol composition
W. Trivitayanurak et al.
Title Page
Abstract Introduction
Conclusions References
Tables Figures
◭ ◮
◭ ◮
Back Close
Full Screen / Esc
Printer-friendly Version Interactive Discussion
Discussion
P
a
per
|
Dis
cussion
P
a
per
|
Discussion
P
a
per
|
Discussio
n
P
a
per
|
Abstract
We use a nested version of the GEOS-Chem global 3-D chemistry transport model to better understand the composition and variation of aerosol over Borneo and the broader Southeast Asian region in conjunction with aircraft and satellite observations. We particularly focus on July 2008 during when the UK BAe-146 research aircraft was
5
deployed over northern Malaysian Borneo as part of the ACES/OP3 measurement campaign. During July 2008 we find using the model that Borneo (defined as Borneo Island and the surrounding Indonesian islands) was a net exporter of primary organic aerosol (42 kT) and black carbon aerosol (11 kT). We find only 13 % of volatile organic compound oxidation products partition to secondary organic aerosol (SOA), with
Bor-10
neo being a net exporter of SOA (15 kT). SOA represents approximately 19 % of the total organic aerosol over the region. Sulphate is mainly from aqueous-phase oxida-tion (68 %), with smaller contribuoxida-tions from gas-phase oxidaoxida-tion (15 %) and advecoxida-tion into the regions (14 %). We find that there is a large source of sea salt, as expected, but this largely deposits within the region; we find that dust aerosol plays only a
rela-15
tively small role in the aerosol burden. In contrast to coincident surface measurements over Northern Borneo that find a pristine environment with evidence for substantial bio-genic SOA formation we find that the free troposphere is influenced by biomass burning aerosol transported from the northwest of the Island and further afield. We find sev-eral transport events during July 2008 over Borneo associated with elevated aerosol
20
concentrations, none of which coincide with the aircraft flights. We use MODIS aerosol optical depth (AOD) data and the model to put the July campaign into a longer temporal perspective. We find that Borneo is where the model has the least skill at reproducing the data, reflecting the small-scale island-marine environment, with the model showing more skill at reproducing observed AOD over larger regions such as China and other
25
ACPD
11, 22033–22073, 2011Southeast Asian aerosol composition
W. Trivitayanurak et al.
Title Page
Abstract Introduction
Conclusions References
Tables Figures
◭ ◮
◭ ◮
Back Close
Full Screen / Esc
Printer-friendly Version Interactive Discussion
Discussion
P
a
per
|
Dis
cussion
P
a
per
|
Discussion
P
a
per
|
Discussio
n
P
a
per
Asia but with less sea salt aerosol and more dust aerosol. In contrast, East China AOD is determined mainly by sulphate aerosol and a seasonal source of dust aerosol, as expected. Realistic sensitivity runs designed to test our underlying assumptions about emissions and chemistry over Borneo constrained by MODIS AOD show that the model is most sensitive to isoprene emissions and organic gas-phase partitioning.
5
1 Introduction
Tropical forests help influence regional and global climate in a number of ways includ-ing physical, chemical and biological processes (Bonan, 2008), but our understandinclud-ing of these processes is incomplete (e.g. Lewis et al., 2004; Lelieveld et al., 2008; Karl et al., 2010; Martin et al., 2010b). Here, we focus on the Southeast Asian region, where
10
the individual burgeoning economies are progressively dependent on agriculture, man-ufacturing, and services. Greater pressure on regional agriculture for food and fuel crops, in particular, have led to rapid rates of land use change with implications for the functioning of the forest ecosystems and subsequent impacts on atmospheric composi-tion (Hewitt et al., 2009; Fowler et al., 2011; MacKenzie et al., 2011; Pyle et al., 2011b).
15
Our particular focus is Malaysian Borneo which was the subject of two recent UK-led surface and aircraft measurement campaigns in 2008: (1) OP3 (Oxidant and particle photochemical processes above a South-East Asian tropical rainforest, Hewitt et al., 2010) and (2) ACES (Aerosol Coupling in the Earth System). OP3 had the primary foci of better understanding the production and fate of biogenic volatile organic compounds
20
(BVOCs) emitted by natural forests, and how they impact local to global atmospheric chemistry. ACES had complementary foci associated with the production and fate of SOA from the emitted biogenic VOCs. Here, we use the GEOS-Chem global 3-D model in conjunction with satellite observations of aerosol optical depth to put ACES/OP3 into a wider spatial and temporal perspective and to improve our quantitative
understand-25
ACPD
11, 22033–22073, 2011Southeast Asian aerosol composition
W. Trivitayanurak et al.
Title Page
Abstract Introduction
Conclusions References
Tables Figures
◭ ◮
◭ ◮
Back Close
Full Screen / Esc
Printer-friendly Version Interactive Discussion
Discussion
P
a
per
|
Dis
cussion
P
a
per
|
Discussion
P
a
per
|
Discussio
n
P
a
per
|
Although Southeast Asia has been studied for wildfires and related chemistry (e.g. Chandra et al., 2002 and Duncan et al., 2003), forest emissions and reactive chemistry over the region has recieved much less attention than other tropical regions such as South America (e.g. Lelieveld et al., 2008; Martin et al., 2010a), Africa (e.g. Marticorena et al., 2011; Ferreira et al., 2010), and the Indian subcontinent (e.g. Kulshrestha et al.,
5
2001). This might be because Southeast Asia is smaller in geographical area and that interpretation of measurements is more difficult due to the influence of the island-marine biosphere and complex weather systems. For these reasons, integrative efforts have been made through the ACES/OP3 field campaign to improve understandings of organic aerosol through measurements of aerosol composition (Robinson et al.,
10
2011b), aerosol flux (Whitehead et al., 2010) and its precursor VOC fluxes (Langford et al., 2010; Misztal et al., 2010) and the local meteorology and dynamics (Pearson et al., 2010; Whitehead et al., 2010). To better understand formation of BSOA, studies focused on oxidant chemistry (Robinson et al., 2011b; Pike et al., 2010; Pyle et al., 2011a) in conjunction with smog chamber experiments (Hamilton et al., 2011), analysis
15
of air-mass back trajectories (Robinson et al., 2011c), and 0-D chemistry modelling (Langford et al., 2010; Pike et al., 2010; Pugh et al., 2011), 1-D chemistry-transport modelling (Pugh et al., 2010), and 3-D offline chemistry-transport modelling (Pyle et al., 2011b).
In the next section we describe the surface, aircraft, and satellite measurements of
20
trace gases used in this study. Section 3 describes the GEOS-Chem global 3-D chem-istry model. Section 4 includes (1) the budget of carbonaceous aerosols and trace gas precursors, sulphur species, sea salt, and dust aerosols during July 2008; (2) an evaluation of the model using aircraft concentration measurements and satellite obser-vations of aerosol optical depth; (3) a study of the seasonal cycle of speciated aerosol
25
ACPD
11, 22033–22073, 2011Southeast Asian aerosol composition
W. Trivitayanurak et al.
Title Page
Abstract Introduction
Conclusions References
Tables Figures
◭ ◮
◭ ◮
Back Close
Full Screen / Esc
Printer-friendly Version Interactive Discussion
Discussion
P
a
per
|
Dis
cussion
P
a
per
|
Discussion
P
a
per
|
Discussio
n
P
a
per
2 Measurements of trace gases and aerosols
We use aircraft measurements of aerosols and trace gas precursors from the ACES/OP3 campaign over Borneo (Hewitt et al., 2010) during July 2008 to help quan-tify and understand the aerosol composition of the local and the broader geographical region. First, we use these data to help evaluate the GEOS-Chem global 3-D
chem-5
istry transport model. We also use data from the acid deposition monitoring network (EANET) over East Asia to provide additional information about sulphate aerosol over the broader geographical region. Second, we use the GEOS-Chem model and satellite observations of aerosol optical depth to help relate the ACES/OP3 measurements to large spatial and temporal scales.
10
2.1 ACES/OP3 aircraft field campaign data
We focus on the 23 June–23 July (the third and final phase of the OP3 project) because it incorporated aircraft measurements that are generally representative of spatial scales more appropriate for the GEOS-Chem chemistry transport model (Sect. 3). We use measurements from the UK BAe 146 research aircraft, which during the campaign
15
was deployed from Kota Kinabalu airport, less than 30 mins flying time from Bukit Atur (BA) Global Atmospheric Watch station (4◦58′49.33′′N, 117◦50′39.05′′E, 426 m a.s.l.)
where additional surface measurements were taken. In general, similar flight plans were executed for each flight: one vertical profile, interrupted by straight and level runs at altitudes of 100–250, 1500, 3000, and 6000 m above ground over the rainforest
20
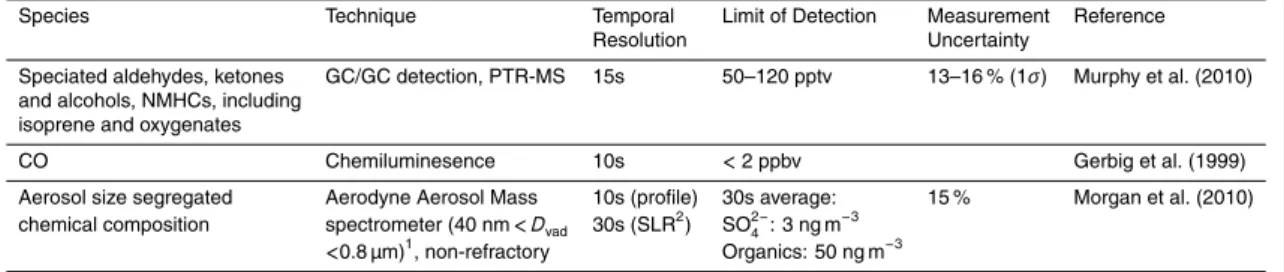
(centred at BA) and over the surrounding landscape including an agro-industrial oil palm plantation. Flights were typically in the morning and afternoon so that some information about diurnal variations of key gases and aerosols could be determined. Table 1 provides a brief overview of the measurements we used for this study. We refer the reader to the OP3 overview paper for a detailed description of the experiment
25
ACPD
11, 22033–22073, 2011Southeast Asian aerosol composition
W. Trivitayanurak et al.
Title Page
Abstract Introduction
Conclusions References
Tables Figures
◭ ◮
◭ ◮
Back Close
Full Screen / Esc
Printer-friendly Version Interactive Discussion
Discussion
P
a
per
|
Dis
cussion
P
a
per
|
Discussion
P
a
per
|
Discussio
n
P
a
per
|
2.2 Surface measurements over eastern Asia
The Acid Deposition Monitoring Network in East Asia (EANET) (http://www.eanet.cc/ index.html) reports dry deposition inferred from direct measurements of atmospheric concentration of SO2, NO2, O3and particulate matter, and precipitation measurements
of sulphate (SO24−) and nitrate (NO−3). The network includes 51 sites over East and
5
Southeast Asian countries that are classified as remote (20), rural (12), and urban (19). We use the rural sites, defined as being at between 20 and 50 km away from large pollution sources and 500 m away from heavy traffic roads, to evaluate model long-range transport of sulphur-containing compounds. We chose to report the total sulphur (ppbv) rather than to test the model skill at partitioning between SO2and SO
2−
4 .
10
2.3 Satellite observations of aerosol optical depth
We use aerosol optical depth (AOD) observations from the NASA Moderate Resolu-tion Imaging Spectroradiometer (MODIS) aboard the Aqua EOS satellite, which was launched in 2002 into a sun-synchronous orbit with an equatorial local overpass time of 01:30 p.m. local. MODIS provides near-global daily retrievals of AOD in cloud-free
15
and glint-free conditions using independent algorithms over land (Levy et al., 2007a, b) and ocean (Levy et al., 2003; Remer et al., 2005; Tanre et al., 1997). Over ocean, MODIS aerosol retrievals use a look-up table approach in which a combination of one fine and one coarse lognormal aerosol mode is chosen based on the best least-square fit of the computed spectral reflectance to the MODIS-observed spectral reflectance.
20
Over land, the retrieval uses a combination of multi-modal models, one dominated by fine mode (but containing both fine and coarse modes) and one dominated by coarse mode (but containing two modes). Over ocean, AOD products are provided at seven channels (470, 550, 660, 870, 1240, 1630, and 2130 nm), and over land AOD products are provided at four channels (470, 550, 660, and 2130 nm).
25
ACPD
11, 22033–22073, 2011Southeast Asian aerosol composition
W. Trivitayanurak et al.
Title Page
Abstract Introduction
Conclusions References
Tables Figures
◭ ◮
◭ ◮
Back Close
Full Screen / Esc
Printer-friendly Version Interactive Discussion
Discussion
P
a
per
|
Dis
cussion
P
a
per
|
Discussion
P
a
per
|
Discussio
n
P
a
per
the broader Southeast Asian region, we use the MODIS L3 daily gridded joint land and ocean AOD product at 550 nm from the Collection 5 MODIS algorithm products, which has an estimated uncertainty of±0.05±0.15τover land (Levy et al., 2010) and ±0.03±0.05τ over ocean (Remer et al., 2005). The L3 product includes the number of pixels used to calculate the daily mean 1◦×1◦AOD product, which we use to screen
5
out scenes where less than six measurements are used. We also use the fine-mode scaling factor provided as standard by the MODIS team that yields the fine-mode AOD,
τf, from the total AOD. MODIS AOD tends to be biased high in cloudy regions such as Borneo; thin cirrus clouds can artifically increase AOD by ≃0.02 (L. Remer, per-sonal communication, NASA, 2011) and the AOD over Southeast Asia islands remains
10
unvalidated against the Aerosol Robotic Network (AERONET) (Levy et al., 2010).
3 Description of the nested GEOS-Chem chemistry transport model
We use the GEOS-Chem chemistry transport model (v8-02-01, http://www.geos-chem. org), driven by analyzed meteorological fields from the NASA Global Modeling and As-similation Office (GMAO) Global Earth Observing System (GEOS) model, to interpret
15
ground-based, aircraft, and satellite observations of trace gases and aerosols during 2008. Here we use GEOS-5 meteorological fields with 47 vertical layers and a temporal resolution of 6 h for meteorology and 3 h for surface quantities including mixing depths. The simulation includes a description of NOx-Ox-hydrocarbon-aerosol chemistry. The model is initialized with an 11-month global full-chemistry simulation at a horizontal
20
resolution of 4◦latitude by 5◦longitude. For subsequent global model calculations over the period 1 December 2007 to 1 January 2009 we use a horizontal resolution of 2◦ latitude by 2.5◦longitude. For our regional one-way nested, model calculations during
June–July 2008 we use the native GEOS-5 horizontal resolution 0.5◦latitude by 0.67◦ longitude over a China-Southeast Asia domain described by 70–150◦E and−10–55◦N.
25
Boundary conditions for this calculations are taken from the 4◦ latitude by 5◦ longitude
ACPD
11, 22033–22073, 2011Southeast Asian aerosol composition
W. Trivitayanurak et al.
Title Page
Abstract Introduction
Conclusions References
Tables Figures
◭ ◮
◭ ◮
Back Close
Full Screen / Esc
Printer-friendly Version Interactive Discussion
Discussion
P
a
per
|
Dis
cussion
P
a
per
|
Discussion
P
a
per
|
Discussio
n
P
a
per
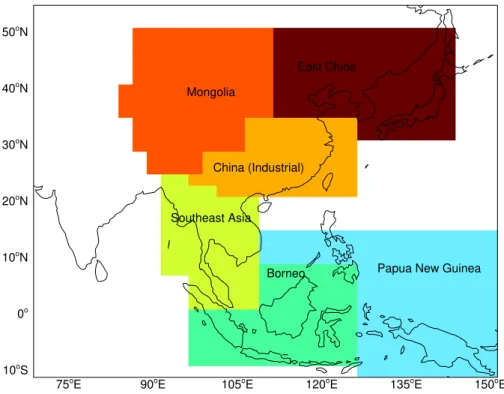
|
and Chen et al. (2009). Figure 1 describes the source regions over which we track individual contributions to AOD. We found that our results for Borneo were similar to that of the closest neighbouring regions. Consequently, we decided to lump them to-gether for the model calculations so that from hereinafter Borneo is defined as Borneo Island plus the closest neighbouring Indonesian islands Sumatra, Java, Sulawesi, and
5
the Lesser Sunda Islands.
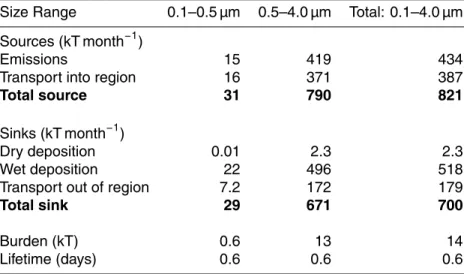
Table 2 shows our estimated emissions of sulphate, organic carbon (OC), black car-bon (BC), sea salt, dust, and biogenic precursors to SOA (Alexander et al., 2005; Fairlie et al., 2010; Henze and Seinfeld, 2006; Park et al., 2003, 2004). For sea salt, we distin-guish between an accumulation mode (dry radius 0.1–0.5 microns) and a coarse mode
10
(dry radius 0.5–4 microns) (Jaegl ´e et al., 2011). Similarly, we describe dust using four size ranges with effective radii of 0.7, 1.5, 2.5, and 4 microns, respectively. For radiative transfer calculations, dust is segregated into 7 size bins, but for atmospheric transport and deposition calculations dust in the first four size bins, covering 0.01–1 µm, are lumped together. The remaining aerosol types are treated as bulk mass.
15
We use sulphur emissions based on the Global Emissions Inventory Activity (GEIA) for 1985 with updated national emission inventories and fuel use data (Bey et al., 2001b; Park et al., 2004). We use more recent inventories for Asia (Streets et al., 2003, 2006), Europe (http://www.emep.int), the United States (http://www.epa.gov/ttn/ chief/net/1999inventory.html), Mexico (Kuhns et al., 2005), and Canada (http://www.ec.
20
gc.ca/pdb/cac/). We assume that anthropogenic sulphur is emitted primarily as SO2,
with only a small fraction as sulphate (5 % in Europe, 1.4 % North America, and 3 % elsewhere, Chin et al., 2000).
We include carbonaceous emissions from fossil fuel and biofuel combustion (Bond et al., 2004), biomass burning (van der Werf et al., 2006), and SOA precursors from
25
ACPD
11, 22033–22073, 2011Southeast Asian aerosol composition
W. Trivitayanurak et al.
Title Page
Abstract Introduction
Conclusions References
Tables Figures
◭ ◮
◭ ◮
Back Close
Full Screen / Esc
Printer-friendly Version Interactive Discussion
Discussion
P
a
per
|
Dis
cussion
P
a
per
|
Discussion
P
a
per
|
Discussio
n
P
a
per
myrcene, sabinene, 3-carene and ocimene), using the parameterized canopy envi-ronment emission activity (PCEEA) algorithm (Sakulyanontvittya et al., 2008). The emissions,E, of these compounds are parameterized by:
E=E0×γCE×γAge×γSM×ρenv, (1)
whereE0 are the basal emissions (µg of compound m−2h−1) normalized to standard
5
conditions, which are multiplied by emission activity factors that simulate changes in the emission rate owing to the changes in the canopy environment (γCE), leaf age (γAge), and soil moisture (γSM). In this study we neglect the effect of soil moisture (γSM=1). We assume standard conditions for production and loss of the BVOC within the canopy, represented by the normalized ratioρenv, by settingρenv=1.
10
The basal MEGAN emission factors are regridded from a default 0.5◦×0.5◦ grid to the GEOS-Chem horizontal resolutions and driven by 3-hourly surface air temperatures (at 2 m height), and by diffuse and direct PAR from the GEOS-5 analyses. To simulate changes in vegetation we use monthly mean MODIS observations of leaf-area index (LAI, vC5) gridded at 0.25◦×0.25◦(Myneni et al, 2007). The average LAI for vegetated
15
areas within each grid cell, LAIv, is estimated by dividing the LAI by the fraction of the cell covered by vegetation following the approach of Guenther et al. (2006) and M ¨uller et al. (2008). These monthly LAIv fields are then re-mapped to the GEOS-Chem grid
(Barkley et al., 2011). Simulation years outside 2000–2008 use a climatology based on the available MODIS observations. SOA chemistry is calculated using experimental
20
aerosol yield parameters fitted to the two-product model (Chung and Seinfeld, 2002) and partitioned onto the existing organic aerosol, following the SOA implementation in the GISS GCM (Chung and Seinfeld, 2002 and references therein; Henze and Seinfeld, 2006). Table 2 summarizes the monthly mean emissions of each aerosol and aerosol precursor for 2008.
25
We calculate optical depths that directly feed into the photolysis rate calculation used by the NOx-Ox-hydrocarbon chemistry. We use the updated aerosol physical and
ACPD
11, 22033–22073, 2011Southeast Asian aerosol composition
W. Trivitayanurak et al.
Title Page
Abstract Introduction
Conclusions References
Tables Figures
◭ ◮
◭ ◮
Back Close
Full Screen / Esc
Printer-friendly Version Interactive Discussion
Discussion
P
a
per
|
Dis
cussion
P
a
per
|
Discussion
P
a
per
|
Discussio
n
P
a
per
|
http://www.geos-chem.org). The update incorporates improvement in the size distri-bution of sulphate, OC, BC (Drury et al., 2010) and sea salt Jaegl ´e et al. (2011). We calculate AODτusing the following relation (Tegen and Lacis, 1996):
τ=3
4
QextM
reffρ =αM, (2)
whereQextis Mie scattering extinction efficiency factor, M is the column mass loading
5
(g m−2), ρ is the aerosol density (g m−3), r
eff is the effective radius (m), and α is the aerosol mass extinction (m2g−1). BC has the strongest extinction at low RH, with the more hygroscopic species having more influence at RH values larger than 50 % (not shown). Coarse dust, despite its lower α values than other accumulation-mode aerosols, has a stronger extinction per particle because it has a mass-per-particle that
10
is three orders of magnitude bigger than other accumulation-mode aerosols. For our analysis of AOD we account for contributions from individual sources (BC, OC, dust, and sea salt) and from geographical regions shown by Fig. 1.
4 GEOS-Chem model budget and model comparison against measurements In this section we present a budget and an evaluation of the control model configuration;
15
we also discuss how sensitive our results are to realistic changes in our underlying assumptions.
4.1 Model aerosol budget over Borneo
Tables 3, 4, 5, and 6 summarize the budget of carbonaceous aerosols and trace gas precursors, sulphur species, sea salt and dust, respectively, over Borneo (Fig. 1) during
20
ACPD
11, 22033–22073, 2011Southeast Asian aerosol composition
W. Trivitayanurak et al.
Title Page
Abstract Introduction
Conclusions References
Tables Figures
◭ ◮
◭ ◮
Back Close
Full Screen / Esc
Printer-friendly Version Interactive Discussion
Discussion
P
a
per
|
Dis
cussion
P
a
per
|
Discussion
P
a
per
|
Discussio
n
P
a
per
organic aerosol (43 %), SOA (10 %), BC (7 %), sea salt (6 %), and dust (11 %). We use a “tagged” CO simulation (not shown), for which the OH is fixed and taken from a full-chemistry simulation, to provide the origin and age of airmasses sampled over Borneo. A description of the tagged CO simulation can found in Bey et al. (2001a) and Gonzi and Palmer (2010). Here, we use CO as a proxy for OA from fossil fuel and biomass
5
combustion, acknowledging this approach will generally overestimate the influence of long-range transport on the regional budget. We find that fossil fuel emissions from Bor-neo represent 26 % of the local budget, with 19 % originating from Java and Sulawesi islands, 13 % from East Asia, 8 % from South Asia, 7 % from continental Southeast Asia and Sumatra, with the remainder from long-range transport. For biomass
burn-10
ing, local emissions contribute 41 %, while long-range transport from Africa, Australia, and South America contribute 19 %, 18 %, and 6 %, respectively.
We find that Borneo for the June/July period is a net exporter of carbonaceous aerosol (Tables 3, 4), with only approximately 10 % of this aerosol and trace gas pre-cursors from incoming air masses. The predominant winds for this period originate
15
largely from the tropical Pacific so that downwind regions include continental South-east Asian countries and the southSouth-eastern coast of China. We find that only 13 % of secondary organic gas, produced via volatile organic compound oxidation, is able to partition and remain in the aerosol phase to form SOA (Table 4). Over the study region, our calculations show that SOA contributes approximately 23.5 % to total OA.
20
ACPD
11, 22033–22073, 2011Southeast Asian aerosol composition
W. Trivitayanurak et al.
Title Page
Abstract Introduction
Conclusions References
Tables Figures
◭ ◮
◭ ◮
Back Close
Full Screen / Esc
Printer-friendly Version Interactive Discussion
Discussion
P
a
per
|
Dis
cussion
P
a
per
|
Discussion
P
a
per
|
Discussio
n
P
a
per
|
Table 5 shows that sulphate over Borneo is mainly from aqueous-phase oxidation (68 %), with smaller contributions from gas-phase oxidation (15 %) and advection into the region (14 %). Regional SO4is almost entirely deposited within the region (76 %);
this agrees with the OP3 aircraft observations during June/July 2008 (Robinson et al., 2011a), which observe depleted sulphate aerosol loading as the airmass travels across
5
the region. The resulting atmospheric lifetime, determined mainly by loss due to wet deposition, is 0.5 days. The contribution from dimethysulfide (DMS) is small despite the proximity of potential ocean sources, in agreement with measurements (J. Hopkins, personal communication, University of York, UK, 2010).
Table 6 shows that sea salt aerosol over Borneo originates in equal measure from
10
local emissions within the study region and from airmasses advected into the regions. The budget also indicates that sea salt mostly wet deposits within the local region. The model atmospheric lifetime for sea salt in accumulation and coarse modes is approxi-mately 0.6 days. With no local dust emission sources, long-range transport is the only source of dust that represents a few percent to the AOD (not shown).
15
4.2 Comparison of model and aircraft and satellite observations 4.2.1 Concentration profiles
We use aircraft measurements of key trace gases and aerosols from the ACES/OP3 experiment (Sect. 2) to test model vertical gradients of key trace gases and aerosols. We sample the model along the flight tracks and average the model and measurements
20
in a consistent manner. We anticipate that these data are representative of regional emissions that can be captured by the global 3-D model.
Figure 2 shows that the model vertical distributions of organics, SO4, isoprene, and the sum of methyl vinyl ketone (MVK) and methacrolein (MACR) reproduce the ob-served sharp vertical gradient around 900 hPa. We generally find that model
concen-25
ACPD
11, 22033–22073, 2011Southeast Asian aerosol composition
W. Trivitayanurak et al.
Title Page
Abstract Introduction
Conclusions References
Tables Figures
◭ ◮
◭ ◮
Back Close
Full Screen / Esc
Printer-friendly Version Interactive Discussion
Discussion
P
a
per
|
Dis
cussion
P
a
per
|
Discussion
P
a
per
|
Discussio
n
P
a
per
from aircraft (Robinson et al., 2011a), and/or reflect the comparison between point measurements and an average over the 0.5◦×0.67◦model grid cell.
Model CO concentrations agree with observations with a positive bias of typically 20–30 % in the boundary layer and of 5–10 % in the free troposphere; the model also captures the maxima between 700 and 800 hPa, which represents regional and
long-5
range transport of biomass burning pollution. We find that CO in the boundary layer and free troposphere are largely from local biomass burning and long-range trans-port, respectively. Good agreement in the free troposphere provides some confidence in the GEOS-5 meteorological analyses. The large positive model bias of CO in the boundary layer suggest a gross overestimation of local combustion sources; this bias
10
is also shown in the model organics. In contrast, model SO4has a negative bias in the boundary layer and a large negative bias in the free troposphere, consequently miss-ing the observed peak between 700–800 hPa which may be due to pollutant transport from upwind anthropogenic and/or marine sources; previous studies have highlighted the high-sulphur content of biomass burning fuel over the study region (Duncan et al.
15
(2003) and references therein). We find a similar negative model bias (−35 %) in re-producing surface measurements of total sulphur from the EANET surface network (not shown) but find that the model reproduces more than 50 % of the observed vari-ability (r=0.74,n=152). There is evidence for the SO4peak between 700–800 hPa,
during flights over East Sabah, originating from the marine boundary layer (Robinson
20
et al., 2011a); we examine the importance of DMS in the sensitivity calculations be-low. Model isoprene and its oxidation products MVK+MACR show a positive bias below 900 hPa (≃2 ppbv) and a faster-than-observed fall-off with altitude, which may suggest model error in boundary layer mixing or radical chemistry. Overprediction of near-surface isoprene concentrations agrees with previous work (Langford et al., 2010)
25
ACPD
11, 22033–22073, 2011Southeast Asian aerosol composition
W. Trivitayanurak et al.
Title Page
Abstract Introduction
Conclusions References
Tables Figures
◭ ◮
◭ ◮
Back Close
Full Screen / Esc
Printer-friendly Version Interactive Discussion
Discussion
P
a
per
|
Dis
cussion
P
a
per
|
Discussion
P
a
per
|
Discussio
n
P
a
per
|
700–800 hPa; Robinson et al. (2011a) describes this air layer during flights over East Sabah to be composed of lofted marine-origin air with organic aerosol that gradually takes up BSOA en route across the Northern tip of Borneo. Tracers of biomass burning were not significantly elevated during the ACES/OP3 flights, however the 700–800 hPa free tropospheric layer could be influenced by long-range transport of combustion
pol-5
lution at other times. Below in the sensitivity calculations, we investigate further the role of regional and long-range transport of biomass burning emissions over Borneo.
4.2.2 Aerosol optical depth and aerosol extinction profiles
Space-borne observations of aerosol optical properties provide an opportunity to relate the aircraft campaign to broader temporal and spatial scales. We focus our analysis on
10
NASA MODIS data (Sect. 2); other analyses using data from the Cloud-Aerosol Lidar and Infrared Pathfinder Satellite Observation (CALIPSO), not shown, showed similar results but the observed aerosol extinction coefficient has not been validated at the time of writing.
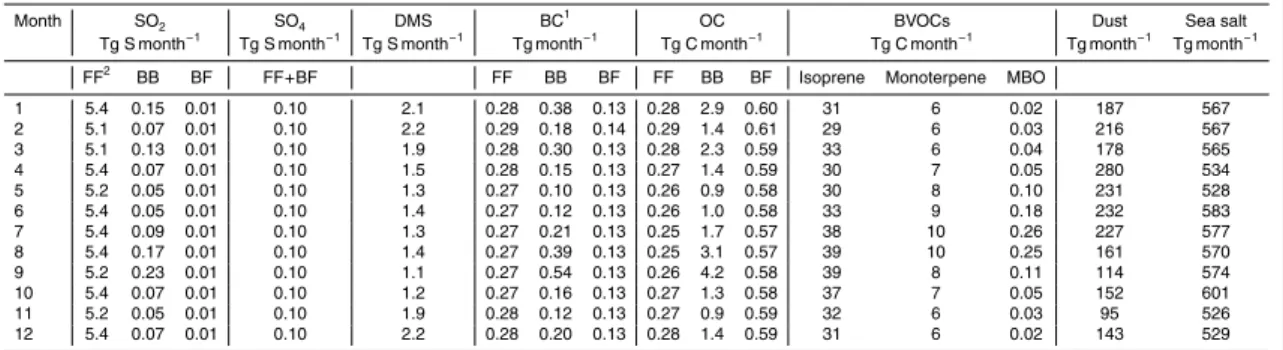
Figure 3 compares MODIS and model AOD at 550 nm over Southeast Asia for July
15
2008. We sample the model at the location of each Level 2 mean scene and regrid the data onto the 0.5◦×0.67◦ nested grid. The model generally has a negative bias of 51 % over ocean, reflecting the percentage difference of smaller values in the model. The model has a negative bias of 56 % over Borneo, consistent with the aircraft data. Figure 3 also shows the percentage contributions of the AOD from SO4, BC, OC, salt
20
(accumulation and coarse modes), and dust. Over Borneo the largest contribution is from OC originating from biomass burning on the Northwest of the Island. These emissions are determined in part by active firecount measurements from the MODIS instrument (Fig. 4) which show extensive burning over Borneo including over the north-ern tip close to the measurement campaign, and on the upwind islands of Sumatra
25
ACPD
11, 22033–22073, 2011Southeast Asian aerosol composition
W. Trivitayanurak et al.
Title Page
Abstract Introduction
Conclusions References
Tables Figures
◭ ◮
◭ ◮
Back Close
Full Screen / Esc
Printer-friendly Version Interactive Discussion
Discussion
P
a
per
|
Dis
cussion
P
a
per
|
Discussion
P
a
per
|
Discussio
n
P
a
per
to a smaller extent from upwind sulphur-rich Guinea emissions. Our model only shows a few percent of the AOD is from sea salt and BC.
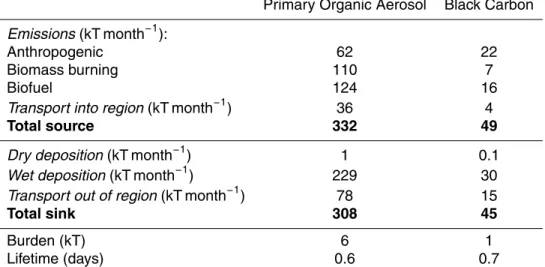
To investigate the transport pathways of the aerosols that contribute to the AOD, we report the aerosol extinction profiles that correspond to the model AODs. Figure 5 shows the total model vertical aerosol extinction associated with the total column
opti-5
cal depth and its contributions from SO4, BC, OC, sea salt (accumulation and coarse
modes), and dust. The largest values of aerosol extinction are in the boundary layer close to their sources emissions, as expected. We find that boundary layer values are determined largely by OC from primary and secondary sources. Perhaps, more in-teresting is the large percentage contributions of OC in the free troposphere which we
10
have related to long-range transport of incomplete combustion supported by coincident elevated CO concentrations. These long-range transport events occur with a frequency on the order of two weeks. Unfortunately, the aircraft flights, denoted by black squares on the top of Fig. 5, did not coincide with these transport events. There are also a large percentage contribution from SO4in the free troposphere but only on days when AOD
15
is relatively low. Sea salt is a small, diffuse source of aerosol extinction, while dust contributes only small absolute values.
Figure 6 shows timeseries of MODIS and model AOD for different geographical re-gions during 2008. We also show the speciated contributions to each timeseries. First, we regrid the daily mean 1◦
×1◦Level 3 MODIS data onto the model horizontal
resolu-20
tion of 2◦×2.5◦ for comparison, accounting for the number of observations included in each daily average, as described above, and average the comparison over 10-day pe-riods over the region. MODIS AOD over Borneo is typically<0.4, peaking at 0.4 during February due to a transport pattern from the China region that affects the Southeast Asian region. Model AOD has a 76 % negative bias over the year and reproduces only
25
ACPD
11, 22033–22073, 2011Southeast Asian aerosol composition
W. Trivitayanurak et al.
Title Page
Abstract Introduction
Conclusions References
Tables Figures
◭ ◮
◭ ◮
Back Close
Full Screen / Esc
Printer-friendly Version Interactive Discussion
Discussion
P
a
per
|
Dis
cussion
P
a
per
|
Discussion
P
a
per
|
Discussio
n
P
a
per
|
for low AOD values (τ <0.15) due to surface reflectance issues (Levy et al., 2010), these uncertainties do not explain all the model bias. Agreement between the model and MODIS AOD over larger continental regions with Southeast Asia vary from large discrepancies for continental Southeast Asia (r=0.45, bias=−53 %), to small percent-age bias but low correlations for China Industrial (r=0.32, bias=12 %), to East China
5
where the bias is low and the correlation is high (r=0.82, bias=15 %). Agreement between model and observed AOD over the remote oceans (e.g. temperate Southern Ocean,−180–180◦E, 20–50◦S, is very good (r=0.75, bias=0.63 %) where AOD is determined mainly by changes in sea salt aerosol, but over oceans that include con-siderable continental outflow, e.g. the tropical Indian ocean where during some time of
10
the year continental outflow can represent more than 50 % of the AOD, the bias is high but the model describes the larger scale seasonal cycle (r=0.76, bias=−49 %).
4.3 Sensitivity calculations
It is clear from our model comparison with aircraft and satellite measurements that the model suffers from errors in surface emissions, and/or atmospheric chemistry and
15
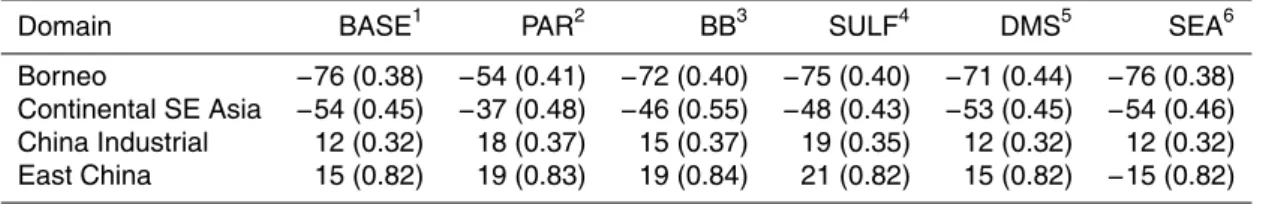
transport. We explore the robustness of our results to realistic changes in the under-lying assumptions we make in our control calculation. Table 7 reports the results from six sensitivity calculations.
4.3.1 Sensitivity to emissions
We showed above that the model underestimates the source of OC and BC for which
20
the main common source would be biomass burning. The uncertainty associated with biomass burning is large enough to permit a factor of two increase (e.g. Kopacz et al., 2010), which we use to test this source of error. Here we apply their upper limit in the BB calculation. Table 7 shows that this leads to very small improvements in reducing the bias or increasing the correlation.
ACPD
11, 22033–22073, 2011Southeast Asian aerosol composition
W. Trivitayanurak et al.
Title Page
Abstract Introduction
Conclusions References
Tables Figures
◭ ◮
◭ ◮
Back Close
Full Screen / Esc
Printer-friendly Version Interactive Discussion
Discussion
P
a
per
|
Dis
cussion
P
a
per
|
Discussion
P
a
per
|
Discussio
n
P
a
per
To investigate an error in sulphate aerosol, we independently adjust emissions from anthropogenic and natural sources. First we increased anthropogenic emissions of SO2 and SO4 by 40 % in the SULF calculation. The magnitude of this increase is
based on a) the 36 % negative model bias we found against the EANET surface obser-vations, and b) failure of GEOS-Chem to reproduce increased AOD over major cities
5
over Southeast Asia, such as Bangkok, for which fossil fuel combustion is the dominant sulphur source. Table 7 shows the 40 % increase in sulphur emissions results in small AOD changes that typically decrease the bias against MODIS.
MODIS AOD has a strong seasonal cycle over the remote Southern Ocean (40◦S– 60◦S), peaking in Austral Summer (December to February), reflecting changes in
phy-10
toplankton photosynthetic activity and resulting emissions of DMS, which the model does not reproduce (not shown). Model AOD is generally high throughout the year with a value similar to the observed seasonal peak, while the SO4 contribution is relatively
aseasonal, suggesting an error in the DMS emission and/or the sea salt emission pa-rameterization which is known to be poor at high winds. We scale the model DMS
15
emissions by using the monthly ratio between MODIS fine-mode AOD and model AOD contribution from sulphur over the Southern ocean remote from other aerosol sources. By increasing DMS concentration in the Southern Hemisphere at the cost of over pre-dicting AOD over the Southern Ocean, we find improvement in AOD over the tropical ocean regions more significantly than the improvement in other scenarios for the same
20
regions. We find that the increase in DMS worsens the AOD bias between MODIS and GEOS-Chem over the Southern Ocean (46 % to 83 %) but improves the description of the seasonal cycle. This result emphasizes the importance of including the seasonal cycle of DMS and improving the air-sea exchange parameterization.
4.3.2 Sensitivity to gas-phase partitioning to secondary organic aerosol
25
ACPD
11, 22033–22073, 2011Southeast Asian aerosol composition
W. Trivitayanurak et al.
Title Page
Abstract Introduction
Conclusions References
Tables Figures
◭ ◮
◭ ◮
Back Close
Full Screen / Esc
Printer-friendly Version Interactive Discussion
Discussion
P
a
per
|
Dis
cussion
P
a
per
|
Discussion
P
a
per
|
Discussio
n
P
a
per
|
partitioning coefficients of all SOA by a factor of 100, we account for subsequent gen-erations of oxidations that further lower their volatility. A similar factor was necessary to match model and observed organic aerosol over the Amazon basin (Hodzic et al., 2009).
Table 7 shows that for this calculation we see the largest increases over tropical
5
ecosystems, as expected, where the emissions of BVOCs and resulting production of SOA is largest. Increasing the partitioning uniformly increases the SOA formation and so does improve the model temporal variations. Model AOD over tropical South America (not shown) increased by 151 % resulting in reduced bias against MODIS from −64 % to −9 %, and model AOD over Borneo increase by 91 % resulting in a
10
reduction in bias from−76 % to −54 %. The larger change over the Amazon due to the enhanced partitioning reflects the larger contributions to AOD from BVOCs. The improvement over the tropical continents also results in better agreement in downwind regions such as the tropical Pacific Ocean. For some regions, the comparison against MODIS AOD gets worse, highlighting that a single change in partitioning is not ideal
15
for all environments.
4.3.3 Global impact of Southeast Asian BVOC emissions
To quantify the effect of BVOCs from Southeast Asia to the rest of the world, we in-crease the isoprene emission from Southeast Asia region (90–130◦E, −10–20◦N) by 20 % in the SEA simulation. The global effect of this regional increase in isoprene is
20
very small overall. The largest reduction of AOD bias occurs over Borneo from−77 % to−76 % while for other regions bias reduction is insignificant. Comparing predicted AOD in the SEA simulation to the BASE simulation, Borneo increases by 0.9 % while immediate neighboring regions increase by typically 0.3 %. The changes extend fur-thest to tropical Atlantic Ocean, East and West USA, South Africa and temperate South
25
ACPD
11, 22033–22073, 2011Southeast Asian aerosol composition
W. Trivitayanurak et al.
Title Page
Abstract Introduction
Conclusions References
Tables Figures
◭ ◮
◭ ◮
Back Close
Full Screen / Esc
Printer-friendly Version Interactive Discussion
Discussion
P
a
per
|
Dis
cussion
P
a
per
|
Discussion
P
a
per
|
Discussio
n
P
a
per
at the ground site during ACES/OP3 (Robinson et al., 2011b) our result confirms that chamber yields do not represent atmospheric formation.
5 Conclusions
We used the nested-grid version of the GEOS-Chem global 3-D chemistry transport model to interpret aircraft, ground-based and space-borne measurements taken during
5
the ACES/OP3 measurement campaign over Malaysian Borneo during June–July 2008 to better understand the aerosol composition distribution and variation over Southeast Asia region. We used the model to relate the aircraft campaign measurement to larger spatial and temporal scales so we could examine the regional impact of biogenic sec-ondary organic aerosol.
10
Budget calculations for the model total column aerosol budget over Borneo and the surrounding Indonesian islands during July 2008 show the dominance of sea salt (50 %), reflecting the island geography. If we exclude coarse sea salt and desert dust, the next largest contribution to the column aerosol budget is primary organic aerosol (43 %) with sulphate and secondary organic aerosol contribution 23 % and 10 %,
re-15
spectively. We find that this region is a net-exporter of carbonaceous aerosol, of which only 10 % derives from incoming air masses. The net contribution of primary OA, SOA, and BC from Borneo to downwind regions are 42 kT, 15 kT, and 11 kT, respectively. The SOA contribution represents only 23.5 % to the total organic aerosol despite the abundance of the BVOC precursors from the forest environment, mainly because only
20
a small fraction (13 %) of the produced secondary organic gas remains in the aerosol phase. Sulphate over the region, mainly produced in-cloud from local SO2emissions,
is largely removed by precipitation within the region.
The model and measured vertical profiles of aerosol and gas concentration have the highest concentration near the surface, as expected. Measured profiles display a
25
ACPD
11, 22033–22073, 2011Southeast Asian aerosol composition
W. Trivitayanurak et al.
Title Page
Abstract Introduction
Conclusions References
Tables Figures
◭ ◮
◭ ◮
Back Close
Full Screen / Esc
Printer-friendly Version Interactive Discussion
Discussion
P
a
per
|
Dis
cussion
P
a
per
|
Discussion
P
a
per
|
Discussio
n
P
a
per
|
studies have suggested a role for local convection (Robinson et al., 2011c). The model reproduces the CO concentrations profile in the FT but tends to have a positive bias in the lower troposphere, suggesting an overestimation of local burning emissions. In contrast, model sulphate concentrations have a negative bias in the FT suggest-ing an underestimation of long-range transport that is likely due to underestimation of
5
sulphur emissions in the region, consistent with the evaluation against total sulphur measurements from EANET surface network. The positive model bias of BVOC emis-sions together with model errors due to nocturnal boundary layer mixing and/or radical chemistry contribute to the positive bias of near-surface OA concentration.
Model time series of vertical profiles of aerosol extinction over Borneo during June–
10
July 2008 show the total AOD is determined by OA in the lowermost troposphere. This also shows that the FT is dominated by episodic long-range transport of burning emis-sions with coincidental elevated concentrations of CO and organic aerosol. This reaf-firms the importance of transported pollution overlaying the relatively pristine surface environment found over forested regions.
15
Over Borneo and surrounding Indonesian islands, a comparison of model and MODIS space-borne total column AOD measurements reveals that the model under-predicts by 76 % and captures only 14 % of the variability over the year 2008. The model attributes most of the AOD over this region to sulphate, OC and sea salt. Model AOD compares better over larger regions that are better characterized by a single
20
source, e.g. temperate southern ocean (mainly sea salt) and East China (mainly an-thropogenic sulphur). The reasons for a gross underprediction of AOD over Borneo is explored in sensitivity simulations. AOD values over Borneo are most sensitive to an increase in the organic gas-particle partitioning (22 % improvement against MODIS) while changes in emissions of biomass burning, anthropogenic sulphur, and DMS
re-25
ACPD
11, 22033–22073, 2011Southeast Asian aerosol composition
W. Trivitayanurak et al.
Title Page
Abstract Introduction
Conclusions References
Tables Figures
◭ ◮
◭ ◮
Back Close
Full Screen / Esc
Printer-friendly Version Interactive Discussion
Discussion
P
a
per
|
Dis
cussion
P
a
per
|
Discussion
P
a
per
|
Discussio
n
P
a
per
site during ACES/OP3. This stresses the importance of biogenic SOA on regional at-mospheric components and the need to improve its formation mechanism in the model together with the knowledge of precursor VOCs emissions and associated chemistry.
Acknowledgements. We thank the ACES/OP3 team for useful discussions throughout the study and the GEOS-Chem team for continued support of the model. We acknowledge Co-5
lette Heald, Randall Martin, and Lyatt Jaegl ´e for providing the updated aerosol physical and optical properties for the simulation. WT and PP were funded by the UK Natural Environmental Research Council (grant number NE/E011136/1).
References
Alexander, B., Park, R., Jacob, D. J., Li, Q., R. M. Yantosca, J. S., Lee, C. C. W., and Thiemens, 10
M. H.: Sulfate formation in sea-salt aerosols: constraints from oxygen isotopes, J. Geophys. Res., 110, D10307, doi:10.1029/2004JD005659, 2005. 22040
Barkley, M. P., Palmer, P. I., Ganzeveld, L., A. Arneth, D. H., Karl, T., Guenther, A., Paulot, F., Wennberg, P., Mao, J., Kurosu, T., Chance, K., M ¨uller, J.-F., Smedt, I. D., Roozendael, M. V., Chen, D., Wang, Y., and Yantosca, R.: Can a ’state of the art’ chemistry transport model really 15
simulate Amazonian tropospheric chemistry?, J. Geophys. Res., in press, 2011. 22041 Bey, I., Jacob, D. J., Logan, J. A., and Yantosca, R. M.: Asian chemical outflow to the
Pa-cific: Origins, pathways and budgets, J. Geophys. Res.-Atmos., 106(D19), 23097–23113, doi:10.1029/2001JD000806, 2001a. 22043
Bey, I., Jacob, D. J., Yantosca, R. M., Logan, J. A., Field, B. D., Fiore, A. M., Li, Q., Liu, H. 20
G. Y., Mickley, L. J., and Schultz, M. G.: Global modeling of tropospheric chemistry with assimilated meteorology: model description and evaluation, J. Geophys. Res., 106, 23073– 23095, 2001b. 22040
Bonan, G. B.: Forest and climate change: forcings, feedbacks, and the climate benefits of forests, Science, 320(5882), 1444–1449, doi:10.1126/science.1155121, 2008. 22035 25
Chandra, S., Ziemke, J. R., Bhartia, P. K., and Martin, R. V.: Tropical tropospheric ozone: Implications for dynamics and biomass burning, J. Geophys. Res., 107, 4188, doi:10.1029/2001JD000447, 2002. 22036
ACPD
11, 22033–22073, 2011Southeast Asian aerosol composition
W. Trivitayanurak et al.
Title Page
Abstract Introduction
Conclusions References
Tables Figures
◭ ◮
◭ ◮
Back Close
Full Screen / Esc
Printer-friendly Version Interactive Discussion
Discussion
P
a
per
|
Dis
cussion
P
a
per
|
Discussion
P
a
per
|
Discussio
n
P
a
per
|
CO pollution and export in China simulated by the high-resolution nested-grid GEOS-Chem model, Atmos. Chem. Phys., 9, 3825–3839, doi:10.5194/acp-9-3825-2009, 2009. 22040 Chin, M., Rood, R. B., Lin, S. J., Muller, J. F., and Thompson, A. M.: Atmospheric sulfure
cycle simulated in the global model GOCART: model description and global properties, J. Geophys. Res., 105, 24671–24687, 2000. 22040
5
Drury, E., Jacob, D., Spurr, R., Wang, J., Shinozuka, Y., Anderson, B., Clarke, A., Dibb, J., Mc-Naughton, C., and Weber, R.: Synthesis of satellite (MODIS), aircraft (ICARTT), and surface (IMPROVE, EPAAQS, AERONET) aerosol observations over eastern North America to im-prove MODIS aerosol retrievals and constrain surface aerosol concentrations and sources, J. Geophys. Res., 115, D14204, doi:10.1029/2009JD012629, 2010. 22042
10
Duncan, B. N., Bey, I., Chin, M., Mickley, L. J., Fairlie, T. D., Martin, R. V., and Matsueda, H.: Indonesian wildfires of 1997: Impact on tropospheric chemistry, J. Geophys. Res., 108, 4458, doi:10.1029/2002JD003195, 2003. 22036, 22045
Fairlie, T. D., Jacob, D. J., Dibb, J. E., Alexander, B., Avery, M. A., van Donkelaar, A., and Zhang, L.: Impact of mineral dust on nitrate, sulfate, and ozone in transpacific Asian pollution plumes, 15
Atmos. Chem. Phys., 10, 3999–4012, doi:10.5194/acp-10-3999-2010, 2010. 22040
Ferreira, J., Reeves, C. E., Murphy, J. G., Garcia-Carreras, L., Parker, D. J., and Oram, D. E.: Isoprene emissions modelling for West Africa: MEGAN model evaluation and sensitivity analysis, Atmos. Chem. Phys., 10, 8453–8467, doi:10.5194/acp-10-8453-2010, 2010. 22036 Fowler, D., Nemitz, E., Misztal, P., Carlo, C. D., Skiba, U., Ryder, J., Helfter, C., Cape, N., 20
Owen, S., Dorsey, J., Gallagher, M. W., Coyle, M., Phillips, G., Davison, D., Langford, B., MacKenzie, A. R., Muller, J., Siong, J., Pyle, J. A., and Hewitt, C. N.: Effects of land use on trace gas emissions and deposition in Borneo: comparing atmosphere-surface exchange over oil palm plantations with a rainforest, Philos. T. Roy. Soc. Lond., in press, 2011. 22035 Gerbig, C., Schmitgen, S., Kley, D., Volz-Thomas, A., Dewey, K., and Haaks, D.: An improved 25
fast-response vacuum-UV resonance fluorescence CO instrument, J. Geophys. Res., 104, 1699–1704, 1999. 22061
Gonzi, S. and Palmer, P. I.: Vertical transport of surface fire emissions observed from space, J. Geophys. Res., 115, D02306, doi:10.1029/2009JD012053, 2010. 22043
Griffin, R. J., Cocker III, D. R., Seinfeld, J. H., and Dabdub, D.: Estimate of global atmospheric 30
organic aerosol from oxidation of biogenic hydrocarbons, Geophys. Res. Lett., 26(17), 2721– 2724, doi:10.1029/1999GL900476, 1999. 22049
ACPD
11, 22033–22073, 2011Southeast Asian aerosol composition
W. Trivitayanurak et al.
Title Page
Abstract Introduction
Conclusions References
Tables Figures
◭ ◮
◭ ◮
Back Close
Full Screen / Esc
Printer-friendly Version Interactive Discussion
Discussion
P
a
per
|
Dis
cussion
P
a
per
|
Discussion
P
a
per
|
Discussio
n
P
a
per
of global terrestrial isoprene emissions using MEGAN (Model of Emissions of Gases and Aerosols from Nature), Atmos. Chem. Phys., 6, 3181–3210, doi:10.5194/acp-6-3181-2006, 2006. 22040, 22041
Hamilton, J. F., Rami Alfarra, M., Wyche, K. P., Ward, M. W., Lewis, A. C., McFiggans, G. B., Good, N., Monks, P. S., Carr, T., White, I. R., and Purvis, R. M.: Investigating the use 5
of secondary organic aerosol as seed particles in simulation chamber experiments, Atmos. Chem. Phys., 11, 5917–5929, doi:10.5194/acp-11-5917-2011, 2011. 22036
Henze, D. K. and Seinfeld, J. H.: Global secondary organic aerosol from isoprene oxidation, Geophys. Res. Lett., 33, L09812, doi:10.1029/2006GL025976, 2006. 22040
Hewitt, C. N., MacKenzie, A. R., Carlo, P. D., Dorsey, J. R., Evans, M., Fowler, D., Gallagher, 10
M. W., Helfter, C., Hopkinds, J., Jones, H., Langford, B., Lee, J. D., Lewis, A. C., Lim, S. F., di Marco, C., Misztal, P., Moller, S., Monks, P. S., Nemitz, E., Oram, D. E., Owen, S. M., Phillips, G., Pugh, T., Pyle, J. A., Reeves, C. E., Ryder, J., Siong, J., Skiba, U., Stewart, D. J., and Thomas, R.: Nitrogen management is essential to prevent tropical oil palm plantations from causing ozone pollution, P. Natl. Acad. Sci., 106, 18447–18451, 2009. 22035
15
Hewitt, C. N., Lee, J. D., MacKenzie, A. R., Barkley, M. P., Carslaw, N., Carver, G. D., Chappell, N. A., Coe, H., Collier, C., Commane, R., Davies, F., Davison, B., DiCarlo, P., Di Marco, C. F., Dorsey, J. R., Edwards, P. M., Evans, M. J., Fowler, D., Furneaux, K. L., Gallagher, M., Guenther, A., Heard, D. E., Helfter, C., Hopkins, J., Ingham, T., Irwin, M., Jones, C., Karunaharan, A., Langford, B., Lewis, A. C., Lim, S. F., MacDonald, S. M., Mahajan, A. 20
S., Malpass, S., McFiggans, G., Mills, G., Misztal, P., Moller, S., Monks, P. S., Nemitz, E., Nicolas-Perea, V., Oetjen, H., Oram, D. E., Palmer, P. I., Phillips, G. J., Pike, R., Plane, J. M. C., Pugh, T., Pyle, J. A., Reeves, C. E., Robinson, N. H., Stewart, D., Stone, D., Whalley, L. K., and Yin, X.: Overview: oxidant and particle photochemical processes above a south-east Asian tropical rainforest (the OP3 project): introduction, rationale, location characteristics 25
and tools, Atmos. Chem. Phys., 10, 169–199, doi:10.5194/acp-10-169-2010, 2010. 22035, 22037
Jaegl ´e, L., Quinn, P. K., Bates, T. S., Alexander, B., and Lin, J.-T.: Global distribution of sea salt aerosols: new constraints from in situ and remote sensing observations, Atmos. Chem. Phys., 11, 3137–3157, doi:10.5194/acp-11-3137-2011, 2011. 22040, 22042
30
ACPD
11, 22033–22073, 2011Southeast Asian aerosol composition
W. Trivitayanurak et al.
Title Page
Abstract Introduction
Conclusions References
Tables Figures
◭ ◮
◭ ◮
Back Close
Full Screen / Esc
Printer-friendly Version Interactive Discussion
Discussion
P
a
per
|
Dis
cussion
P
a
per
|
Discussion
P
a
per
|
Discussio
n
P
a
per
|
C., Sun, Y. L., Tian, J., Laaksonen, A., Raatikainen, T., Rautiainen, J., Vaattovaara, P., Ehn, M., Kulmala, M., Tomlinson, J. M., Collins, D. R., Cubison, M. J., Dunlea, E. J., Huffman, J. A., Onasch, T. B., Alfarra, M. R., Williams, P. I., Bower, K., Kondo, Y., Schneider, J., Drewnick, F., Borrmann, S., Weimer, S., Demerjian, K., Salcedo, D., Cottrell, L., Griffin, R., Takami, A., Miyoshi, T., Hatakeyama, S., Shimono, A., Sun, J. Y., Zhang, Y. M., Dzepina, K., Kimmel, 5
J. R., Sueper, D., Jayne, J. T., Herndon, S. C., Trimborn, A. M., Williams, L. R., Wood, E. C., Middlebrook, A. M., Kolb, C. E., Baltensperger, U., and Worsnop, D. R.: Evolution of Organic Aerosols in the Atmosphere, Science, 326, 1525–1529, 2009. 22043
Karl, T., Harley, P., Emmons, L., Thornton, B., Guenther, A., Basu, C., Turnipseed, A., and Jardine, K.: Efficient Atmospheric Cleansing of Oxidized Organic Trace Gases by Vegetation, 10
Science, 330, 816–819, doi:10.1126/science.1192534, 2010. 22035
Kopacz, M., Jacob, D. J., Fisher, J. A., Logan, J. A., Zhang, L., Megretskaia, I. A., Yantosca, R. M., Singh, K., Henze, D. K., Burrows, J. P., Buchwitz, M., Khlystova, I., McMillan, W. W., Gille, J. C., Edwards, D. P., Eldering, A., Thouret, V., and Nedelec, P.: Global esti-mates of CO sources with high resolution by adjoint inversion of multiple satellite datasets 15
(MOPITT, AIRS, SCIAMACHY, TES), Atmos. Chem. Phys., 10, 855–876, doi:10.5194/acp-10-855-2010, 2010. 22048
Kuhns, H., Knipping, E. M., and Vukovich, J. M.: Development of United States-Mexico emis-sions inventory for the Big Bend Regional Aerosol and Visiting Observational (BRAVE) Study, J. Waste Manage. Assoc., 55, 677–692, 2005. 22040
20
Kulshrestha, U., Jain, M., Sekar, R., Vairamani, M., Sarkar, A., and Parashar, D.: Chemical characteristics and source apportionment of aerosols over Indian Ocean during INDOEX-1999, Current Science, 80, 180–185, 2001. 22036
Langford, B., Misztal, P. K., Nemitz, E., Davison, B., Helfter, C., Pugh, T. A. M., MacKenzie, A. R., Lim, S. F., and Hewitt, C. N.: Fluxes and concentrations of volatile organic com-25
pounds from a South-East Asian tropical rainforest, Atmos. Chem. Phys., 10, 8391–8412, doi:10.5194/acp-10-8391-2010, 2010. 22036, 22045
Lelieveld, J., Butler, T. M., Crowley, J. N., Dillon, T. J., Fischer, H., Ganzeveld, L., Harder, H., Lawrence, M. G., Martinez, M., Taraborelli, D., and Williams, J.: Atmospheric oxidation capacity sustained by a tropical forest, Nature, 452, 737–740, 2008. 22035, 22036
30
ACPD
11, 22033–22073, 2011Southeast Asian aerosol composition
W. Trivitayanurak et al.
Title Page
Abstract Introduction
Conclusions References
Tables Figures
◭ ◮
◭ ◮
Back Close
Full Screen / Esc
Printer-friendly Version Interactive Discussion
Discussion
P
a
per
|
Dis
cussion
P
a
per
|
Discussion
P
a
per
|
Discussio
n
P
a
per
Lewis, S. L., Mahli, Y., and Phillips, O. L.: Fingerprinting the impacts of global change on tropical forests, Philos. T. Roy. Soc. Lond. B, 359, 437–462, 2004. 22035
MacKenzie, A. R., Langford, B., Pugh, T. A. M., Robinson, N., Misztal, P. K., Heard, D. E., Lee, J. D., Lewis, A. C., Jones, C. E., Hopkins, J. R., Philips, G., Monks, P. S., Karunaharan, A., Hornsby, K. E., Nicholas-Perea, V., Coe, H., Whalley, L. K., Edwards, P. M., Evans, M. J., 5
Stone, D., Ingham, T., Commane, R., Furneaux, K. L., McQuaid, J., Nemitz, E., Seng, Y. K., Fowler, D., Pyle, J. A., and Hewitt, C. N.: The atmospheric chemistry of trace gases and particulate matter emitted by different land uses in Borneo, Philos. Trans. Roy. Soc. Lond., in press, 2011. 22035
Marticorena, B., Haywood, J., Coe, H., Formenti, P., Liousse, C., Mallet, M., and Pelon, J.: 10
Tropospheric aerosols over West Africa: highlights from the AMMA international program, Atmos. Sci. Lett., 12, 19–23, 2011. 22036
Martin, S. T., Andreae, M. O., Althausen, D., Artaxo, P., Baars, H., Borrmann, S., Chen, Q., Farmer, D. K., Guenther, A., Gunthe, S. S., Jimenez, J. L., Karl, T., Longo, K., Manzi, A., M ¨uller, T., Pauliquevis, T., Petters, M. D., Prenni, A. J., P ¨oschl, U., Rizzo, L. V., Schneider, 15
J., Smith, J. N., Swietlicki, E., Tota, J., Wang, J., Wiedensohler, A., and Zorn, S. R.: An overview of the Amazonian Aerosol Characterization Experiment 2008 (AMAZE-08), Atmos. Chem. Phys., 10, 11415–11438, doi:10.5194/acp-10-11415-2010, 2010a. 22036
Martin, S. T., Andreae, M. O., Artaxo, P., Baumgardner, D., Chen, Q., Goldstein, A. H., Guen-ther, A., Heald, C. L., Mayol-Bracero, O. L., McMurry, P. H., Pauliquevis, T., Poeschl, U., 20
Prather, K. A., Roberts, G. C., Saleska, S. R., Silva Dias, M. A., Spracklen, D. V., Swietlicki, E., and Trebs, I.: Sources and properties of Amazonian aerosol particles, Rev. Geophys., 48, 2010b. 22035
Misztal, P. K., Owen, S. M., Guenther, A. B., Rasmussen, R., Geron, C., Harley, P., Phillips, G. J., Ryan, A., Edwards, D. P., Hewitt, C. N., Nemitz, E., Siong, J., Heal, M. R., and Cape, J. 25
N.: Large estragole fluxes from oil palms in Borneo, Atmos. Chem. Phys., 10, 4343–4358, doi:10.5194/acp-10-4343-2010, 2010. 22036
Morgan, W. T., Allan, J. D., Bower, K. N., Highwood, E. J., Liu, D., McMeeking, G. R., Northway, M. J., Williams, P. I., Krejci, R., and Coe, H.: Airborne measurements of the spatial distri-bution of aerosol chemical composition across Europe and evolution of the organic fraction, 30
Atmos. Chem. Phys., 10, 4065–4083, doi:10.5194/acp-10-4065-2010, 2010. 22061
esti-ACPD
11, 22033–22073, 2011Southeast Asian aerosol composition
W. Trivitayanurak et al.
Title Page
Abstract Introduction
Conclusions References
Tables Figures
◭ ◮
◭ ◮
Back Close
Full Screen / Esc
Printer-friendly Version Interactive Discussion
Discussion
P
a
per
|
Dis
cussion
P
a
per
|
Discussion
P
a
per
|
Discussio
n
P
a
per
|
mated using MEGAN, ECMWF analyses and a detailed canopy environment model, Atmos. Chem. Phys., 8, 1329–1341, doi:10.5194/acp-8-1329-2008, 2008. 22041
Murphy, J. G., Oram, D. E., and Reeves, C. E.: Measurements of volatile organic compounds over West Africa, Atmos. Chem. Phys., 10, 5281–5294, doi:10.5194/acp-10-5281-2010, 2010. 22061
5
Myneni, R. B., Yang, W., Nemani, R. R., Huete, A. R., Dickinson, R. E., Knyazikhin, Y., Didan, K., Fu, R., Juarez, R. I. N., Saatchi, S. S., Hashimoto, H., Ichii, K., Shabanov, N. V., Tan, B., Ratana, P., Privette, J. L., Morisette, J. T., Vermote, E. F., Roy, D. P., Wolfe, R. E., Friedl, M. A., Running, S. W., Votava, P., El-Saleous, N., Devadiga, S., Su, Y., and Salomonson, V. V.: Large seasonal swings in leaf area of Amazon rainforests, P. Natl. Acad. Sci., 104, 10
4820–4823, 2007. 22041
Park, R. J., Jacob, D. J., Chin, M., and Martin, R. V.: Sources of carbonaceous aerosols over the United States and implications for natural visibility, J. Geophys. Res., 108, 4355, doi:10.1029/2002JD003190, 2003. 22040
Park, R. J., Jacob, D. J., Field, B. D., Yantosca, R. M., and Chin, M.: Natural and transboundary 15
pollution influences on sulfate-nitrate-ammonium aerosols in the United States: implications for policy?, J. Geophys. Res., 109, D15204, doi:10.1029/2003JD004473, 2004. 22040 Pearson, G., Davies, F., and Collier, C.: Remote sensing of the tropical rain forest boundary
layer using pulsed Doppler lidar, Atmos. Chem. Phys., 10, 5891–5901, doi:10.5194/acp-10-5891-2010, 2010. 22036
20
Pike, R. C., Lee, J. D., Young, P. J., Carver, G. D., Yang, X., Warwick, N., Moller, S., Misztal, P., Langford, B., Stewart, D., Reeves, C. E., Hewitt, C. N., and Pyle, J. A.: NOx and O3 above a tropical rainforest: an analysis with a global and box model, Atmos. Chem. Phys., 10, 10607–10620, doi:10.5194/acp-10-10607-2010, 2010. 22036
Pugh, T. A. M., MacKenzie, A. R., Hewitt, C. N., Langford, B., Edwards, P. M., Furneaux, K. 25
L., Heard, D. E., Hopkins, J. R., Jones, C. E., Karunaharan, A., Lee, J., Mills, G., Misztal, P., Moller, S., Monks, P. S., and Whalley, L. K.: Simulating atmospheric composition over a South-East Asian tropical rainforest: performance of a chemistry box model, Atmos. Chem. Phys., 10, 279–298, doi:10.5194/acp-10-279-2010, 2010. 22036
Pugh, T. A. M., MacKenzie, A. R., Langford, B., Nemitz, E., Misztal, P. K., and Hewitt, C. N.: The 30
![Fig. 2. Median statistics for BAe-146 UK research aircraft (red circle) and GEOS-Chem model (black triangle) concentration profiles for (a) CO [ppb], (b) organic aerosol [µg m −3 ], (c) SO 4 [µg m −3 ], (d) Isoprene [ppb], and (e) the sum of methyl vinyl k](https://thumb-eu.123doks.com/thumbv2/123dok_br/18313939.349053/37.918.207.507.47.457/statistics-research-aircraft-triangle-concentration-profiles-aerosol-isoprene.webp)
![Fig. 3. Top row: NASA MODIS and GEOS-Chem model aerosol optical depths [unitless] and their di ff erences for July 2008](https://thumb-eu.123doks.com/thumbv2/123dok_br/18313939.349053/38.918.104.603.106.453/nasa-modis-geos-aerosol-optical-depths-unitless-erences.webp)
![Fig. 5. Model vertical profiles of CO [ppb], aerosol extinction and its percentage source contri- contri-butions from sulphate, black carbon (BC), organic carbon (OC), sea salt in accumulation (SSa) and coarse (SSc) modes, and desert dust for June–July 200](https://thumb-eu.123doks.com/thumbv2/123dok_br/18313939.349053/40.918.62.657.72.486/vertical-profiles-aerosol-extinction-percentage-sulphate-organic-accumulation.webp)
