www.atmos-chem-phys.net/10/5707/2010/ doi:10.5194/acp-10-5707-2010
© Author(s) 2010. CC Attribution 3.0 License.
Chemistry
and Physics
Molecular hydrogen (H
2
) emissions and their isotopic signatures
(H/D) from a motor vehicle: implications on atmospheric H
2
M. K. Vollmer1, S. Walter2, S. W. Bond1, P. Soltic3, and T. R¨ockmann2
1Empa, Swiss Federal Laboratories for Materials Science and Research, Laboratory for Air Pollution and Environmental
Technology, ¨Uberlandstrasse 129, 8600 D¨ubendorf, Switzerland
2Institute for Marine and Atmospheric research Utrecht, Utrecht University, Princetonplein 5, 3508TA Utrecht,
The Netherlands
3Empa, Swiss Federal Laboratories for Materials Science and Research, Laboratory of I. C. Engines, ¨Uberlandstrasse 129,
8600 D¨ubendorf, Switzerland
Received: 24 November 2009 – Published in Atmos. Chem. Phys. Discuss.: 5 February 2010 Revised: 26 May 2010 – Accepted: 10 June 2010 – Published: 29 June 2010
Abstract. Molecular hydrogen (H2), its isotopic
signa-ture (deuterium/hydrogen,δD), carbon monoxide (CO), and other compounds were studied in the exhaust of a passen-ger car engine fuelled with gasoline or methane and run un-der variable air-fuel ratios and operating modes. H2 and
CO concentrations were largely reduced downstream of the three-way catalytic converter (TWC) compared to levels up-stream, and showed a strong dependence on the air-fuel ratio (expressed as lambda, λ). The isotopic composition of H2
ranged fromδD=−140‰ toδD=−195‰ upstream of the TWC but these values decreased to−270‰ to−370‰ after passing through the TWC. Post-TWCδDvalues for the fuel-rich range showed a strong dependence on TWC temperature with more negativeδDfor lower temperatures. These effects are attributed to a rapid temperature-dependent H-D isotope equilibration between H2and water (H2O). In addition, post
TWC δD in H2 showed a strong dependence on the
frac-tion of removed H2, suggesting isotopic enrichment during
catalytic removal of H2with enrichment factors (ε) ranging
from−39.8‰ to−15.5‰ depending on the operating mode. Our results imply that there may be considerable variability in real-worldδDemissions from vehicle exhaust, which may mainly depend on TWC technology and exhaust temperature regime. This variability is suggestive of aδD from traffic that varies over time, by season, and by geographical loca-tion. An earlier-derived integrated pure (end-member) δD from anthropogenic activities of−270‰ (Rahn et al., 2002)
Correspondence to:M. K. Vollmer (martin.vollmer@empa.ch)
can be explained as a mixture of mainly vehicle emissions from cold starts and fully functional TWCs, but enhanced δDvalues by>50‰ are likely for regions where TWC tech-nology is not fully implemented. Our results also suggest that a full hydrogen isotope analysis on fuel and exhaust gas may greatly aid at understanding process-level reactions in the exhaust gas, in particular in the TWC.
1 Introduction
The poorly understood budget of atmospheric molecular hy-drogen (H2) has received increased attention over the past
years because of a potentially massive disturbance in the near future due to a potential shift towards a hydrogen energy economy. Recent studies have revealed potential negative impacts on stratospheric ozone and on earth’s climate sys-tems via the role of H2 in atmospheric chemistry; however,
quantitative estimates are highly uncertain, largely due to un-known leakage rates of H2to the atmosphere from future H2
energy systems. In the traffic sector, current H2emissions
from conventional combustion engine systems would disap-pear, but could be replaced by leakage and purged losses from H2-powered vehicles.
H2is abundant in the atmosphere at relatively high
sources are in-situ photochemical production from methane (CH4) and other hydrocarbons (30–77 Tg a−1), fossil fuel
emissions (11–20 Tg a−1), biomass burning (10 – 20 Tg a−1),
and minor emissions from microbial nitrogen (N2) fixation
on land and in the oceans (6–10 Tg a−1). The dominant sink of H2 is enzymatic destruction in soil (55–88 Tg a−1), but
there is also considerable removal through oxidation by the hydroxyl radical in the atmosphere (15–19 Tg a−1). These fluxes result in a tropospheric lifetime of H2 of 1.4–2.2 a.
Due to the dominant soil sink and the larger land coverage in the Northern Hemisphere, this hemisphere exhibits smaller tropospheric concentrations compared to the Southern Hemi-sphere, which is an unusual distribution for atmospheric trace gases.
Stable isotope measurements of H2 using the
hydro-gen/deuterium (H/D) ratio have greatly added to differenti-ating various sources and sinks (Brenninkmeijer et al., 2003; Ehhalt and Rohrer, 2009). This is particularly true because of largely differing isotopic signatures of the sources. For example, H2from CH4oxidation is particularly enriched in
deuterium with δD values ∼130‰ to 180‰ (Rahn et al., 2003; Rhee et al., 2006; Feilberg et al., 2007; R¨ockmann et al., 2003; Pieterse et al., 2009), biogenic H2is
extraordi-narily depleted (δD∼ −700‰, e.g. Rahn et al. (2002); Wal-ter and et al. (2010)), and combustion-derived H2hasδD
val-ues of approximately−170‰ to−270‰ (Gerst and Quay, 2001; Rahn et al., 2002).
Automobile exhaust is believed to dominate anthro-pogenic H2emissions, and has recently been estimated
glob-ally at 4.2–5.4 Tg a−1 with a decreasing trend, based on a
fleet-integrated tunnel emission study (Vollmer et al., 2007). The single available isotope study of regional traffic emis-sions using polluted air samples from the Los Angeles basin by Rahn et al. (2002) suggests an urban pollution isotopic signature of−270‰ for this region. Samples taken near the exhaust of individual vehicles in their study showed consid-erable variability in the isotopic signature, as did a few sam-ples collected in a parking garage by Gerst and Quay (2001), which showed less depletedδD.
Engine and catalytic converter technology is evolving rapidly, and along with the increasing diversity of fuel types, presents a challenge for vehicle emissions characterization. Such studies can be conducted on various levels of detail, and range from regional scale atmospheric observations of polluted air masses to single unit process studies. Isotope investigations can greatly improve the distinction from other sources and sinks of pollutants. For vehicle exhaust, progress has recently been achieved through isotopic studies of e.g. carbon monoxide, CO (Tsunogai et al., 2003), methane, CH4
(Chanton et al., 2000; Nakagawa et al., 2005), and nitrous oxide, N2O (Toyoda et al., 2008). Here we present results
from a study on a passenger car engine for which we have measured pre- and post-catalytic H2concentrations and – to
our knowledge for the first time – H/D signatures under vari-able engine and fuel settings.
2 Materials and methods
2.1 Experimental setup
The engine experiment was conducted in 2008 on an engine test bench at the Empa Internal Combustion Engines Labo-ratory using a naturally-aspirated passenger car engine with four cylinders, 2-L displacement, and the capability to com-bust either gasoline or natural gas. The engine was equipped with a state-of-the art engine control unit, which was origi-nally calibrated to achieve Euro-4 emission limits for a mid-size passenger car. On the test bench, the control parameters could be modified to study e.g. the influence of the air-to-fuel ratio on combustion and emissions. The combustion air fed to the engine was conditioned to a temperature of 295 K and a relative humidity of 50%. The exhaust system was equipped with a single three-way ceramic substrate catalytic converter (TWC) with a cell density of 600 cells per square inch (cpsi) and coated with palladium and rhodium as the catalytically active materials. Ceria, an oxide of the element cerium, was used in the TWC’s wash-coat to achieve the de-sired oxygen storage capacity. For the sake of the later tem-perature discussion, it is worthy to mention that a TWC is not actively heated but that it is initially cold (termed “cold start” in traffic studies) after engine start-up until sufficient hot exhaust gas passes through it to make it fully functional (light-off temperature). For air-to-fuel ratio feedback con-trol, the engine was equipped with a linear lambda (λ) sensor upstream of the catalyst and a switching-typeλsensor down-stream of the TWC for bias control. Linearλsensors are able to measure deviations ofλvery precisely but they unfortu-nately show a relatively slow signal drift, which depends on many factors. To compensate for this drift, the bias of the linearλsensor is corrected occasionally using the signal of a much simpler switching-typeλsensor mounted downstream of the TWC. Such switching-type sensors show a very stable and steep signal change atλ=1 but no useful information of the actualλvalue in fuel-rich or fuel-lean operating condi-tions. The engine control used a square signal “λ-wobbling” function with an amplitude of 0.02 to the nominalλsetting. These rich-lean excursions are very often used in modern en-gine controls to enhance the TWC’s efficiency, and to per-form diagnosis of the TWC during engine operation using the TWC’s dynamic response to this wobbling.
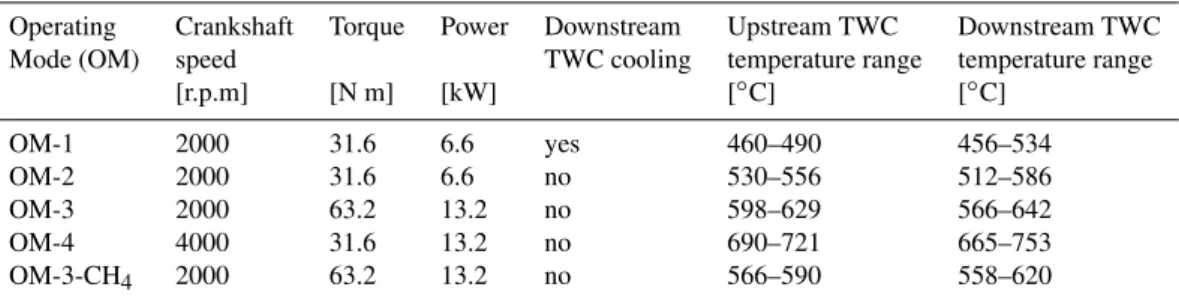
Table 1. Operating modes (OM) for the experiments conducted on a passenger car engine. The three-way catalytic converter (TWC) was actively cooled in operating mode 1. OM-1 through OM-4 are gasoline-fuelled, OM-3-CH4 is methane-fuelled. Upstream and downstream TWC temperatures are lambda-dependent (low temperatures for low lambda). Although the TWC is not actively heated, some downstream temperatures are higher due to exothermic reactions occurring within the TWC.
Operating Crankshaft Torque Power Downstream Upstream TWC Downstream TWC
Mode (OM) speed TWC cooling temperature range temperature range
[r.p.m] [N m] [kW] [◦C] [◦C]
OM-1 2000 31.6 6.6 yes 460–490 456–534
OM-2 2000 31.6 6.6 no 530–556 512–586
OM-3 2000 63.2 13.2 no 598–629 566–642
OM-4 4000 31.6 13.2 no 690–721 665–753
OM-3-CH4 2000 63.2 13.2 no 566–590 558–620
of OM-1 and OM-2. In order to study the air-to-fuel set-tings on the pollutant emissions before and after TWC, the λfor each OM was varied aroundλ= 1.0. To prevent unde-sired fuelling changes caused by aλbias control, bias control was turned off. The gasoline used for these experiments was market fuel with research octane number 95.5, a density of 736 kg m−3, a sulphur content of 22.6 mg kg−1, and an H/C ratio of 1.97. One of the purposes of this experiment was to study the interference of H2in the exhaust on the lambda
probe. For this reason all operating modes were repeated us-ing CH4 as the engine fuel (commercial bottled CH4based
on fossil-fuel natural gas). However, the focus of the H2
sta-ble isotope study was on the exhaust of the gasoline-powered engine, and we therefore discuss the CH4results only briefly
in the context of the H2isotopes. In addition to the
chemi-cal species discussed here, measurements in the exhaust were made of O2, nitrogen oxides (NOx, NO, NO2), CH4,
short-chained hydrocarbons (C2–C4), some aromatics, total
hydro-carbons (HC), water (H2O), N2O, and sulphur dioxide (SO2).
Samples for D/H isotope analysis were collected at ∼2 bar in 1-L glass flasks fitted with 2 stopcocks (NORMAG, Illmenau, Germany), and others at∼3 bar in ∼2-L inter-nally electro-polished stainless steel (ss) canisters using a small membrane pump (KNF model N86-KTE). The sam-pling stream was cooled in an ice bath before entering the pump and the condensed water was periodically removed. The samples were further dried using magnesium perchlo-rate (Mg(ClO4)2) before collection in the flasks. Analysis of
the samples was performed within 3 months after their col-lection.
2.2 Instrumentation
H2concentrations were measured on-line using a
commer-cially available electron impact ionization mass spectrome-ter (EIMS, H-Sense, V&F Analyse und Messtechnik, Ab-sam, Austria). The instrument precision is∼1% (1σ of 1-min mean). However the measurements were affected by a blank of ∼8 ppm (parts-per-million, 10−6, molar), likely
caused by some H2O interference in the system. This blank
was determined and corrected for by comparing the EIMS results with the concentration results from the flask samples, which were available for the low-concentration range (λ >1). While this blank correction is of little relevance for the high-concentration samples, it resulted in considerable uncertain-ties of up to 50% for some of the low-concentration samples. Calibration of the instrument was achieved using commercial standards (30 ppm and 1000 ppm, Messer Schweiz, accura-cies 0.5%) and during an independent validation study, the instrument was found to exhibit linear response within the range of our measured concentrations (Br¨uhlmann, 2004). Overall accuracies of the H2concentrations are estimated at
5 ppm or 3%, whichever is greater.
CO, CO2, and H2O were measured on-line using an
auto-motive Fourier Transformation Infra-red (FTIR) instrument (AVL SESAM). This instrument was calibrated during com-missioning using high-precision gases and did not need re-calibration during the experiment. Estimated uncertainties are 0.14% for H2O, 0.12% for CO and 0.33% for CO2.
The CO and CO2 concentrations were converted to dry air
mole fractions using this instrument’s H2O results.
Earlier-mentioned compounds, which are not discussed here, were also measured on this FTIR and on a standard engine emis-sion bench instrument (Horiba Mexa 9200).
Isotopic measurements of H2from the flask samples were
conducted in the isotope laboratory of the Institute for Ma-rine and Atmospheric research Utrecht (IMAU), Utrecht Uni-versity using isotope ratio mass spectrometry (Rhee et al., 2004). Isotope results are reported using the “delta” notation, δD= [(D/H)s/(D/H)VSMOW−1]×1000‰, wheres is the H2
2.3 Results and discussion
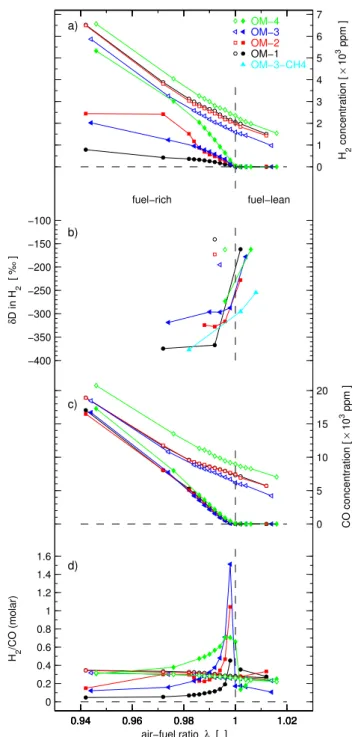
The results for our compounds of interest are listed in Table 2 and shown in Fig. 1 as a function of the fuel ratio. The air-fuel ratio is expressed here as a lambda (λ) value, whereby λ <1 is the range of fuel-rich combustion (typically dur-ing vehicle accelerations) andλ >1 corresponds to fuel-lean combustion (excess oxygen present). H2 and CO are
pro-duced during incomplete combustion, and their abundance is related, amongst other chemical reactions, through the water-gas shift reaction H2+ CO2↔H2O + CO. Pre-TWC results
showed largest emissions under fuel-rich conditions, with concentrations up to∼14 000 ppm for H2and∼41 000 ppm
for CO. These concentrations decreased with increasingλto about 1000–1500 ppm for H2 and 4000–7000 ppm for CO
for the leanest samples. From the presence of large H2
con-centrations in all pre-TWC samples, we conclude that the H2
concentration and isotope ratio in the intake air (which we measured in a nearby ambient sample with a concentration of 573 ppb and aδDof 83.3‰) is not relevant in the follow-ing discussion.
Post-TWC emissions of H2and CO were lower compared
to the pre-TWC emissions. Here the emissions were also larger in the fuel rich range, but nearly disappeared in the fuel-lean range. For H2, most concentrations of the fuel-lean
experiments were below typical ambient atmospheric values of∼0.5 ppm, implying that under these conditions, H2is
de-stroyed on the TWC. The post-TWC H2 concentrations in
the fuel-rich range were highly dependent on the operating mode, with highest emissions for OM-4. In contrast, the post-TWC concentrations for CO showed remarkably sim-ilarλdependence for all 4 operating modes.
The cooling of the TWC also had significant effects on post-TWC H2emissions. The reduction of the TWC
temper-atures in OM-1 by∼50◦C compared to OM-2 (Table 1)
re-sulted in a reduction of H2emissions to less than half of those
in the fuel-rich range, but had no effect on the CO emissions. These observations demonstrate that reactions other than the water-gas-shift play a role, because the latter alone would be driving the equilibrium to higher H2 yield at reduced
tem-peratures (Haryanto et al., 2009), and not the opposite we’ve observed. One possible explanation for these observations is that the TWC’s active sites are occupied by hydrocarbons thereby preventing adsorption of H2O required for the
water-gas-shift reaction (e.g. Auckenthaler, 2005).
Our D/H isotope analysis shows largely differing isotope ratios between the individual settings, with the following three major observations. Firstly, for a given air-fuel ratio, the H2in the post-TWC exhaust was more depleted in
deu-terium compared to the pre-TWC exhaust. For the range where and post-TWC samples were available, the pre-TWCδDvalues ranged from−140‰ to−195‰ but these values decreased to between−270‰ and−370‰ after pass-ing through the TWC. Secondly, the post-TWC D/H ratios showed a strong dependence onλwith lowerδDin the
fuel-OM−3−CH4 OM−1
OM−2
OM−3 OM−4
0.94 0.96 0.98 1 1.02 0 1 2 3 4 5 6 7
H2
concentration [
×
10
3 ppm ] a)
fuel−rich fuel−lean
air−fuel ratio λ [ ]
0.94 0.96 0.98 1 1.02 −400
−350 −300 −250 −200 −150 −100
δ
D in H
2
[
%
o
]
b)
0.94 0.96 0.98 1 1.02 0 5 10 15 20
CO concentration [
×
10
3 ppm ] c)
0.94 0.96 0.98 1 1.02 0
0.2 0.4 0.6 0.8 1 1.2 1.4 1.6
H2
/CO (molar)
d)
Fig. 1. Engine exhaust concentrations for H2 (a)and its isotope
ratioδD(b), CO(c), and the ratio H2/CO(d)vs. the air-fuel ratio
(λ) upstream (open symbols) and downstream (filled symbols) of
the three-way catalytic (TWC) converter. The colors differentiate the four main operating modes of the gasoline-fuelled engine and the isotope results for one methane-fuelled operating mode in (b).
The data for the lowestλare omitted to show the remaining results
in closer detail. Vertical and horizontal dashed lines are visual aids
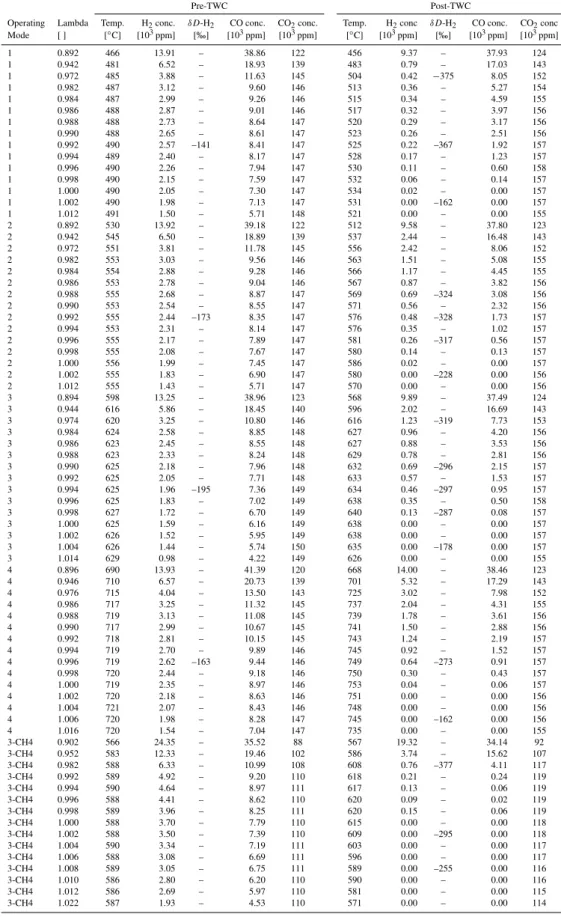
Table 2.Temperatures, trace gas concentrations, and H2isotope ratio for pre-TWC (three-way catalytic converter) and post-TWC exhaust gasoline and from a methane-fuelled engine. The operating modes (OM) OM 1–4 are gasoline fuelled and OM 3-CH4 is methane fuelled. These OM are further specified in Table 1.
Pre-TWC Post-TWC
Operating Lambda Temp. H2conc. δD-H2 CO conc. CO2conc. Temp. H2conc δD-H2 CO conc. CO2conc
Mode [ ] [◦C] [103ppm] [‰] [103ppm] [103ppm] [◦C] [103ppm] [‰] [103ppm] [103ppm]
1 0.892 466 13.91 – 38.86 122 456 9.37 – 37.93 124
1 0.942 481 6.52 – 18.93 139 483 0.79 – 17.03 143
1 0.972 485 3.88 – 11.63 145 504 0.42 −375 8.05 152
1 0.982 487 3.12 – 9.60 146 513 0.36 – 5.27 154
1 0.984 487 2.99 – 9.26 146 515 0.34 – 4.59 155
1 0.986 488 2.87 – 9.01 146 517 0.32 – 3.97 156
1 0.988 488 2.73 – 8.64 147 520 0.29 – 3.17 156
1 0.990 488 2.65 – 8.61 147 523 0.26 – 2.51 156
1 0.992 490 2.57 –141 8.41 147 525 0.22 –367 1.92 157
1 0.994 489 2.40 – 8.17 147 528 0.17 – 1.23 157
1 0.996 490 2.26 – 7.94 147 530 0.11 – 0.60 158
1 0.998 490 2.15 – 7.59 147 532 0.06 – 0.14 157
1 1.000 490 2.05 – 7.30 147 534 0.02 – 0.00 157
1 1.002 490 1.98 – 7.13 147 531 0.00 –162 0.00 157
1 1.012 491 1.50 – 5.71 148 521 0.00 – 0.00 155
2 0.892 530 13.92 – 39.18 122 512 9.58 – 37.80 123
2 0.942 545 6.50 – 18.89 139 537 2.44 – 16.48 143
2 0.972 551 3.81 – 11.78 145 556 2.42 – 8.06 152
2 0.982 553 3.03 – 9.56 146 563 1.51 – 5.08 155
2 0.984 554 2.88 – 9.28 146 566 1.17 – 4.45 155
2 0.986 553 2.78 – 9.04 146 567 0.87 – 3.82 156
2 0.988 555 2.68 – 8.87 147 569 0.69 –324 3.08 156
2 0.990 553 2.54 – 8.55 147 571 0.56 – 2.32 156
2 0.992 555 2.44 –173 8.35 147 576 0.48 –328 1.73 157
2 0.994 553 2.31 – 8.14 147 576 0.35 – 1.02 157
2 0.996 555 2.17 – 7.89 147 581 0.26 –317 0.56 157
2 0.998 555 2.08 – 7.67 147 580 0.14 – 0.13 157
2 1.000 556 1.99 – 7.45 147 586 0.02 – 0.00 157
2 1.002 555 1.83 – 6.90 147 580 0.00 –228 0.00 156
2 1.012 555 1.43 – 5.71 147 570 0.00 – 0.00 156
3 0.894 598 13.25 – 38.96 123 568 9.89 – 37.49 124
3 0.944 616 5.86 – 18.45 140 596 2.02 – 16.69 143
3 0.974 620 3.25 – 10.80 146 616 1.23 –319 7.73 153
3 0.984 624 2.58 – 8.85 148 627 0.96 – 4.20 156
3 0.986 623 2.45 – 8.55 148 627 0.88 – 3.53 156
3 0.988 623 2.33 – 8.24 148 629 0.78 – 2.81 156
3 0.990 625 2.18 – 7.96 148 632 0.69 –296 2.15 157
3 0.992 625 2.05 – 7.71 148 633 0.57 – 1.53 157
3 0.994 625 1.96 –195 7.36 149 634 0.46 –297 0.95 157
3 0.996 625 1.83 – 7.02 149 638 0.35 – 0.50 158
3 0.998 627 1.72 – 6.70 149 640 0.13 –287 0.08 157
3 1.000 625 1.59 – 6.16 149 638 0.00 – 0.00 157
3 1.002 626 1.52 – 5.95 149 638 0.00 – 0.00 157
3 1.004 626 1.44 – 5.74 150 635 0.00 –178 0.00 157
3 1.014 629 0.98 – 4.22 149 626 0.00 – 0.00 155
4 0.896 690 13.93 – 41.39 120 668 14.00 – 38.46 123
4 0.946 710 6.57 – 20.73 139 701 5.32 – 17.29 143
4 0.976 715 4.04 – 13.50 143 725 3.02 – 7.98 152
4 0.986 717 3.25 – 11.32 145 737 2.04 – 4.31 155
4 0.988 719 3.13 – 11.08 145 739 1.78 – 3.61 156
4 0.990 717 2.99 – 10.67 145 741 1.50 – 2.88 156
4 0.992 718 2.81 – 10.15 145 743 1.24 – 2.19 157
4 0.994 719 2.70 – 9.89 146 745 0.92 – 1.52 157
4 0.996 719 2.62 –163 9.44 146 749 0.64 –273 0.91 157
4 0.998 720 2.44 – 9.18 146 750 0.30 – 0.43 157
4 1.000 719 2.35 – 8.97 146 753 0.04 – 0.06 157
4 1.002 720 2.18 – 8.63 146 751 0.00 – 0.00 156
4 1.004 721 2.07 – 8.43 146 748 0.00 – 0.00 156
4 1.006 720 1.98 – 8.28 147 745 0.00 –162 0.00 156
4 1.016 720 1.54 – 7.04 147 735 0.00 – 0.00 155
3-CH4 0.902 566 24.35 – 35.52 88 567 19.32 – 34.14 92
3-CH4 0.952 583 12.33 – 19.46 102 586 3.74 – 15.62 107
3-CH4 0.982 588 6.33 – 10.99 108 608 0.76 –377 4.11 117
3-CH4 0.992 589 4.92 – 9.20 110 618 0.21 – 0.24 119
3-CH4 0.994 590 4.64 – 8.97 111 617 0.13 – 0.06 119
3-CH4 0.996 588 4.41 – 8.62 110 620 0.09 – 0.02 119
3-CH4 0.998 589 3.96 – 8.25 111 620 0.15 – 0.06 119
3-CH4 1.000 588 3.70 – 7.79 110 615 0.00 – 0.00 118
3-CH4 1.002 588 3.50 – 7.39 110 609 0.00 –295 0.00 118
3-CH4 1.004 590 3.34 – 7.19 111 603 0.00 – 0.00 117
3-CH4 1.006 588 3.08 – 6.69 111 596 0.00 – 0.00 117
3-CH4 1.008 589 3.05 – 6.75 111 589 0.00 –255 0.00 116
3-CH4 1.010 586 2.80 – 6.20 110 590 0.00 – 0.00 116
3-CH4 1.012 586 2.69 – 5.97 110 581 0.00 – 0.00 115
rich range (lowestδDvalues are−370‰) and higherδDin the fuel-lean range (up to δD= −160‰). Thirdly, we ob-served systematic differences between the operating modes, with OM-1 showing the lowestδDvalues and OM-4 exhibit-ing the highestδDvalues.
2.4 H2isotope equilibration with H2O
The finding of lower isotopeδDvalues after vs. before the TWC is opposite to what would be expected if H2was
re-moved through a normal chemical (oxidation) process where the light isotopologues are removed preferentially. We hy-pothesize that our observed isotopic signatures are controlled by a temperature-dependent isotope equilibration process be-tween H2 and H2O. The latter is the dominant pool of
hy-drogen in the exhaust as it is abundant at concentrations of
∼130 000 ppm and hence more than one order of magnitude larger than any other hydrogen-containing compounds in the lambda range of interest, including H2. For such an
equili-bration process, the hotter engine exhaust (∼800−1000◦C) results in a higher isotope ratio compared to the relatively cooler exhaust (∼500−700◦C) downstream of the TWC (Bottinga, 1969). A similar temperature-dependent isotope equilibration process was recently suggested by Affek and Eiler (2006) for the oxygen isotopes in CO2 and H2O in
car exhaust and by Rahn et al. (2002) for H2–H2O in
high-temperature steam reforming and low-high-temperature photo-biological processes.
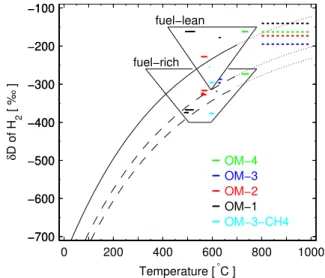
To explore the above hypothesis we investigate whether the post-TWC samples at the different TWC temperatures of the 4 operating modes show this equilibration effect. In Fig. 2 we compare the isotope ratios of the post-TWC fuel-rich samples with results from the theoretically derived H2–
H2O isotope equilibrium as studied by Bottinga (1969). We
plot the isotope results as a function of the exhaust tempera-ture ranges as measured before and after the TWC. For a di-rect comparison of our results to those of Bottinga (1969) the δ values should be reported relative to the H2O with which
the H2is in equilibrium but unfortunately H2O was not
col-lected for isotope analysis. However, as the H2O is the
dom-inant hydrogen pool in the exhaust, itsδD can be approxi-mated by that of the gasoline, which is estiapproxi-mated at –80‰ to−110‰ vs. VSMOW (Schimmelmann et al., 2006). We therefore convert the theoretical results (Bottinga, 1969) to the VSMOW scale by shifting them by these offsets (Fig. 2). Our measuredδDvalues of the fuel-rich post-TWC samples then show a temperature-dependence that is very similar to that derived from theory (Fig. 2). This holds for the experi-ments with gasoline. TheδD of the sample collected when CH4was used as fuel is offset by∼80‰ from the range for
gasoline. This finding is also consistent with our hypothesis because CH4in natural gas is even more depleted in D/H than
gasoline, e.g.δD equals−190‰ to−220‰ vs. VSMOW for natural gas of Russian origin (Cramer et al., 1999), which accounts for a significant fraction of the European pipeline
fuel−lean
fuel−rich
OM−3−CH4
OM−1 OM−2 OM−3 OM−4
−700 −600 −500 −400 −300 −200 −100
δ
D of H
2
[
%
o
]
0 200 400 600 800 1000
−700 −600 −500 −400 −300 −200 −100
Temperature [ °C ]
Fig. 2.Temperature-dependence ofδDof H2produced in motor ve-hicle engine combustion. The short solid horizontal lines of variable
size denote theδDin H2for various operating modes (see Fig. 1)
on the VSMOW scale of the downstream three-way catalytic con-verter (post-TWC) exhaust samples. The width of the lines indicate the temperature ranges of the TWC. The solid curved line is a theo-retical prediction (dotted lines is our extrapolation using a function
a + b×T + c×T1/2) ofδDin H2in isotopic equilibrium with H2O
(Bottinga, 1969) and plotted relative toδDof H2O as a reference.
This curved line is shifted by the estimatedδDof H2O in gasoline
exhaust (−80‰ to−110‰ vs. VSMOW, (Schimmelmann et al.,
2006), dashed curved lines) in order to match the scale of reference.
The fuel-rich post-TWC gasolineδDagree well with the predicted
values. The results for the pre-TWC samples are plotted as dashed lines in the upper right corner in the approximate temperature range of the exhaust gas when exiting the engine.
natural gas mixture from which the CH4in our experiment
was extracted.
In the above evaluation, we have ignored the hydrogen added to the system from the water in the intake air. At λ= 1, the H2O concentration of the intake air contributes to
∼10 % to the total hydrogen pool. This is calculated based on the relative humidity in the air intake, which is controlled at 50 %, and the measured H2O in the exhaust, which is the
Our finding of an equilibration temperature similar to the temperature of the TWC is somewhat surprising. Exhaust flow is fast and so are its temperature changes. The H2–
H2O isotopic equilibration rates at these high temperatures
are assumed to be fast also, but likely to slow down as the exhaust cools. As a consequence, it is to be expected that theδDin H2, which is also changing rapidly in the cooling
exhaust stream, leads to a final meanδD, which is derived from a composite (frequency distribution) of isotope ratios from a wider equilibration temperature range, rather than a δD from a single equilibration temperature. The width of this temperature distribution remains however unclear, but is likely related to the rate of exhaust cooling and to geome-try and surface area effects in the exhaust stream. Alterna-tively the meanδDcan also be regarded as an equilibration in a narrow-width temperature distribution approximated by a single “lock-in” temperature. Although inconclusively, Af-fek and Eiler (2006) find evidence in their study that the oxy-gen isotope ratio in CO2–H2O corresponds to such a
sin-gle lock-in temperature of ∼200◦C, rather than a mixture of isotope ratios from a broad temperature spectrum (iso-topic mean from e.g. 900 and 50◦C in their example). If in our case the system was also better characterized by a sin-gle lock-in temperature, it would certainly not be the same as that found by Affek and Eiler (2006) for CO2–H2O. In our
case of H2 – H2O, a lock-in temperature of 200◦C would
result in a theoretical H2−δDof approximately−600‰, a
value that is inconsistent with our laboratory observations or any field observations of combustion/industrial isotope sig-natures found in the past (Begemann and Friedman, 1959; Ehhalt et al., 1963; Gerst and Quay, 2001; Gonsior and Fried-man, 1962; Rahn et al., 2002). As shown above, the lock-in temperatures for the post-TWC fuel-rich samples in our ex-periment would be the TWC temperatures (∼500–700◦C). This suggests that, in the case of H2–H2O, the TWC catalytic
activity facilitates a rapid isotope equilibration and that a po-tential isotopic re-adjustment at lower temperatures down-stream of the TWC is insignificant. In contrast, the finding of Affek and Eiler (2006) suggests that for CO2–H2O, the
lock-in of the isotope equilibration occurs well downstream of the TWC at much lower temperatures.
In Fig. 2, we also indicated the H2−δDof our pre-TWC
results by plotting these in the temperature range that is typi-cal for exhaust gases leaving the engine’s combustion cham-ber (800–1000◦C). Qualitatively, the observation that these
δDvalues are higher than those from the post-TWC samples again supports the temperature hypothesis, but quantitatively theδDvalues are more enriched for the respective tempera-tures than expected from theory. For theδDof these samples, the lock-in temperature would need to be much higher. The present study cannot resolve whether these signatures could be the remnants of H2–H2O equilibration at the much higher
temperatures (up to∼2300◦C) during the combustion pro-cess.
2.5 H2isotope fractionation during catalytic removal
The temperature-driven H2–H2O isotope equilibration, as
discussed in the previous section, can only explain some of the H2−δDvariability we measured. For the individual
op-erating modes, we observe a strong dependence of the iso-tope ratios onλ, particularly in the fuel-lean range (Fig. 1), even though there is only minor TWC temperature variabil-ity for each individual operating mode. δDof H2increases
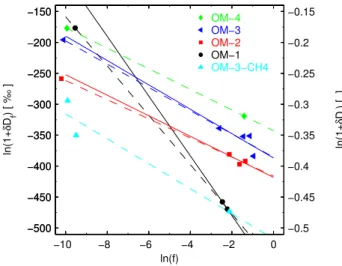
with increasingλ(Fig. 1). To characterize the isotopic en-richment during H2removal, we estimate the fractionation
using the Rayleigh model where we relate the changes inδD to the fraction f of the post-TWC to the initial (pre-TWC) H2
concentrations (e.g. Kaiser et al., 2002):
ln(1+δDres)=ln(1+δD0)+ε×ln(f ) (1)
whereδDresandδD0are the post (residual) – and pre-TWC
δDvalues of H2, respectively, andεis the enrichment
fac-tor. Note that aδD value of e.g. −300‰ (arbitrary num-ber) has to be entered as −0.3 in Eq. (1). Also, because of the large isotope variations we refrain from the conven-tional linear approximation ln(δD +1)≈δD. For our arbi-trary example this means that theδD= −300 ‰ corresponds to ln(δD +1)= −357 ‰. The εis related to the fractiona-tion factor α (defined as the ratio of the reaction/removal rates, α=k(H D)/ k(H2)) through the definition ε= (α−1)
and usually expressed in ‰, see (e.g. Friedman and O’Neil, 1977; Brenninkmeijer et al., 2003). Theεis calculated us-ing least-square fittus-ing techniques and is graphically shown in Fig. 3. We fit the data by linear regression, but in a first run we exclude the results for the very low H2
concentra-tion samples (ln(f)≈ −10) because due to their very low H2
concentrations, any potential contamination with ambient air or isotope effects other than that discussed here, would have strong influences on the δD(the large uncertainty in these samples’ H2 concentrations is relatively small when
plot-ted on a logarithmic scale). For the linear regressions of OM-2 and OM-3, we findR2≈0.6 each and large 95% con-fidence bands. The linear regressions for these operating modes and for OM-1 (dashed lines in Fig. 3) closely pre-dict the results at the low ln(f) end. This enhances the con-fidence that these samples may not have been altered sig-nificantly by any potential contamination, and we therefore include them in the linear regression (solid lines). This re-sults in the following fractionation constants for the different operating points with 95% confidence bands: forεOM−1= –
39.8 ±3.1‰, εOM−2= –15.5±3.0‰, εOM−3= –18.8±5.2‰
(R2>0.98 for all fits), and the slope of the line connect-ing the two OM-4 samples yieldsεOM−4= –16.7‰. For the
methane-fuelled experiment OM-4-CH4, we calculate a
frac-tionation constant ofεOM−4−CH4= –20.2±69‰.
Our analysis thus suggests the presence of two separate isotope effects, a H2–H2O temperature-dependent isotope
OM−3−CH4 OM−1
OM−2
OM−3 OM−4
−500 −450 −400 −350 −300 −250 −200 −150
ln(1+
δ
Df
) [
%
o
]
ln(1+
δ
D f
) [ ]
−10 −8 −6 −4 −2 0
−500 −450 −400 −350 −300 −250 −200 −150
ln(f)
−0.5 −0.45 −0.4 −0.35 −0.3 −0.25 −0.2 −0.15
Fig. 3.Rayleigh fractionation diagram for theδD-H2isotope frac-tionation of post-catalytic converter exhaust of a car engine. The solid lines are least-square linear fits through the data excluding
those with low ln(f) near−10, and the dashed lines are linear fits
us-ing all data points. The five colors denote different operatus-ing modes of the engine (see Fig. 1).
removal. While our observations can be fully explained by these two mechanisms, it is the simultaneous appearance of both effects in our samples that remains puzzling. Since H2
removal is largely bound to the TWC surface, this is the place where the kinetic isotope fractionation is believed to occur during the ∼100 ms residence time in the TWC. The H2–
H2O equilibration step must, however, also mainly occur in
the TWC. This is obvious from the strong isotopic depletion when comparing post-TWC with corresponding pre-TWC isotope results. It is unlikely that the H2–H2O isotope
equili-bration would occur downstream of the TWC, as this would remove the clear isotopic signatures related to fractionation during removal. It is more likely that the equilibrium frac-tionation sets the generalδDvalue at the TWC temperature, and subsequently there is a kinetic process that removes H2
with the stated kinetic isotope effect. It should also be noted that the temperature of the exhaust gas increases by∼50◦C
during passage through the TWC due to the exothermic reac-tions (the TWC is not actively heated). Given this, it is even more surprising to find the results of both effects downstream of the TWC. TWC chemistry is very complex also with re-gard to H2, and it is therefore also possible that some
addi-tional processes and fractionations may potentially influence our results. Hydrocarbon steam-reforming and partial oxida-tion, water-gas shift reacoxida-tion, NO-reducoxida-tion, and H2
oxida-tion by O2are some of the processes involving hydrogen (D.
Ferri pers. communication, Sala¨un et al. (2009)).
2.6 Exhaust ratios of H2/CO, H2/CO2and CO/CO2
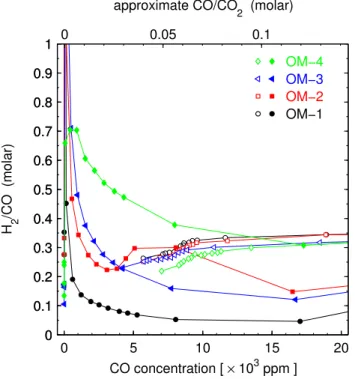
The ratios of H2/CO, H2/CO2 and CO/CO2 (in this paper
reported on a molar basis) in traffic exhaust have recently re-ceived increased attention because of their potential to iden-tify and characterize traffic pollution events in atmospheric observations, and to up-scale traffic emissions using the bet-ter constrained emission inventories of CO and CO2. Many
studies over the past decades have revealed tight H2to CO
relationships in raw engine exhaust (D’Alleva and Lovell, 1936; Leonard, 1961; Auckenthaler, 2005) and our pre-TWC H2/CO of 0.2–0.35 (Figs. 1 and 4) are in close agreement
with these findings. Recent field studies of anthropogeni-cally polluted air in Europe and North America have shown H2/CO ratios to vary in a relatively narrow range of∼0.3–0.6
(Novelli et al., 1999; Barnes et al., 2003; Steinbacher et al., 2007; Aalto et al., 2009), and when the traffic component was isolated from other H2and CO sources and sinks, yielded
ra-tios of 0.48–0.51 (Vollmer et al., 2007; Hammer et al., 2009). Our post-TWC results show considerable variability (Figs. 1 and 4) for the four operating modes and theλsettings. In the fuel-rich range, H2/CO varied between 0.05 and 1.6
de-pending on the operating mode (with coolest TWC exhibit-ing the lowest ratios). Surprisexhibit-ingly the H2/CO reduced to
about half for the actively-cooled TWC (OM-1 vs. OM-2) which is due to reduced H2emissions. H2/CO increases
sig-nificantly nearλ=1. However, forλ≥1 the H2and CO
con-centrations are tagged with high measurement uncertainties and consequently their ratios have large errors, and we are not further discussing these here. From an integrative aspect, because of their low concentrations, these ratios are also less important as they quantitatively add little to the overall traffic exhaust in a real-world case. In light of a comparison with real-world emissions, a more robust measure of H2/CO is the
cumulative H2/CO. The overall cumulative H2/CO over all
gasoline post-TWC measurements is 0.25, about half of that observed in an integrative tunnel study (0.51±0.11, Vollmer et al. (2007)). This difference is likely caused by the some-what arbitrary selection of λ-points which affects our cu-mulative estimate, and the generally large variability found throughout individual single-vehicle exhaust systems (Bond et al., 2010). Differences may also occur because our study uses more static settings compared to the dynamics found in real traffic. This is likely to cause some differences in the regime of O2storage capacities and hence may influence H2
and CO levels too.
Our similarly-calculated overall ratio for H2/CO2 is
8.9×10⁻³, about double that found in the tunnel study
(4.4±1.7×10⁻³, Vollmer et al. (2007)), and likely caused by the low-H2 high-CO2 diesel exhaust component in the
tunnel. We also relate the H2/CO to the combustion
ef-ficiency, here defined as CO/CO2 (Fig. 4). Although the
OM−1
OM−2
OM−3 OM−4
0 0.1 0.2 0.3 0.4 0.5 0.6 0.7 0.8 0.9 1
H 2
/CO (molar)
0 5 10 15 20
0 0.1 0.2 0.3 0.4 0.5 0.6 0.7 0.8 0.9 1
CO concentration [ × 103 ppm ]
0 0.05 0.1
approximate CO/CO
2 (molar)
Fig. 4. Molar H2/CO ratio plotted vs. CO concentration. Open symbols denote pre-TWC samples and filled symbols denote post-TWC samples. The color-coding is the same as in Fig. 1.
more efficient combustion in vehicle engines compared to biomass burning (e.g., R¨ockmann et al., 2010). These find-ings suggest that the simultaneous determination of H2, CO,
and CO2, possibly along with isotopic measurements, may
provide a tool to distinguish traffic exhaust from biomass burning in air pollution.
2.7 Implications for real-world emissions
Although here we present results from a single engine/TWC experiment, some results are likely applicable to other engine settings and to real-world driving conditions. For the investi-gated engine, H2removal by the TWC is large. This implies
that single motor vehicle H2emissions from traffic have
de-creased strongly since the introduction of the catalytic con-verter in the 1970s. Due to increasingly stringent emission legislation around the world, improvements in catalytic con-verter technology, engine fueling precision, and the devel-opment of lambda control algorithms, global traffic H2 and
CO emissions are expected to decrease despite the increasing global car fleet (Vollmer et al., 2007).
To place our isotope results in a real-world context, we compare these to earlier published D/H isotope measure-ments of air samples polluted with traffic exhaust. This com-parison is shown in Fig. 5 as a “Keeling” plot, where the iso-topic signature is plotted against the inverse concentration of the sample. Rahn et al. (2002) have measured traffic-polluted
OM−3−CH4
OM−1
OM−2 OM−3
OM−4
20 10 5 2 H2concentration [ppm] 1
0 0.2 0.4 0.6 0.8 1
H
2 inverse concentration [ppm−1]
−400 −300 −200 −100 0
δ
D of H
2
[
‰
] −400 0 5 10 15
−300 −200 −100 0 100
δ
D of H
2
[
‰
]
H2 inverse mixing ratio [ppm−1]
Fig. 5.Isotope ratioδD-H2vs. inverse concentration (Keeling plot). The open and filled symbols on the vertical dashed line denote pre-and post-catalytic converter samples, respectively. The color coding is the same as in Fig. 1. The black crosses (single vehicles) and diamonds (city air) are from a study in the Los Angeles Basin by Rahn et al. (2002) with a fit (solid line) through their data pointing
to a−270‰ isotopic end-member. The magenta squares are from
samples taken in a parking garage by Gerst and Quay (2001). The insert includes the additional sub-ambient concentration samples of the post-catalytic lean engine combustion.
air samples in the Los Angeles basin in 2000, from which they derived a integrated pure anthropogenic isotopic sig-nature (end-member) of−270‰. This extrapolated value is bracketed by our pre-TWC and fuel-rich post-TWC results. Earlier results from Gerst and Quay (2001) from samples taken in 1999 in a parking garage in Seattle yielded higher concentration samples than those by Rahn et al. (2002), and were less depleted in D/H with results ranging from−173‰ to−183‰. The insert of Fig. 5 also includes the samples with very low concentrations from the fuel-lean range. As these concentrations are sub-ambient, they cannot be quanti-tatively investigated in the Keeling diagram. Still, the isotope signatures are in the same range as the very high concentra-tion samples. This suggests that in fact all of our samples are “pure” end-member samples (not mixtures of produced H2with ambient background H2), but with largely differing
source strengths.
An interpretation of our results from a fleet-level perspec-tive may provide some explanations for these apparent dis-crepancies. The isotopic signatures of exhaust atλ>1 are probably of little quantitative relevance because the H2
con-centrations are very small. In contrast, emissions during cold starts and in the fuel-rich range (λ<1) are large, and hence their isotopic signatures are of importance. Emissions from single vehicle studies of standardized driving cycles show that cold start H2emissions can contribute up to 40% of the
cycles’ total emissions (Bond et al., 2010). The extrapolated end-member of−270‰ by Rahn et al. (2002) based on their Los Angeles Basin study is likely a regional mixture of emis-sions from cold-starts (thus pre-TWC signatures) on the one hand (>−270‰) and fuel-rich TWC emissions (<–270‰) on the other. Because cold-start emissions are expected to continue contributing significantly to overall vehicle emis-sions, it is likely that the end-member value of−270‰ (Rahn et al., 2002) will be a useful average value for developed countries. For developing countries however, with parts of their fleets not equipped with TWC, it is likely that the high emissions from non-TWC vehicles will lead to a higher mean δDin H2traffic emissions.
It is tempting to attribute the relatively elevatedδDfound by Gerst and Quay (2001) to an apparent unrepresentative sampling location, since samples in a parking garage may be biased towards cold-start emissions (thus pre-TWC sig-natures). However Gerst and Quay (2001) state that their samples were taken in the morning when the majority of the vehicles arrive at the parking garage (presumably with fully-functional TWCs). Still the high emissions of a few potential cold-starts (with higher isotopic ratio) in the parking garage may have significantly influenced their results.
3 Conclusions
If our results are representative of a large variety of vehicle engine/TWC systems, then our findings have several impli-cations. Our results suggest that the isotopic signatures from vehicle emissions have “lightened” over the last decades due to the introduction of catalytic converters in the 1970s. It is likely that this evolution has progressed in different manners in different regions of the world. Assuming that the major-ity of the third-world countries converted to TWC technol-ogy at a slower rate than industrialized countries, this would imply that there may have been (and still could be) a geo-graphical difference in the isotopic signature of traffic ex-haust. Our results also suggest that traffic sampling should be carried out with caution. Urban traffic with more frequent congested traffic used to be characterized by more fuel-rich conditions with high H2emissions hence probably lower
iso-tope ratios. Current technological developments, however, avoid fuel-rich driving in urban traffic due to better lambda control systems, hence the fuel-rich driving (and thereby the low isotope ratios) may be limited to very high speed
driv-ing (e.g. German highways). The isotopic signature of cold-start emissions may resemble engine exhaust without TWC, hence parking garages may yield relatively enriched isotopic signatures.
Because the TWC is not actively heated, its temperature is partially a reflection of the exhaust gas temperature reaching the TWC. Therefore the driving mode will affect the TWC temperature, which in turn results in largely differing emis-sions of H2 concentrations, their δD-H2 and H2/CO ratio.
However TWC and exhaust system geometry in combina-tion with ambient temperatures will also significantly affect TWC temperatures and hence the emitted trace gases. Our results suggest that the exhaustδD-H2for colder ambient air
(e.g. winter) hence cooler TWC is significantly more nega-tive compared to warmer air (e.g. summer). Consequently, temperature variations should also lead to seasonal and geo-graphical variations inδD-H2, with, e.g., the tropics showing
different exhaust signatures compared to the high latitudes. Exhaust geometry, air flow and ambient temperatures may easily lead to temperature differences similar to the∼50◦C found for our OM-1 and OM-2 experiments, and could there-fore lead to variability ofδD-H2of∼50‰. Further studies
are needed to fully confirm the hypothesis of a temperature-driven isotopic H2-H2O equilibration in motor vehicle
ex-haust and the potential variability caused by catalytic con-verters, exhaust geometry, and ambient temperature condi-tions. Studies on a fleet level (e.g. tunnel studies) in various seasons and parts of the world could greatly help to better characterize the H2traffic emissions and their isotopic
signa-tures.
Except for the study by Affek and Eiler (2006), other isotope studies of car exhaust do not specifically address the question whether a significant thermal equilibration pro-cess between H2O and other exhaust compounds may occur.
Combined pre- and post-TWC measurements were generally not conducted except for the N2O study by Toyoda et al.
(2008). In their study, both isotopic enrichment and depletion were observed across the TWC, depending on the settings of the experimental variables, but in their case, the situation is complicated by both destruction and production of N2O in
the exhaust stream. For CH4and CO stable isotope studies
on cars, including one without catalytic converter (Nakagawa et al., 2005; Tsunogai et al., 2003), there is no clear evidence of thermal hydrogen or oxygen equilibration with H2O,
pos-sibly because of the overwhelming kinetic isotope fraction-ation during catalytic removal of CH4and CO. However, in
the exhaust of the car without catalytic converter, Tsunogai et al. (2003) find18O-depletion (but no13C depletion) in CO when the engine is still relatively cold compared to when it is hot. It remains unclear whether this could also be a ther-mal equilibration effect between CO and H2O, or, as the
au-thors hypothesize, the cold-start is characterized by an O2
depleted CO. It is possible that the biomass burning18O de-pletion in CO of colder smoldering combustion stages com-pared to hotter flaming stages (Tsunogai et al., 2003) could be partially caused by thermal equilibration processes with H2O or O2. Similarly, for biomass burning (R¨ockmann et al.,
2010), the isotopic depletion in D/H with increasingly poor combustion efficiency (1CO/1CO2) may ultimately be
par-tially related to temperature effects because poor combustion efficiency is generally related to lack of oxygen and hence to lower-temperature combustion.
Acknowledgements. We acknowledge partial support for this study by the European Union framework program FP6-2005-Global-4 (EuroHydros) and the “Competence Center for Energy and Mobility”, Switzerland (CCEM-CH). S. Walter was supported by
the project “H2budget” of the Dutch national science foundation
NWO (grant 816-01-001). Rolf Ziegler and Roland Graf have
significantly contributed to the experimental part of this study.
Edited by: P. O. Wennberg
References
Aalto, T., Lallo, M., Hatakka, J., and Laurila, T.: Atmospheric hy-drogen variations and traffic emissions at an urban site in Fin-land, Atmos. Chem. Phys., 9, 7387–7396, doi:10.5194/acp-9-7387-2009, 2009.
Affek, H. P. and Eiler, J. M.: Abundance of mass47CO2in urban
air, car exhaust, and human breath, Geochim. Cosmochim. Acta, 70, 1–12, doi:10.1016/j.gca.2005.08.021, 2006.
Auckenthaler, T. S.: Modelling and Control of Three-Way Catalytic Converters, Ph.D. Thesis, Swiss Federal Institute of Technology, Zurich, No. 16018, 2005.
Barnes, D. H., Wofsy, S. C., Fehlau, B. P., Gottlieb, E. W., Elkins, J. W., Dutton, G. S., and Novelli, P. C.: Hydrogen in the atmosphere: Observations above a forest canopy in a polluted environment, J. Geophys. Res., 108(D6), 4179 doi: 10.1029/2001JD001199, 2003.
Begemann, F. and Friedman, I.: Tritium and deuterium content of atmospheric hydrogen, Z. Naturforsch. A, 14, 1024–1031, 1959. Bond, S. W., Alvarez, R., Vollmer, M. K., Steinbacher, M.,
Weilen-mann, M., and ReiWeilen-mann, S.: Molecular hydrogen (H2) emissions
from gasoline and diesel vehicles, Sci. Tot. Environ., 408, 3596– 3606, 2010.
Bottinga, Y.: Calculated fractionation factors for carbon and hydro-gen isotope exchange in system calcite-carbon dioxide-graphite-methane-hydrogen-water vapor, Geochim. Cosmochim. Acta, 33, 49–64, 1969.
Brenninkmeijer, C. A. M., Janssen, C., Kaiser, J., R¨ockmann, T., Rhee, T. S., and Assonov, S. S.: Isotope effects in the chemistry of atmospheric trace compounds, Chem. Rev., 103, 5125–5161, doi:10.1021/cr020644k, 2003.
Br¨uhlmann, S.: Validierung H-Sense, Tech. Rep. unpublished, Empa, Swiss Federal Laboratories for Materials Testing and Re-search, 2004.
Chanton, J. P., Rutkowski, C. M., Schwartz, C. C., Ward, D. E., and Boring, L.: Factors influencing the stable carbon isotopic
signature of methane from combustion and biomass burning, J. Geophys. Res., 105(D2), 1867–1877, 2000.
Craig, H.: Standards for reporting concentrations of deuterium and oxygen-18 in natural waters, Science, 133, 1833–1834, 1961. Cramer, B., Poelchau, H. S., Gerling, P., Lopatin, N. V., and
Lit-tke, R.: Methane released from groundwater: the source of nat-ural gas accumulations in northern West Siberia, Marine Petrol. Geol., 16, 225–244, 1999.
D’Alleva, B. A. and Lovell, W. G.: Relation of exhaust gas compo-sition to air-fuel ratio, SAE Journal, 38, 90–98, 1936.
Ehhalt, D., Israel, G., Roether, W., and Stich, W.: Tritium and deuterium content of atmospheric hydrogen, J. Geophys. Res., 68(13), 3747–3751, 1963.
Ehhalt, D. H. and Rohrer, F.: The tropospheric cycle of H2:
a critical review, Tellus, Ser. B., 61, 500–535, doi:10.1111/j. 1600-0889.2009.00416.x, 2009.
Feilberg, K. L., Johnson, M. S., Bacak, A., R¨ockmann, T., and Nielsen, C. J.: Relative tropospheric photolysis rates of HCHO and HCDO measured at the European photoreactor facility, J. Phys. Chem. A, 111, 9034–9046, doi:10.1021/jp070185x, 2007. Friedman, I. and O’Neil, J. R.: Compilation of stable isotope frac-tionation factors of geological interest, in: Data of Geochemistry, Geological Survey Professional Paper 440-KK, 6th edn., KK1– KK12, 1977.
Gerst, S. and Quay, P.: Deuterium component of the global molec-ular hydrogen cycle, J. Geophys. Res., 106(D5), 5021–5031, 2001.
Gonfiantini, R.: Standards for stable isotope measurements in natu-ral compounds, Nature, 271, 534–536, 1978.
Gonsior, B. and Friedman, I.: Tritium and Deuterium im atmo-sph¨arischen Wasserstoff, Z. Naturforsch. A, 17, 1088–1091, 1962.
Hammer, S., Vogel, F., Kaul, M., and Levin, I.: The H2/CO
ra-tio of emissions from combusra-tion sources: comparison of top-down with bottom-up measurements in southwest Germany, Tel-lus, Ser. B., 61, 547–555, 2009.
Haryanto, A., Fernando, S. D., Filip To, S. D., Steele, P. H., Pordes-imo, L., and Adhikari, S.: Hydrogen production through the water-gas shift reaction: Thermodynamic equilibrium versus ex-perimental results over supported Ni catalysts, Energy Fuel., 23, 3097–3102, doi:10.1021/ef801076r, 2009.
Hauglustaine, D. A. and Ehhalt, D. H.: A three-dimensional model of molecular hydrogen in the troposphere, J. Geophys. Res., 107(D17), 4330, doi:10.1029/2001JD001156, 2002.
Kaiser, J., Brenninkmeijer, C. A. M., and R¨ockmann, T.:
In-tramolecular15N and18O fractionation in the reaction of N2O
with O(1D) and its implications for the stratospheric N2O
iso-tope signature, J. Geophys. Res., 107(D14), 4214, doi:10.1029/ 2001JD001506, 2002.
Leonard, L. S.: Fuel distribution by exhaust gas analysis, Society of automobile engineers, 379A, 1–22, 1961.
Nakagawa, F., Tsunogai, U., Komatsu, D. D., Yamada, K., Yoshida, N., Moriizumi, J., Nagamine, K., Iida, T., and Ikebe, Y.:
Auto-mobile exhaust as a source of13C- and D-enriched atmospheric
methane in urban areas, Organic Geochem., 36, 727–738, 2005. Novelli, P. C., Lang, P. M., Masarie, K. A., Hurst, D. F., Myers, R.,
Pieterse, G., Krol, M. C., and R¨ockmann, T.: A consistent molec-ular hydrogen isotope chemistry scheme based on an indepen-dent bond approximation, Atmos. Chem. Phys., 9, 8503–8529, doi:10.5194/acp-9-8503-2009, 2009.
Price, H., Jaegl´e, L., Rice, A., Quay, P., Novelli, P. C., and Gam-mon, R.: Global budget of molecular hydrogen and its deu-terium content: Constraints from ground station, cruise, and air-craft observations, J. Geophys. Res., 112, D22108, doi:10.1029/ 2006JD008152, 2007.
Rahn, T., Kitchen, N., and Eiler, J.: D/H ratios of atmospheric H2in
urban air: Results using new methods for analysis of nano-molar
H2 samples, Geochim. Cosmochim. Acta, 66(14), 2475–2481,
2002.
Rahn, T., Eiler, J. M., Boering, K. A., Wennberg, P. O., McCarthy, M. C., Tyler, S., Schauffler, S., Donnelly, S., and Atlas, E.: Ex-treme deuterium enrichment in stratospheric hydrogen and the
global atmospheric budget of H2, Nature, 424, 918–921, 2003.
Rhee, T. S., Mak, J., R¨ockmann, T., and Brenninkmeijer, C. A. M.: Continuous-flow isotope analysis of the deuterium/hydrogen ra-tio in atmospheric hydrogen, Rapid Commun. Mass Spectrom., 18, 299–306, 2004.
Rhee, T. S., Brenninkmeijer, C. A. M., and R¨ockmann, T.: The overwhelming role of soils in the global atmospheric hydrogen cycle, Atmos. Chem. Phys., 6, 1611–1625, doi:10.5194/acp-6-1611-2006, 2006.
R¨ockmann, T., Rhee, T. S., and Engel, A.: Heavy
hydro-gen in the stratosphere, Atmos. Chem. Phys., 3, 2015–2023, doi:10.5194/acp-3-2015-2003, 2003.
R¨ockmann, T., G´omez ´Alvarez, C. X., Walter, S., van der Veen,
C., Wollny, A. G., Gunthe, S., Helas, G., P¨oschl, U., Keppler, F., Greule, M., and Brand, W. A.: The isotopic composition of
H2from biomass burning-dependency on combustion efficiency,
moisture content andδD of local precipitation, J. Geophys. Res.,
in review, 2010.
Sala¨un, M., Kouakou, A., Da Costa, S., and Da Costa, P.: Syn-thetic gas bench study of a natural gas vehicle commercial cata-lyst in monolithic form: On the effect of gas composition, Appl. Catalys. B: Environmental, 88, 386–397, 2009.
Sanderson, M. G., Collins, W. J., Derwent, R. G., and Johnson, C. E.: Simulation of global hydrogen levels using a Lagrangian three-dimensional model, J. Atmos. Chem., 46, 15–28, 2003. Schimmelmann, A., Sessions, A. L., and Mastalerz, M.: Hydrogen
isotopic (D/H) composition of organic matter during diagenesis and thermal maturation, Ann. Rev. Earth Planet. Sci., 34, 501– 533, doi:10.1146/annurev.earth.34.031405.125011, 2006. Sch¨urch, M., Kozel, R., Schotterer, U., and Tripet, J.-P.:
Observa-tion of isotopes in the water cycle – the Swiss NaObserva-tional Network (NISOT), Environ. Geol., 45, 1–11, 2003.
Steinbacher, M., Fischer, A., Vollmer, M. K., Buchmann, B., Reimann, S., and Hueglin, C.: Perennial observations of
molec-ular hydrogen (H2) at a suburban site in Switzerland, Atm.
Envi-ron., 41, 2111–2124, doi:10.1016/j.atmosenv.2006.10.075, 2007. Toyoda, S., Yamamoto, S., Arai, S., Nara, H., Yoshida, N., Kashi-wakura, K., and Akiyama, K.: Isotopomeric characterization of
N2O produced, consumed, and emitted by automobiles, Rapid
Commun. Mass Spectrom., 22, 603–612, doi:10.1002/rcm.3400, 2008.
Tsunogai, U., Hachisu, Y., Komatsu, D. D., Nakagawa, F.,
Gamo, T., and Akiyama, K.: An updated estimation of
the stable carbon and oxygen isotopic compositions of auto-mobile CO emissions, Atmos. Environ., 37(35), 4901–4910, doi:10.1016/j.atmosenv.2003.08.008, 2003.
Vollmer, M. K., Juergens, N., Steinbacher, M., Reimann, S., Weilenmann, M., and Buchmann, B.: Road vehicle emissions of
molecular hydrogen (H2) from a tunnel study, Atmos. Environ.,
8355–8369, 41(37), doi:10.1016/j.atmosenv.2007.06.037, 2007. Walter, S. and et al.: Manuscript in preparation, 2010.