ACPD
12, 6839–6875, 2012Molecular hydrogen from residential
combustion
M. K. Vollmer et al.
Title Page
Abstract Introduction
Conclusions References
Tables Figures
◭ ◮
◭ ◮
Back Close
Full Screen / Esc
Printer-friendly Version Interactive Discussion
Discussion
P
a
per
|
Dis
cussion
P
a
per
|
Discussion
P
a
per
|
Discussio
n
P
a
per
|
Atmos. Chem. Phys. Discuss., 12, 6839–6875, 2012 www.atmos-chem-phys-discuss.net/12/6839/2012/ doi:10.5194/acpd-12-6839-2012
© Author(s) 2012. CC Attribution 3.0 License.
Atmospheric Chemistry and Physics Discussions
This discussion paper is/has been under review for the journal Atmospheric Chemistry and Physics (ACP). Please refer to the corresponding final paper in ACP if available.
Molecular hydrogen (H
2
) combustion
emissions and their isotope (D/H)
signatures from domestic heaters, diesel
vehicle engines, waste incinerator plants,
and biomass burning
M. K. Vollmer1, S. Walter2, J. Mohn1, M. Steinbacher1, S. W. Bond1, T. R ¨ockmann2, and S. Reimann1
1
Empa, Swiss Federal Laboratories for Material Science and Technology, Laboratory for Air Pollution and Environmental Technology, ¨Uberlandstrasse 129, 8600 D ¨ubendorf, Switzerland
2
Institute for Marine and Atmospheric research Utrecht, Utrecht University, Princetonplein 5, 3508TA Utrecht, The Netherlands
Received: 30 January 2012 – Accepted: 14 February 2012 – Published: 5 March 2012 Correspondence to: M. K. Vollmer (martin.vollmer@empa.ch)
ACPD
12, 6839–6875, 2012Molecular hydrogen from residential
combustion
M. K. Vollmer et al.
Title Page
Abstract Introduction
Conclusions References
Tables Figures
◭ ◮
◭ ◮
Back Close
Full Screen / Esc
Printer-friendly Version Interactive Discussion
Discussion
P
a
per
|
Dis
cussion
P
a
per
|
Discussion
P
a
per
|
Discussio
n
P
a
per
|
Abstract
Molecular hydrogen (H2), its stable isotope signature (δD), and the key combustion parameters carbon monoxide (CO), carbon dioxide (CO2), and methane (CH4) were measured from various combustion processes. H2in the exhaust of gas and oil-fired heaters and of waste incinerator plants was generally depleted compared to ambient 5
intake air, while CO was significantly elevated. These findings contradict the often assumed co-occurring net H2 and CO emissions in combustion processes and sug-gest that previous H2emissions from combustion may have been overestimated when scaled to CO emissions. For the heater exhausts, H2 andδD generally decrease with
increasing fuel-to-air ratio, from ambient values of ∼0.5 ppm and +130 ‰ to 0.2 ppm
10
and−206 ‰, respectively. These results are interpreted as a combination of an
isotopi-cally light H2source from fossil fuel combustion and a D/H kinetic isotope fractionation of hydrogen in the advected ambient air during its partial removal during combustion. Diesel exhaust measurements from dynamometer test stand driving cycles show el-evated H2 and CO emissions during cold-start and some acceleration phases. Their 15
molar H2/CO ratios are<0.25, significantly smaller than those for gasoline combustion. Using H2/CO emission ratios, along with CO global emission inventories, we estimate global H2 emissions for 2000, 2005, and 2010. For road transportation (gasoline and diesel), we calculate 8.6±2.1 Tg, 6.3±1.5 Tg, and 4.1±1.0 Tg, respectively, whereas
the contribution from diesel vehicles has increased from 5 % to 8 % over this time. Other 20
fossil fuel emissions are believed to be negligible but H2emissions from coal combus-tion are unknown. For residential (domestic) emissions, which are likely dominated by biofuel combustion, emissions for the same years are estimated at 2.7±0.7 Tg,
2.8±0.7 Tg, and 3.0±0.8 Tg, respectively. Our wood combustion measurements are
combined with results from the literature to calculate biomass burning emissions. For 25
ACPD
12, 6839–6875, 2012Molecular hydrogen from residential
combustion
M. K. Vollmer et al.
Title Page
Abstract Introduction
Conclusions References
Tables Figures
◭ ◮
◭ ◮
Back Close
Full Screen / Esc
Printer-friendly Version Interactive Discussion
Discussion
P
a
per
|
Dis
cussion
P
a
per
|
Discussion
P
a
per
|
Discussio
n
P
a
per
|
1 Introduction
The atmospheric budget of molecular hydrogen (H2) has recently gained increasing interest because of the ongoing discussion of a potential shift from our fossil fuel-based energy economy, to one that is fuel-based on H2 as an energy carrier. Such a shift could lead to increased anthropogenic emissions from leakage of H2, and therefore 5
potentially disturb the chemistry and physics of our atmosphere (Schultz et al., 2003; Warwick et al., 2004). A better understanding of the current anthropogenic contribution to the atmospheric H2 budget is a prerequisite for an assessment of potential future human impacts on the atmospheric H2cycle.
H2 is abundant in the atmosphere at an average mole fraction of ∼0.5 ppm (in dry
10
air, ppm=10−6) with seasonality and an inter-hemispheric gradient both driven by the source and sink patterns. The atmosphere has not shown any significant H2trend over the past 15 yr (Grant et al., 2010b).
The atmospheric budget of H2is characterized by several major sources and sinks (Table 1). Their estimated quantities are highly uncertain as seen in the large ranges re-15
ported in the literature (Novelli et al., 1999; Hauglustaine and Ehhalt, 2002; Sanderson et al., 2003; Rhee et al., 2006b; Price et al., 2007; Xiao et al., 2007; Ehhalt and Rohrer, 2009; Pieterse et al., 2011; Yver et al., 2011). The sources are dominated by the atmospheric photochemical production of H2 through dissociation of methane (CH4) and non-CH4 hydrocarbons (30–77 Tg yr−1), fossil fuel combustion and other
anthro-20
pogenic emissions (11–20 Tg yr−1), and biomass and biofuel burning (13–20 Tg yr−1). Microbially-induced H2 emissions from N2 fixation on land and in the oceans are es-timated at 0–6 Tg yr−1 and 3–6 Tg yr−1, respectively. The dominant sinks are the en-zymatic removal of H2 by soil (55–88 Tg yr−1) and the atmospheric removal through
reaction with OH (15–19 Tg yr−1). The atmospheric lifetime is estimated at 1.4–2 yr 25
(Novelli et al., 1999; Simmonds et al., 2000; Rhee et al., 2006b).
ACPD
12, 6839–6875, 2012Molecular hydrogen from residential
combustion
M. K. Vollmer et al.
Title Page
Abstract Introduction
Conclusions References
Tables Figures
◭ ◮
◭ ◮
Back Close
Full Screen / Esc
Printer-friendly Version Interactive Discussion
Discussion
P
a
per
|
Dis
cussion
P
a
per
|
Discussion
P
a
per
|
Discussio
n
P
a
per
|
signatures of the sources differ largely from one another, and the sink processes show relatively strong fractionations (Table 1). Isotope studies have revealed large deuterium enrichment in the stratosphere (Rahn et al., 2003; R ¨ockmann et al., 2003; Rhee et al., 2006a), which are a consequence of the strong isotope fractionation in H2removal and relatively D-enriched H2 that is formed photochemically from CH4 (Gerst and Quay, 5
2001; Feilberg et al., 2007; R ¨ockmann et al., 2010b; Nilsson et al., 2007, 2010). On the other hand, surface sources emit H2 that is very depleted in D (Gerst and Quay, 2001; Rahn et al., 2002b,a; R ¨ockmann et al., 2010a; Vollmer et al., 2010; Walter et al., 2011). These findings have helped to better constrain and understand the global H2 budget in combination with ground-based D/H observations and chemical-transport 10
models (Rice et al., 2010; Batenburg et al., 2011; Pieterse et al., 2011).
Combustion of fossil fuels is believed to be the major source of anthropogenic H2 emissions (e.g. Ehhalt and Rohrer, 2009). Most of the global estimates (Table 1) are derived indirectly by using emission ratios of H2 to carbon monoxide (CO) and com-bining these with CO emission inventories. This approach is based on the assumption 15
that both H2 and CO are products of incomplete combustion and that a constant in-trinsic relationship exists between the two compounds (e.g. based on the water-gas shift reaction). Recognizing that most of the anthropogenic emissions stem from road transport-based fossil fuel combustion, some studies have distinguished between ve-hicular and non-veve-hicular emissions. Novelli et al. (1999) derived transportation-based 20
emissions of 5–20 Tg yr−1 and non-vehicular emissions of 0.4–6 Tg yr−1, resulting in a global estimate of 15±10 Tg yr−1. Ehhalt and Rohrer (2009) derived mean values
of 8.6 Tg yr−1 for traffic emissions and 2.3 Tg yr−1 for non-traffic emissions, resulting in
11±4 Tg yr−1. Global traffic emissions were also estimated by Vollmer et al. (2007)
using multiple methods and resulted in 5–11 Tg yr−1 in 2000 and decreasing to 3– 25
5.5 Tg yr−1 by 2010. Bond et al. (2011a) estimate a decrease of H
ACPD
12, 6839–6875, 2012Molecular hydrogen from residential
combustion
M. K. Vollmer et al.
Title Page
Abstract Introduction
Conclusions References
Tables Figures
◭ ◮
◭ ◮
Back Close
Full Screen / Esc
Printer-friendly Version Interactive Discussion
Discussion
P
a
per
|
Dis
cussion
P
a
per
|
Discussion
P
a
per
|
Discussio
n
P
a
per
|
Driven by the CO ratio approach, recent studies have been conducted to better un-derstand the∆H2/∆CO ratios in fossil fuel combustion, where the ∆denotes the en-hancement over background expressed as mole fractions. A fleet-integrated traffic tunnel study in Switzerland revealed a mean∆H2/∆CO of 0.48 (Vollmer et al., 2007), and a∆H2/∆CO of 0.45 was found from samples taken close to traffic exhaust in Ger-5
many (Hammer et al., 2009). Several recent studies of atmospheric H2 and CO in Europe have also been used to derive anthropogenic urban ∆H2/∆CO (Steinbacher et al., 2007; Hammer et al., 2009; Aalto et al., 2009; Yver et al., 2009; Bond et al., 2011b; Grant et al., 2010a; Popa et al., 2011), whereas some of these studies fo-cussed on traffic emissions by selectively analysing the periods of rush-hour traffic. In 10
order to derive a pure emission ratio, a correction of the measured∆H2/∆CO was pro-posed by Hammer et al. (2009) to remove the influence of the soil sink. The observed ∆H2/∆CO increased from 0.33–0.43 to a narrow 0.47–0.49 in those urban studies, that have applied this correction (Hammer et al., 2009; Aalto et al., 2009; Yver et al., 2009). This is in close agreement with the results from the tunnel study (Vollmer et al., 2007). 15
However, slightly higher ∆H2/∆CO (without soil correction) have also recently been observed for the Bristol (United Kingdom) area by Grant et al. (2010a) (0.57±0.06)
and from the Cabauw tall tower in the Netherlands by Popa et al. (2011) (0.54±0.07).
In contrast to the approach by Hammer et al. (2009), Ehhalt and Rohrer (2009) as-sumed that the differences in lifetimes (essentially the rapid H2 removal by soil) is 20
negligible in suburban observations, and explained the lower observed urban ratios (compared to pure traffic) by the existence of a significant non-traffic fossil fuel source with a∆H2/∆CO of 0.2.
Many of the global estimates of H2 emissions combine biomass burning and bio-fuel combustion. These combined emissions were found to range between 13 and 25
20 Tg yr−1 (see summary by Ehhalt and Rohrer (2009)). Price et al. (2007)
ACPD
12, 6839–6875, 2012Molecular hydrogen from residential
combustion
M. K. Vollmer et al.
Title Page
Abstract Introduction
Conclusions References
Tables Figures
◭ ◮
◭ ◮
Back Close
Full Screen / Esc
Printer-friendly Version Interactive Discussion
Discussion
P
a
per
|
Dis
cussion
P
a
per
|
Discussion
P
a
per
|
Discussio
n
P
a
per
|
estimated by Yver et al. (2011) at 7.8 Tg yr−1 for mid-2006 to mid-2009. H2 emissions from biomass burning are also given by the Global Fire Emissions Database version 3 (GFED3, data set at http://www.globalfiredata.org/, see also Giglio et al. (2010) and Van der Werf et al. (2010)). These estimates were made for 1997 to 2010 ranging 5.3–12.6 Tg yr−1with a mean of 7.8 Tg yr−1. Various methods are used in the literature 5
to derive the emissions for biomass and biofuel burning, including the scaling of H2 to the amount of biomass burnt, to CO or CO2, or using an isotope budget analysis (see Ehhalt and Rohrer (2009) for a summary). The H2/CO from biomass burning has per-sistently been found to be lower compared to traffic combustion. Biomass burning field studies typically show∆H2/∆CO of 0.15–0.4 with the majority of the published data in 10
the narrow range of 0.2–0.3 (Crutzen et al., 1979; Cofer III et al., 1989, 1990, 1996; Laursen et al., 1992). Also, a recent study of controlled wood burning has shown a ∆H2/∆CO of 0.16±0.13 (R ¨ockmann et al., 2010a).
The present study aims to improve our understanding of the anthropogenic H2 emis-sions and their isotopic signature. We have experimentally investigated various poten-15
tial anthropogenic H2 sources. To our knowledge, these are the first published mea-surements of H2 in the exhaust of residential heaters and waste incinerator plants. A revision of the global H2emissions from combustion is suggested, including fossil fuel, biofuel, and biomass combustion. For the latter, we use H2/CO with updated biomass burning CO emissions and compare this approach with a new one based on H2/CH4. 20
Finally, temporal changes in these emissions are addressed, a topic that has so far received little attention in the literature.
2 Methods
2.1 Residential fossil fuel and wood heater
Exhaust samples from residential oil, gas, and wood burners were collected in Decem-25
ACPD
12, 6839–6875, 2012Molecular hydrogen from residential
combustion
M. K. Vollmer et al.
Title Page
Abstract Introduction
Conclusions References
Tables Figures
◭ ◮
◭ ◮
Back Close
Full Screen / Esc
Printer-friendly Version Interactive Discussion
Discussion
P
a
per
|
Dis
cussion
P
a
per
|
Discussion
P
a
per
|
Discussio
n
P
a
per
|
(see Supplement for more details on the sampling and analysis). With the exception of the open wood fire, all heater systems are designed to heat a water reservoir of a closed-water cycle that distributes the heat through the buildings by means of hot water radiators or hot water floor heating systems. The samples were drawn through PFA tubing and transferred into 2 l glass flasks (NORMAG, Illmenau, Germany), fitted 5
with 2 stopcocks, by means of a membrane pump (model N86-KTE, KNF Neuberger, Switzerland) to pressures of 1.8 bar. A drying cartridge containing magnesium perchlo-rate (Mg(ClO4)2) was fitted downstream of the pump to remove H2O from the samples in order to avoid isotopic exchange between H2 and H2O during storage of the sam-ples. The samples were stored in the dark and at room temperature before analysis on 10
various instruments.
The samples were taken from a large variety of burner types, fuel systems, and burning capacities. For each location, two samples (A and B) were taken typically
∼5 min apart. The sample pairs S-1 and S-2 (Table 2) were taken from oil burners
of single-family houses. A variety of natural gas burners were also sampled (S-3 to 15
S-7) ranging from single-family houses to larger building complexes. In addition to the fossil fuel-based heating systems, two wood-burning systems were also sampled. The samples S-8 were taken from a modern (2007) fully automated wood-pellet burning system of a 2-family house. The samples S-9 were taken from an indoor open fire place of a single family house, in which pieces of local beech were burnt. The samples 20
were drawn through an opening in the chimney system∼4 m above the fire. Finally,
ambient air samples were also collected during this campaign in order to determine approximate mole fractions of the air drawn for the combustion.
The samples were measured at Empa for H2and CO in February 2009, using a gas-chromatograph (GC) with a reduction gas analyzer (RGA-3, Trace Analytical) based 25
ACPD
12, 6839–6875, 2012Molecular hydrogen from residential
combustion
M. K. Vollmer et al.
Title Page
Abstract Introduction
Conclusions References
Tables Figures
◭ ◮
◭ ◮
Back Close
Full Screen / Esc
Printer-friendly Version Interactive Discussion
Discussion
P
a
per
|
Dis
cussion
P
a
per
|
Discussion
P
a
per
|
Discussio
n
P
a
per
|
by the analysis of a working standard that allowed quantification and short-term instru-mental drift correction. This working standard was referenced against the Max Planck Institute (MPI)-2009 primary calibration scale for H2(Jordan and Steinberg, 2011). The CO measurements were linked in a similar way to the NOAA/ESRL WMO-2000 cali-bration scale for CO. The mean measurement precisions were 0.6 % for H2and 0.4 % 5
for CO (as determined from repeated analyses). The overall accuracies, including calibration scale and nonlinearity uncertainties, are estimated at∼2 %. Some of the
samples’ H2 and/or CO exceeded the detector’s response or the range characterized for nonlinear system behavior. These samples were diluted using synthetic air, from which traces of H2 and CO were removed using a catalyst (Sofnocat 514, Molecular 10
Products, Thaxted, UK).
The samples were also analyzed (May 2009) on a GC (Agilent Technologies 6890N and controlled through GCWerks) equipped with a flame-ionization detector (FID) for CO and CH4. This instrument has linear detector response in the ambient mole frac-tion range as found through earlier experiments (Steinbacher and Vollmer, unpub-15
lished data). For the present work, measurements of two high mole fraction standards (2.01 ppm and 8.25 ppm, traced back to NIST SRM (Standard Reference Material) 2612a) revealed a slight CO nonlinearity at higher mole fractions, which was corrected. The measurement precisions were 0.2 % for CH4and 1.1 % for CO. CO measurements are reported on the WMO-2000 calibration scale (with NIST and WMO-2000 in very 20
close agreement, Zellweger et al., 2009) and CH4measurements are reported on the NOAA-2004 calibration scale (Dlugokencky et al., 2005). The overall accuracies, in-cluding calibration scale and nonlinearity uncertainties, are estimated at∼2 % for both
compounds.
In order to quantify CO2 in the exhaust samples, most samples were also analyzed 25
ACPD
12, 6839–6875, 2012Molecular hydrogen from residential
combustion
M. K. Vollmer et al.
Title Page
Abstract Introduction
Conclusions References
Tables Figures
◭ ◮
◭ ◮
Back Close
Full Screen / Esc
Printer-friendly Version Interactive Discussion
Discussion
P
a
per
|
Dis
cussion
P
a
per
|
Discussion
P
a
per
|
Discussio
n
P
a
per
|
integrating over 128 spectral scans and trace gas mole fractions were retrieved by clas-sical least square fitting in selected wavelength regions (Mohn et al., 2008). Calibration spectra were recorded under identical instrumental and spectroscopic conditions from certified and diluted calibration gases or by continuous injection of liquids into nitrogen. The expanded standard uncertainty (1σ) for CO2, CO, and CH4is∼5 %.
5
H2 mole fractions and stable isotope D/H analysis of H2 were conducted in March 2009 at the isotope laboratory of the Institute for Marine and Atmospheric research Utrecht (IMAU), Utrecht University, using isotope ratio mass spectrometry (Rhee et al., 2004). We report the isotope measurements using the “delta” notation,
δD=[(D/H)s/(D/H)VSMOW –1]×1000 ‰, where s refers to the sample and VSMOW
10
is Vienna Standard Mean Ocean Water used as reference (Craig, 1961; Gonfiantini, 1978). The mean absolute 1-σprecision is estimated at 4.5 ‰ (Batenburg et al., 2011).
As described in the previous paragraphs, H2, CO, and CH4were measured on sev-eral instruments. For those measurements that qualified for a comparison (within non-linearity ranges, well above detection limits), we found an agreement within a few per-15
cent for the various measurement techniques, even though many results were slightly outside the combined (1σ) measurement precisions. For the final values used in our analysis, we have selected measurements from individual instruments or aver-ages from two or more instruments. The selection was mainly based on choosing the measurements within the well-characterized nonlinearity ranges (RGA-3) and by ex-20
cluding some low-mole-fraction CH4 FTIR measurements for which more uncertainty was expected.
2.2 Waste incinerators
Exhaust gas was sampled at six Waste incinerator facilities throughout Switzerland. These incinerators are typically designed for the combustion of household and indus-25
ACPD
12, 6839–6875, 2012Molecular hydrogen from residential
combustion
M. K. Vollmer et al.
Title Page
Abstract Introduction
Conclusions References
Tables Figures
◭ ◮
◭ ◮
Back Close
Full Screen / Esc
Printer-friendly Version Interactive Discussion
Discussion
P
a
per
|
Dis
cussion
P
a
per
|
Discussion
P
a
per
|
Discussio
n
P
a
per
|
in 2008. A large set of incinerators was sampled from September 2010 to March 2011 by collection of integrated (1 week) dried (MD-070-24S-4, Perma Pure, USA) exhaust gas samples in Cali-5-BondTM sampling bags (GSB-P/44, Ritter Apparatebau, Ger-many). Some of these Tedlar bag samples were cryogenically transferred (>0.6 l min−1)
into evacuated stainless steel flasks and subsequently measured on the RGA-3 a few 5
days after transfer. Samples with CO mole fractions above 1.5 ppm were transferred directly from the Tedlar bags into a small (50 ml) stainless steel container, immediately diluted with purified (H2and CO free) synthetic air, and subsequently analyzed on the RGA-3. CO, CO2, and CH4were additionally analysed by FTIR spectroscopy.
The incinerator exhaust gas samples were stored in Tedlar bags less than two weeks 10
before transfer and/or analysis. In order to assess potential diffusive exchange/loss of H2 through the Tedlar bags during storage, a stability experiment was conducted that demonstrated sufficient storage stability over the course of our storage period, but showed significant enhancement of H2 and CO over a longer storage period (see Supplement).
15
2.3 Diesel-powered vehicles
Exhaust gas analysis from diesel-powered vehicles was conducted at Empa in 2008 as part of an extensive dynamometer test stand emission study that included H2 emis-sions, and that were part of a larger fleet study also including gasoline vehicles (Bond et al., 2010). This included the measurements of 5 light-duty diesel delivery vehicles 20
and 1 diesel passenger car, most of which were tested under 6 different driving cy-cles. All diesel vehicles were classified by the Euro-4 emission standards. All vehicles were equipped with oxidation catalysts and three had diesel particle filters. On-line direct exhaust measurements were conducted for a suite of compounds. H2was mea-sured using an on-line mass spectrometer (H-sense, V&F Analyse- und Messtechnik 25
ACPD
12, 6839–6875, 2012Molecular hydrogen from residential
combustion
M. K. Vollmer et al.
Title Page
Abstract Introduction
Conclusions References
Tables Figures
◭ ◮
◭ ◮
Back Close
Full Screen / Esc
Printer-friendly Version Interactive Discussion
Discussion
P
a
per
|
Dis
cussion
P
a
per
|
Discussion
P
a
per
|
Discussio
n
P
a
per
|
several hundred ppm), which occurred during all cold starts and during some of the acceleration phases. Hence our results are based on periods of emissions selected for their high emissions and they include the investigation of the H2/CO ratios, while the study by Bond et al. (2010) focused on the emissions factors covering the entire driving cycles and did not include the H2/CO ratio of diesel exhaust.
5
3 Results and discussion
3.1 H2and H2/CO
In this paper, we will exclusively use the molar H2/CO ratio and not the weight-based ratio, which is sometimes used in the literature (to convert from weight-based to mo-lar, multiply by 14). Also, we will distinguish between the ratio based on measured 10
mole fractions, here termed “absolute ratio”, and the ratio calculated after subtraction of the background mole fraction, which are typically found in the combustion intake air (H2≈0.5 ppm and CO≈0.2 ppm). We express the ratio for background corrected
values in the Delta (∆) notation (∆H2/∆CO). This distinction is important for the discus-sion of the many low-mole-fraction measurements in the present study, but becomes 15
negligible for high-mole-fraction source signals, when it is sometimes ignored in the following text. Analogously, we proceed with the molar ratio of H2/CH4and∆H2/∆CH4, and use CH4≈1.8 ppm as a typical background mole fraction.
3.1.1 Residential fossil fuel heater
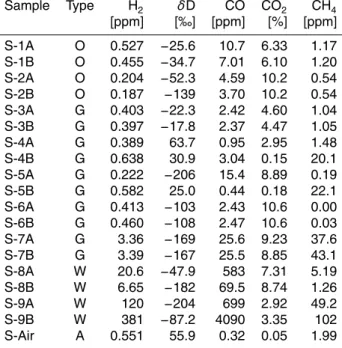
Our results are shown in Fig. 1 and listed in Table 2. Most of the heater exhaust sam-20
ples (S-1 to S-6) exhibit surprisingly low H2 mole fractions (in dry air) in the range 0.19–0.64 ppm (parts-per-million, 10−6), which is at or below the mole fractions of the ambient intake air (∼0.5 ppm). Thus many of the sampled heaters are net sinks for
ACPD
12, 6839–6875, 2012Molecular hydrogen from residential
combustion
M. K. Vollmer et al.
Title Page
Abstract Introduction
Conclusions References
Tables Figures
◭ ◮
◭ ◮
Back Close
Full Screen / Esc
Printer-friendly Version Interactive Discussion
Discussion
P
a
per
|
Dis
cussion
P
a
per
|
Discussion
P
a
per
|
Discussio
n
P
a
per
|
(1–15 ppm) compared to the measured ambient air (0.2–0.3 ppm). Consequently, the absolute H2/CO is small (Table 3), typically 0.05–0.2, even zero or negative when us-ing the∆ notation (differences to background). As an exception, H2was significantly elevated in S-7 (3.5 ppm), a natural gas-fueled residential heater. For this heater, CO and CH4were also largely elevated (Table 2), suggesting that the burner of this heater 5
may not have been adjusted properly.
3.1.2 Residential wood heater
In contrast to the oil and gas heater exhausts, both H2and CO are strongly elevated in the wood-based combustion samples, S-8, and S-9, with the highest H2mole fractions for the open wood fire place (S-9B, 390 ppm) during fast burning under a strong intake 10
air draft. For the wood pellet heater, H2 decreases from the starting phase of the burning (S-8A, 20.6 ppm) to the optimal burning phase (S-8B, 6.2 ppm) with similar air to fuel ratio for these two samples, as indicated by similar CO2mole fractions (Fig. 2). If we generally use CO2 as a proxy for combusted fuel, then our results indicate that modern wood pellet combustion systems reduce H2 and CO emissions compared to 15
less controlled open fires, but that they are still much larger than oil and natural gas-fueled combustion systems.
3.1.3 Waste incinerators
Exhaust gas mole fractions from waste incinerators were generally low, with near am-bient H2 mole fractions (0.3–0.9 ppm) and enhanced CO mole fractions (3–13 ppm). 20
This results in the absolute H2/CO of typically 0.05–0.1 (Table 3) and virtually zero or negative in the ∆notation (Fig. 1). Given that the sampled waste incinerators are equipped with a suite of sequential filter systems including electrostatic filters and flue gas scrubbers, the observed H2 and CO probably represent a strongly altered com-bustion signal. There are a few exceptions to the low-H2emissions. At plant I-2 much 25
ACPD
12, 6839–6875, 2012Molecular hydrogen from residential
combustion
M. K. Vollmer et al.
Title Page
Abstract Introduction
Conclusions References
Tables Figures
◭ ◮
◭ ◮
Back Close
Full Screen / Esc
Printer-friendly Version Interactive Discussion
Discussion
P
a
per
|
Dis
cussion
P
a
per
|
Discussion
P
a
per
|
Discussio
n
P
a
per
|
likely a result of a poor tuning of a post-filter heater (using natural gas as fuel) for NOx removal that this plant included at the time of the sampling. Additionally at three waste incinerators, individual weekly-integrated exhaust gas samples (I-4A, I-5B, I-8C) ex-hibited elevated H2 (∼4.8 ppm) and CO (∼10 ppm), two of the samples also showed
enhanced CH4(∼1.2 ppm) compared to all other plants (<0.5 ppm). 5
3.1.4 Diesel-powered vehicles
The dynamometer test stand online diesel exhaust measurement results shown in Fig. 1 are from the study of Bond et al. (2010), but limited to episodes selected for high H2 and CO emissions. We find H2/CO<0.25 (Table 3). The ratios at ∼0.01 are mainly those from the cold starts of the delivery vehicles while the ratios ∼0.2 are
10
those from high emission episodes during accelerations (but while engine and catalytic converter were hot) and from most cycles run with a passenger vehicle.
The H2/CO ratios observed for the diesel-powered vehicles are significantly smaller compared to that for gasoline-powered vehicles of 0.48±0.12 found during a tunnel
study (derived from the total fleet ratios by Vollmer et al., 2007) and of 1.0 (sub-cycle 15
means of 0.48–5.7) determined from a laboratory study on vehicles using exclusively modern combustion and exhaust treatment technology (Bond et al., 2010). Hence not only are the CO emissions from diesel powered engines smaller compared to gasoline powered engines, but also the H2/CO ratios, suggesting that the global H2 emissions from traffic are even more dominated by the gasoline-powered vehicles than the CO 20
emissions.
The lower H2and CO emissions and the lower H2/CO for diesel exhaust compared to that of gasoline are most likely related to the different types of combustion. In a modern gasoline engine, the air-fuel ratio (expressed asλ) is set to near 1, whereλ <1 is fuel-rich (excess fuel) andλ >1 is fuel-lean (excess oxygen). Under these conditions,
25
ACPD
12, 6839–6875, 2012Molecular hydrogen from residential
combustion
M. K. Vollmer et al.
Title Page
Abstract Introduction
Conclusions References
Tables Figures
◭ ◮
◭ ◮
Back Close
Full Screen / Esc
Printer-friendly Version Interactive Discussion
Discussion
P
a
per
|
Dis
cussion
P
a
per
|
Discussion
P
a
per
|
Discussio
n
P
a
per
|
conditions. It is likely that the oxidation of H2and CO by O2becomes an important sink for these two compounds, presumably with preferential removal of H2over CO thereby leading to the relatively low absolute H2/CO.
3.2 Relationship ofδD and H2to CO2
The isotopic signatures D/H of the heater exhaust samples were generally found to 5
be strongly depleted (Table 2), down toδD=−206 ‰, compared to ambient air levels
(δD≈+130 ‰). These isotopic signatures and the H2mole fractions vs. CO2are shown
in Fig. 2, along with the measurements from the waste incinerator exhaust samples. TheδD and the H2 mole fractions for the gas and oil heater samples both decrease
with increasing fuel-air ratio, represented by increasing CO2 mole fractions. These re-10
sults are difficult to interpret. At first glance, the decreasing H2mole fractions suggest that some of the H2in the intake air is removed during the combustion with increasing fuel-air ratio. Interestingly, if we extrapolate the linear fit in Fig. 2 to the maximum pos-sible CO2 mole fractions of 21 % (all oxygen consumed), then the H2 equals virtually zero (−0.002 ppm). However, if such a removal process was associated with a normal
15
(positive) kinetic isotope effect (KIE), as most chemical reactions are, then the δD of
the remaining H2 should increase. However, the opposite is observed with a strong depletion (reaching−325 ‰ if also linearly extrapolated to 21 % CO2). Only an inverse KIE could explain these observations. Inverse KIEs have been observed for catalyzed reactions involving hydrogen and carbon (e.g. Shi and Jin, 2011) but we were unable 20
to find data on the KIE of H2combustion. Alternatively, the observed strongly-depleted D/H could mainly manifest the D/H in the fuel (oil and natural gas generally contain strongly depleted D/H, see e.g. Schimmelmann et al., 2006). However, if the hydrogen in the fuel was a significant source (and if there were no sink), then the H2mole fraction should increase with increasing CO2 (i.e. with increasing amount of combusted fuel), 25
ACPD
12, 6839–6875, 2012Molecular hydrogen from residential
combustion
M. K. Vollmer et al.
Title Page
Abstract Introduction
Conclusions References
Tables Figures
◭ ◮
◭ ◮
Back Close
Full Screen / Esc
Printer-friendly Version Interactive Discussion
Discussion
P
a
per
|
Dis
cussion
P
a
per
|
Discussion
P
a
per
|
Discussio
n
P
a
per
|
1/H2=0), which is not the case for our samples. This leads us to suggest that the re-sults from our measurements of heater exhausts could be explained by either removal with an inverse KIE or concurrent production and removal processes – a source of H2 with significantly depleted D/H (typical combustion) and a simultaneous removal of H2 with a positive fractionation, which is, however, not large enough to compensate for the 5
depleted D/H source.
The samples from wood fires show no obvious relationship between δD and CO2
(Fig. 2) but generally theirδD values are lower than those of the oil and gas burner
samples. They show relatively high combustion efficiency (low molar (ppm ppm−1) CO/CO2 ratio, range 8×10⁻⁴–0.12) compared to other wood combustion results by
10
R ¨ockmann et al. (2010a), whereas some of our samples show relatively “heavy” δD (Fig. 3) compared to that study. Some of the waste incinerator samples (I-1) show the lowestδD observed during our study (−229 to−357 ‰) and low H2mole fractions
resulting in very different signatures in the “Keeling plot” (Fig. 3) compared to other combustion samples. By contrast, the incinerator results from I-2, where a post-filter 15
natural gas burner was installed, agree well with the 1/H2vs.δD results of other com-bustion processes (Fig. 3).
3.3 H2/CH4from heaters, incinerators, and biomass burning
Our measurements of CH4in the different exhausts show highly variable mole fractions (Fig. 4). While the wood combustion samples exhibit mole fractions of up to 100 ppm, 20
the heater samples and the waste incinerator samples show much lower mole frac-tions, and many of these are below the ambient air mole fractions of≈2 ppm. These
combustion processes are thus a net sink of CH4. Wood combustion and waste in-cinerator samples have molar H2/CH4 ranging approximately 1–4. In contrast, most fossil fuel heater samples show ratios<1. In Fig. 4 we also show H2/CH4from a
vari-25
ACPD
12, 6839–6875, 2012Molecular hydrogen from residential
combustion
M. K. Vollmer et al.
Title Page
Abstract Introduction
Conclusions References
Tables Figures
◭ ◮
◭ ◮
Back Close
Full Screen / Esc
Printer-friendly Version Interactive Discussion
Discussion
P
a
per
|
Dis
cussion
P
a
per
|
Discussion
P
a
per
|
Discussio
n
P
a
per
|
from our high-mole-fractions wood fire exhaust (2.4 and 3.9) bracket this ratio with reasonable agreement.
3.4 Implications on global H2emissions from combustion
Global H2 emissions from combustion can be estimated directly by using H2 emission factors, which are related to the combusted material (e.g. dry-weight or carbon con-5
tent), or by using combustion ratios to other trace gases (e.g. CO), and using their corresponding emission inventories. For H2, our understanding of both approaches is currently incomplete. Our goal is to improve our understanding of the H2/CO ratio approach (Table 3) and introduce the H2/CH4 approach. We estimate H2 emissions from transportation, residential combustion (fossil fuel and biofuel), and biomass burn-10
ing (Table 3). To deduce global emissions from H2 combustion, we base our analy-sis mainly on the inventories by Fulton and Eads (2004), by the Emission Database For Global Atmospheric Research (EDGARv4.2) project (Olivier et al., 2002), and by GFED3. The EDGAR emission inventories are presumably based on the United Na-tions Framework Convention on Climate Change (UNFCCC) common reporting format 15
(CRF) emission inventory – however, these lack emission information from many coun-tries not reporting to UNFCCC.
3.4.1 Transportation emissions
Road transport CO emissions have been undergoing large declines in recent decades (Fulton and Eads, 2004) due to improved combustion and catalytic converter technol-20
ogy. Fulton and Eads (2004) estimate total (gasoline and diesel) global road traffic CO emissions to decline from 270 Tg in 2000, to 200 Tg, 135 Tg, and 90 Tg in 2005, 2010, and 2015, respectively. While the road diesel CO contribution was reported very small in the 1980s (6 Tg yr−1 vs. 232 Tg yr−1 for gasoline, Duncan et al., 2007), the 2000s seem to show a less pronounced imbalance for these two fuel types. Fulton and 25
ACPD
12, 6839–6875, 2012Molecular hydrogen from residential
combustion
M. K. Vollmer et al.
Title Page
Abstract Introduction
Conclusions References
Tables Figures
◭ ◮
◭ ◮
Back Close
Full Screen / Esc
Printer-friendly Version Interactive Discussion
Discussion
P
a
per
|
Dis
cussion
P
a
per
|
Discussion
P
a
per
|
Discussio
n
P
a
per
|
∼40 Tg, 35 Tg, 30 Tg, and 25 Tg, respectively (sum of only freight trucks and buses).
Thus the relative contribution of CO emissions from diesel is steadily increasing, de-spite a marginally changing relative usage of the two fuel types, which are consumed in similar quantities (gasoline of 1.13×10¹²vs. diesel of 0.87×10¹²l gasoline-equ. for
2010, Fulton and Eads, 2004). These changes are likely caused by the large improve-5
ments in gasoline combustion clean-up technologies. For H2traffic emissions, we use the above estimates by Fulton and Eads (2004) and combining these with approxi-mated H2/CO ratios of 0.5±0.12 for gasoline and 0.15±0.1 for diesel (Table 3). The
differences of the estimates by Fulton and Eads (2004) to those by EDGAR (sector 1A3b, 206 Tg for 2000 and 155 Tg for 2005) suggests that there are large uncertainties 10
in the CO emissions, thus we assign an error of 25 % to the Fulton and Eads (2004) uncertainties. Results for the years 2000, 2005, and 2010 are given in Table 3 and show declining traffic H2 emissions and increasing relative contributions from diesel. Our traffic emission estimates are in agreement with those derived by Vollmer et al. (2007) and Bond et al. (2011a).
15
Our estimates are based on temporally constant H2/CO. However, a recent study by Bond et al. (2010) suggests that the average H2/CO could increase significantly with improved clean-up technologies (possibly to H2/CO≈1). Thus it is possible that the global H2 emissions from traffic may not decline as much as predicted here and by Vollmer et al. (2007), as declining CO and increasing H2/CO have some compensatory 20
effects. We have neglected this in our estimates and have assumed that these poten-tially larger H2/CO are not significantly penetrating the “world” fleet so soon, and also argue that their overall CO contributions are less because these emissions with poten-tially enhanced H2/CO are from vehicles with reduced overall H2and CO emissions.
Diesel H2 emissions are also expected to occur from diesel fuel use in water and 25
ACPD
12, 6839–6875, 2012Molecular hydrogen from residential
combustion
M. K. Vollmer et al.
Title Page
Abstract Introduction
Conclusions References
Tables Figures
◭ ◮
◭ ◮
Back Close
Full Screen / Esc
Printer-friendly Version Interactive Discussion
Discussion
P
a
per
|
Dis
cussion
P
a
per
|
Discussion
P
a
per
|
Discussio
n
P
a
per
|
H2 emissions are also expected to occur from diesel combustion for other purposes (e.g. power generation), but these are excluded here.
3.4.2 Domestic emissions (biofuel and fossil fuel)
The EDGAR CO inventory has one single highly-aggregated category “Residential and others” (1A4), which contains both emissions from fossil fuel (oil, gas, coal) and bio-5
fuel. This makes it impossible to identify the component that is solely due to oil and gas emissions. The UNFCCC CRF divide their category 1A4 (“other sectors”) into 3 sub-categories, where 1A4b (“residential”) CO emissions comprise the largest fraction of 1A4. By comparing the EDGAR and UNFCCC emissions with the study by Yevich and Logan (2003) on biofuel emissions, we conclude that the dominant fraction of residen-10
tial CO emissions in the developing world is from biofuel. Surprisingly, in industrialized countries, biofuel CO emissions may also play an important role compared to other emissions in the 1A4 category, even though in these countries, a large fraction of the residential energy usage derives from fossil fuel heating systems, particularly in colder climate regions. The difficulty in extracting the various subtypes of emitters in this cate-15
gory 1A4b is that most national emission inventories do not report on this level of detail. For Switzerland for example, residential 1A4b emissions of CO are 45 kt yr−1. However, the largest fraction (∼80 %) of these CO emissions derives from biofuel (wood)
burn-ing (for heatburn-ing) and from seemburn-ingly minor applications (∼8 %), such as gardening
tools (2-stroke engines) with very large CO emission factors. The oil and gas heat-20
ing systems’ CO emissions for Switzerland are comparably small (∼5 %), despite their
dominance from an energy perspective. While such disaggregated emissions are not available within the publicly available UNFCCC CRF and EDGAR inventories, it sup-ports our conclusion that on a global basis, the majority of the CO emissions from the “residential” sector are from biofuel combustion. On the basis of this finding, we adopt 25
ACPD
12, 6839–6875, 2012Molecular hydrogen from residential
combustion
M. K. Vollmer et al.
Title Page
Abstract Introduction
Conclusions References
Tables Figures
◭ ◮
◭ ◮
Back Close
Full Screen / Esc
Printer-friendly Version Interactive Discussion
Discussion
P
a
per
|
Dis
cussion
P
a
per
|
Discussion
P
a
per
|
Discussio
n
P
a
per
|
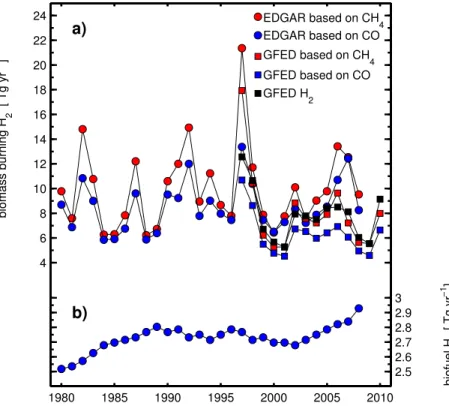
emissions from residential coal combustion are likely to be small compared to biofuel emissions (the biofuel CO emissions by Yevich and Logan (2003) nearly match the total “residential” emissions in EDGAR). However, here we assume that the corresponding H2 emissions are also small, i.e. that the H2/CO ratio of coal combustion is not sig-nificantly larger than that of biomass combustion. The EDGAR global estimates for 5
domestic CO emissions show a trend of increasing emissions with time, but with rel-atively little temporal variation, with a mean value of 153±5 Tg for 1980–2008 (Fig. 5
and Table 3). These convert to global H2emissions of 2.7±0.09 Tg. Here we omit
us-ing EDGAR CH4to derive H2emissions because in this sector, fugitive CH4emissions, presumably from leakage (with presumably insignificant corresponding H2emissions), 10
contribute strongly to the total CH4emissions of this sector. Our estimated emissions for this sector are smaller (but probably within the combined uncertainties) compared to the 4.4 Tg yr−1 for biofuel by Price et al. (2007) and the 4.8 Tg yr−1 by Ehhalt and Rohrer (2009) for unspecified years.
3.4.3 Biomass burning
15
For biomass burning, a 14-yr long H2emission record is available from GFED3, show-ing considerable temporal variability (Fig. 5). Here we test our conversions from the EDGAR and GFED3 CO and CH4emission inventories to H2emissions using the ear-lier discussed molar ratios of 0.25 for H2/CO and 3.3 for H2/CH4. The comparison of the GFED3 CH4-derived H2emissions compared to its H2emissions show a generally 20
good agreement and is to some degree a confirmation of using CH4as a proxy for H2in biomass combustion processes (Fig. 5). However, there is also some degree of circu-lar conclusion in this comparison because some of the data (e.g. Cofer III et al., 1989, 1990, 1996), which we have used in our derivation of H2/CH4are also indirectly used in GFED3 (Van der Werf et al., 2010) through the analysis of emission factors (Andreae 25
ACPD
12, 6839–6875, 2012Molecular hydrogen from residential
combustion
M. K. Vollmer et al.
Title Page
Abstract Introduction
Conclusions References
Tables Figures
◭ ◮
◭ ◮
Back Close
Full Screen / Esc
Printer-friendly Version Interactive Discussion
Discussion
P
a
per
|
Dis
cussion
P
a
per
|
Discussion
P
a
per
|
Discussio
n
P
a
per
|
records are available, the EDGAR CO and CH4emissions are considerably larger (30 to 40 %) than the respective GFED3 emissions, as are consequently the correspond-ing H2emissions. This discrepancy may possibly be caused by EDGAR adopting older GFED version 2 values, which are significantly higher than GFED3.
The GFED3 biomass burning H2 emission estimates are significantly lower (except 5
for the record year 1997) compared to the global H2emissions estimate from biomass burning by Laursen et al. (1992) of 21 Tg for an unspecified year. Our molar H2/CH4 ratio of 3.3 is also smaller compared to their ratio of 4.3, which we calculate from their H2and CH4emission estimates.
The scaling of H2 emissions to the CO emissions has been performed in earlier 10
studies with somewhat different ratios and CO emission inventories but yielding similar results, e.g. the study by Price et al. (2007). To our knowledge, this is the first time that H2emissions are scaled to CH4emissions using H2/CH4ratios.
The combined emissions from biomass and biofuel H2 combustion are at the lower end of the range found in the literature (Table 1), and the combined estimate of 15
8.4±1.6 Tg from 2000 is the lowest ever reported for this category.
4 Conclusions
Our study has attempted to fill some of the gaps in the knowledge of H2 emissions quantification from fossil fuel and biomass combustion. The low H2/CO from residential combustion processes should lead to a total urban H2/CO ratio lower than the traffic 20
related one. This “dilution” effect would presumably be seasonal, as heating systems are more strongly used during winter time. Thus, such an effect should be seen in multi-annual urban data records if CO emissions from heating are of similar magnitude as those from traffic. Even though there is confirmatory indication in the literature (Hammer et al., 2009; Aalto et al., 2009; Yver et al., 2009), with winter H2/CO ratios 25
ACPD
12, 6839–6875, 2012Molecular hydrogen from residential
combustion
M. K. Vollmer et al.
Title Page
Abstract Introduction
Conclusions References
Tables Figures
◭ ◮
◭ ◮
Back Close
Full Screen / Esc
Printer-friendly Version Interactive Discussion
Discussion
P
a
per
|
Dis
cussion
P
a
per
|
Discussion
P
a
per
|
Discussio
n
P
a
per
|
has a “diluting” effect on the overall gasoline-dominated ratio. However, because the absolute H2and CO emissions from a diesel engine are much smaller than those from a gasoline engine, it would require a very large diesel fraction of a vehicle fleet to significantly affect the gasoline-dominated ratio.
It remains to be investigated to what extent our findings of negligible H2 emissions 5
from oil and gas burners are applicable for similar burner/heater systems in other parts of the world. Our results suggest that the heater system (oil vs. natural gas) or the age and design are not of prime relevance, but mainly how well the burner is tuned. As for the low H2 emissions from our sampled waste incinerator plants, these results are unlikely applicable to less controlled incineration of waste, particularly in landfills. 10
Our analysis also reveals the lack of knowledge on H2emissions from coal combustion, which could potentially be a significant fossil fuel combustion source of H2. This may be one explanation for our estimated fossil fuel H2 emissions being considerably smaller compared to those by e.g. Yver et al. (2011) and Ehhalt and Rohrer (2009).
Our surprising findings of a lack of H2 emissions in the presence of CO emissions, 15
and the isotopic hydrogen signatures of these exhausts suggest that our understand-ing of the H2and CO involvement in these combustion processes is incomplete. More studies involving quantification of H2O, along with isotope analysis on the main H and C-containing compounds may help in this process. Combustion experiments with con-trolled (including zero) H2 mole fractions and isotope signatures in the advected air 20
could help to better understand the exhaust H2characteristics of fossil fuel burner sys-tems with low emissions.
Supplementary material related to this article is available online at: http://www.atmos-chem-phys-discuss.net/12/6839/2012/
acpd-12-6839-2012-supplement.pdf.
ACPD
12, 6839–6875, 2012Molecular hydrogen from residential
combustion
M. K. Vollmer et al.
Title Page
Abstract Introduction
Conclusions References
Tables Figures
◭ ◮
◭ ◮
Back Close
Full Screen / Esc
Printer-friendly Version Interactive Discussion
Discussion
P
a
per
|
Dis
cussion
P
a
per
|
Discussion
P
a
per
|
Discussio
n
P
a
per
|
Acknowledgements. We acknowledge all owners and managers of the sampled heating
sys-tems and incinerator syssys-tems for access to their buildings and for their generous support. Ker-stin Zeyer and Peter Honegger conducted some of the waste incinerator sampling and Robert Alvarez contributed to the diesel exhaust experiments. Christoph Zellweger provided support in CO calibration and measurements. Matthias Hill and Angelina Wenger provided
techni-5
cal assistance. Peter Salameh provided support with the chromatography software and the data processing. This study was also carried out under the auspices of EuroHydros (Eu-ropean Commission FP 6, Priority Global Change and Ecosystems) and the project “Transi-tion to Hydrogen-Based Transporta“Transi-tion” of the Swiss Competence Center Energy and Mobility (CCEM-CH). S. Walter was supported by the project “H2budget” of the Dutch national science
10
foundation NWO (grant 816-01-001).
References
Aalto, T., Lallo, M., Hatakka, T., and Laurila, T.: Atmospheric hydrogen variations and traffic emissions at an urban site in Finland, Atmos. Chem. Phys., 9, 7387–7396, doi:10.5194/acp-9-7387-2009, 2009. 6843, 6858
15
Andreae, M. O. and Merlet, P.: Emission of trace gases and aerosols from biomass burning, Global Biogeochem. Cy., 15, 955–966, 2001. 6857
Batenburg, A. M., Walter, S., Pieterse, G., Levin, I., Schmidt, M., Jordan, A., Hammer, S., Yver, C., and R ¨ockmann, T.: Temporal and spatial variability of the stable isotopic composition of atmospheric molecular hydrogen: observations at six EUROHYDROS stations, Atmos.
20
Chem. Phys., 11, 6985–6999, doi:10.5194/acp-11-6985-2011, 2011. 6842, 6847
Bond, S. W., Alvarez, R., Vollmer, M. K., Steinbacher, M., Weilenmann, M., and Reimann, S.: Molecular hydrogen (H2) emissions from gasoline and diesel vehicles, Sci. Tot. Environ., 408, 3596–3606, 2010. 6848, 6849, 6851, 6855
Bond, S. W., G ¨ul, T., Reimann, S., Buchmann, B., and Wokaun, A.: Emissions of anthropogenic
25
hydrogen to the atmosphere during the potential transition to an increasingly H2-intensive economy, Int. J. Hydrogen Energ., 36, 1122–1135, doi:10.1016/j.ijhydene.2010.10.016, 2011a. 6842, 6855
molec-ACPD
12, 6839–6875, 2012Molecular hydrogen from residential
combustion
M. K. Vollmer et al.
Title Page
Abstract Introduction
Conclusions References
Tables Figures
◭ ◮
◭ ◮
Back Close
Full Screen / Esc
Printer-friendly Version Interactive Discussion
Discussion
P
a
per
|
Dis
cussion
P
a
per
|
Discussion
P
a
per
|
Discussio
n
P
a
per
|
ular hydrogen (H2): observations at the high-altitude site Jungfraujoch, Switzerland, Tellus B., 63, 64–76, doi:10.1111/j.1600-0889.2010.00509.x, 2011b. 6843, 6845
Cofer III, W. R., Levine, J. S., Sebacher, D. I., Winstead, E. L., Riggan, P. J., Stocks, B. J., Brass, J. A., Ambrosia, V. G., and Boston, P. J.: Trace gas emissions from chaparral and boreal forest fires, J. Geophys. Res., 94, 2255–2259, 1989. 6844, 6853, 6857, 6870, 6874
5
Cofer III, W. R., Levine, J. S., Winstead, E. L., LeBel, P. J., Koller Jr., A. M., and Hinkle, C. R.: Trace gas emissions from burning Florida wetlands, J. Geophys. Res., 95, 1865–1870, 1990. 6844, 6853, 6857, 6870, 6874
Cofer III, W. R., Levine, J. S., Winstead, E. L., Cahoon, D. R., Sebacher, D. I., Pinto, J. P., and Stocks, B. J.: Source composition of trace gases released during African savanna fires, J.
10
Geophys. Res., 101, 23597–23602, 1996. 6844, 6853, 6857, 6870, 6874
Craig, H.: Standards for reporting concentrations of deuterium and oxygen-18 in natural waters, Science, 133, 1833–1834, 1961. 6847
Crutzen, P. J. Heidt, L. E., Krasnec, J. P., Pollock, W. H., and Seiler, W.: Biomass burning as a source of atmospheric gases CO, H2, N2O, NO, CH3Cl and COS, Nature, 282, 253–256,
15
1979. 6844
Dlugokencky, E. J., Myers, R. C., Lang, P. M., Masarie, K. A., Crotwell, A. M., Thoning, K. W., Hall, B. D., Elkins, J. W., and Steele, L. P.: Conversion of NOAA atmospheric dry air CH4 mole fractions to a gravimetrically prepared standard scale, J. Geophys. Res., 110, D18306, doi:10.1029/2005JD006035, 2005. 6846
20
Duncan, B. N., Logan, J. A., Bey, I., Megretskaia, I. A., Yantosca, R. M., Novelli, P. C., Jones, N. B., and Rinsland, C. P.: Gobal budget of CO, 1988–1997: Source estimates and validation with a global model, J. Geophys. Res., 112, D22301, doi:10.1029/2007JD008459, 2007. 6854
Ehhalt, D. H. and Rohrer, F.: The tropospheric cycle of H2: a critical review, Tellus B., 61, 500–
25
535, doi:10.1111/j.1600-0889.2009.00416.x, 2009. 6841, 6842, 6843, 6844, 6857, 6859, 6867
Ehhalt, D. H., Davidson, J. A., Cantrell, C. A., Friedman, I., and Tyler, S.: The kinetic isotope effect in the reaction of H2with OH, J. Geophys. Res., 94, 9831–9836, 1989. 6867
Feilberg, K. L., Johnson, M. S., Bacak, A., R ¨ockmann, T., and Nielsen, C. J.: Relative
tro-30
pospheric photolysis rates of HCHO and HCDO measured at the European photoreactor facility, J. Phys. Chem. A, 111, 9034–9046, doi:10.1021/jp070185x, 2007. 6842
aux-ACPD
12, 6839–6875, 2012Molecular hydrogen from residential
combustion
M. K. Vollmer et al.
Title Page
Abstract Introduction
Conclusions References
Tables Figures
◭ ◮
◭ ◮
Back Close
Full Screen / Esc
Printer-friendly Version Interactive Discussion
Discussion
P
a
per
|
Dis
cussion
P
a
per
|
Discussion
P
a
per
|
Discussio
n
P
a
per
|
illiary material to: Mobility 2030: Meeting the challenges to sustainability; the Sustainable Mobility Project, IEA/CRA, 2004. 6854, 6855
Gerst, S. and Quay, P.: Deuterium component of the global molecular hydrogen cycle, J. Geo-phys. Res., 106, 5021–5031, 2001. 6842, 6867, 6870
Giglio, L., Randerson, J. T., Van der Werf, G. R., Kasibhatla, P. S., Collatz, G. J., Morton, D. C.,
5
and DeFries, R. S.: Assessing variability and long-term trends in burned area by merging multiple satellite fire products, Biogeosciences, 7, 1171–1186, doi:10.5194/bg-7-1171-2010, 2010. 6844, 6870, 6875
Gonfiantini, R.: Standards for stable isotope measurements in natural compounds, Nature, 271, 534–536, 1978. 6847
10
Grant, A., Stanley, K. F., Henshaw, S. J., Shallcross, D. E., and O’Doherty, S.: High-frequency urban measurements of molecular hydrogen and carbon monoxide in the United Kingdom, Atmos. Chem. Phys., 10, 4715–4724, doi:10.5194/acp-10-4715-2010, 2010a. 6843
Grant, A., Witham, C. S., Simmonds, P. G., Manning, A. J., and O’Doherty, S.: A 15 year record of high-frequency, in situ measurements of hydrogen at Mace Head, Ireland, Atmos. Chem.
15
Phys., 10, 1203–1214, doi:10.5194/acp-10-1203-2010, 2010b. 6841
Hammer, S., Vogel, F., Kaul, M., and Levin, I.: The H2/CO ratio of emissions from combustion sources: comparison of top-down with bottom-up measurements in southwest Germany, Tellus B., 61, 547–555, 2009. 6843, 6858, 6870
Hauglustaine, D. A. and Ehhalt, D. H.: A three-dimensional model of molecular hydrogen in the
20
troposphere, J. Geophys. Res., 107, 4330, doi:10.1029/2001JD001156, 2002. 6841, 6867 Jordan, A. and Steinberg, B.: Calibration of atmospheric hydrogen measurements, Atmos.
Meas. Tech., 4, 509–521, doi:10.5194/amt-4-509-2011, 2011. 6846
Laursen, K. K., Hobbs, P. V., Radke, L. F., and Rasmussen, R. A.: Some trace gas emissions from North American biomass fires with an assessment of regional and global fluxes from
25
biomass burning, J. Geophys. Res., 97, 20687–20701, 1992. 6844, 6858, 6870
Mar, K. A., McCarthy, M. C., Connell, P., and Boering, K. A.: Modeling the photochemical origins of the extreme deuterium enrichtment in stratospheric H2, J. Geophys. Res., 112, D19302, doi:10.1029/2006JD007403, 2007. 6867
Mohn, J., Zeeman, M. J., Werner, R. A., Eugster, W., and Emmenegger, L.: Continuous field
30
measurements ofδ13C–CO2 and trace gases by FTIR spectroscopy, Isot. Environ. Health. Stud., 44, 241–251, doi:10.1080/10256010802309731, 2008. 6847
ACPD
12, 6839–6875, 2012Molecular hydrogen from residential
combustion
M. K. Vollmer et al.
Title Page
Abstract Introduction
Conclusions References
Tables Figures
◭ ◮
◭ ◮
Back Close
Full Screen / Esc
Printer-friendly Version Interactive Discussion
Discussion
P
a
per
|
Dis
cussion
P
a
per
|
Discussion
P
a
per
|
Discussio
n
P
a
per
|
Atmospheric deuterium fractionation: HCHO and HCDO yields in the CH2DO+O2reaction, Atmos. Chem. Phys., 7, 5873–5881, doi:10.5194/acp-7-5873-2007, 2007. 6842
Nilsson, E. J. K., Andersen, V. F., Skov, H., and Johnson, M. S.: Pressure dependence of the deuterium isotope effect in the photolysis of formaldehyde by ultraviolet light, Atmos. Chem. Phys., 10, 3455–3463, doi:10.5194/acp-10-3455-2010, 2010. 6842
5
Novelli, P. C., Lang, P. M., Masarie, K. A., Hurst, D. F., Myers, R., and Elkins, J. W.: Molecular hydrogen in the troposphere: global distribution and budget, J. Geophys. Res., 104, 30427– 30444, 1999. 6841, 6842, 6867
Olivier, J. G. J., Berdowski, J. J. M., Peter, J. A. H. W., Bakker, J., Visschedijk, A. J. H., and Bloos, J. P. J.: Applications of EDGAR emission database for global atmospheric research,
10
Tech. Rep. RIVM report no. 773301001; NOP report no. 410200051, RIVM, Bilthoven, The Netherlands, 2002. 6854, 6875
Pieterse, G., Krol, M. C., Batenburg, A. M., Steele, L. P., Krummel, P. B., Langenfelds, R. L., and R ¨ockmann, T.: Global modelling of H2mixing ratios and isotopic compositions with the TM5 model, Atmos. Chem. Phys., 11, 7001–7026, doi:10.5194/acp-11-7001/2011, 2011. 6841,
15
6842, 6867
Popa, M. E., Vermeulen, A. T., van den Bulk, W. C. M., Jongejan, P. A. C., Batenburg, A. M., Zahorowski, W., and R ¨ockmann, T.: H2 vertical profiles in the continental boundary layer: measurements at the Cabauw tall tower in the Netherlands, Atmos. Chem. Phys., 11, 6425– 6443, doi:10.5194/acp-11-6425-2011, 2011. 6843
20
Price, H., Jaegl ´e, L., Rice, A., Quay, P., Novelli, P. C., and Gammon, R.: Global budget of molecular hydrogen and its deuterium content: Constraints from ground station, cruise, and aircraft observations, J. Geophys. Res., 112, D22108, doi:10.1029/2006JD008152, 2007. 6841, 6843, 6857, 6858, 6867
Rahn, T., Eiler, J. M., Kitchen, N., Fessenden, J. E., and Randerson, J. T.: Concentration and
25
deltaD of molecular hydrogen in boreal forests: Ecosystem-scale systematics of atmospheric H2, Geophys. Res. Lett., 29, 1888, doi:10.1029/2002GL015118, 2002a. 6842, 6873
Rahn, T., Kitchen, N., and Eiler, J.: D/H ratios of atmospheric H2 in urban air: Results using new methods for analysis of nano-molar H2samples, Geochim. Cosmochim. Acta, 66, 2475– 2481, 2002b. 6842, 6867, 6870
30
ACPD
12, 6839–6875, 2012Molecular hydrogen from residential
combustion
M. K. Vollmer et al.
Title Page
Abstract Introduction
Conclusions References
Tables Figures
◭ ◮
◭ ◮
Back Close
Full Screen / Esc
Printer-friendly Version Interactive Discussion
Discussion
P
a
per
|
Dis
cussion
P
a
per
|
Discussion
P
a
per
|
Discussio
n
P
a
per
|
Rhee, T. S., Mak, J., R ¨ockmann, T., and Brenninkmeijer, C. A. M.: Continuous-flow isotope analysis of the deuterium/hydrogen ratio in atmospheric hydrogen, Rapid Commun. Mass Spectrom, 18, 299–306, 2004. 6847
Rhee, T. S., Brenninkmeijer, C. A. M., Braß, M., and Br ¨uhl, C.: Isotopic composition of H2from CH4 oxidation in the stratosphere and the troposphere, J. Geophys. Res., 111, D23303,
5
doi:10.1029/2005JD006760, 2006a. 6842, 6867
Rhee, T. S., Brenninkmeijer, C. A. M., and R ¨ockmann, T.: The overwhelming role of soils in the global atmospheric hydrogen cycle, Atmos. Chem. Phys., 6, 1611–1625, doi:10.5194/acp-6-1611-2006, 2006b. 6841, 6867
Rice, A., Quay, P., Stutsman, J., Gammon, R., Price, H., and Jaegl ´e, L.: Meridional distribution
10
of molecular hydrogen and its deuterium content in the atmosphere, J. Geophys. Res., 115, D12306, doi:10.1029/2009JD012529, 2010. 6842
R ¨ockmann, T., Rhee, T. S., and Engel, A.: Heavy hydrogen in the stratosphere, Atmos. Chem. Phys., 3, 2015–2023, doi:10.5194/acp-3-2015-2003, 2003. 6842, 6867
R ¨ockmann, T., G ´omez ´Alvarez, C. X., Walter, S., van der Veen, C., Wollny, A. G., Gunthe, S. S.,
15
Helas, G., P ¨oschl, U., Keppler, F., Greule, M., and Brand, W. A.: Isotopic composition of H2from biomass burning a dependence on combustion efficiency, moisture content andδD of local precipitation, J. Geophys. Res., 115, D17308, doi:10.1029/2009JD013188, 2010a. 6842, 6844, 6853, 6873
R ¨ockmann, T., Walter, S., Bohn, B., Wegener, R., Spahn, H., Brauers, T., Tillmann, R.,
20
Schlosser, E., Koppmann, R., and Rohrer, F.: Isotope effect in the formation of H2 from H2CO studied at the atmospheric simulation chamber SAPHIR, Atmos. Chem. Phys., 10, 5343–5357, doi:10.5194/acp-10-5343-2010, 2010b. 6842
Sander, S. P., Friedl, R. R., Ravishankara, A. R., Golden, D. M., Kolb, C. E., Kurylo, M. J., Molina, M. J., Moortgat, G. K., Keller-Rudek, H., Finlayson-Pitts, B. J., Wine, P. H., Huie,
25
R. E., and Orkin, V. L.: Chemical Kinetics and Photochemical Data for Use in Atmospheric Studies, Evaluation Number 15 of the NASA Panel for Data Evaluation, JPL Publication 06-2, Jet Propulsion Laboratory, Pasadena, 2006. 6867
Sanderson, M. G., Collins, W. J., Derwent, R. G., and Johnson, C. E.: Simulation of global hydrogen levels using a Lagrangian three-dimensional model, J. Atmos. Chem., 46, 15–28,
30
2003. 6841, 6867

![Table 2. Continued. Sample Type H 2 δ D CO CO 2 CH 4 [ppm] [‰] [ppm] [%] [ppm] I-1A I 0.383 − 229 7.54 8.80 – I-1B I 0.344 − 308 7.54 8.80 – I-1C I 0.367 – 5.03 9.60 – I-1D I 0.616 −357 4.05 9.70 – I-1E I 0.341 – – – – I-2A I 1.99 −173 30.6 9.40 – I-2B I 2](https://thumb-eu.123doks.com/thumbv2/123dok_br/17030346.233018/31.918.183.527.77.630/table-continued-sample-type-ch-ppm-ppm-ppm.webp)
![Table 3. Molar [ppm ppm −1 ] ratios of molecular hydrogen (H 2 ) to carbon monoxide (CO), to methane (CH 4 ), and isotopic signatures ( δ D-H 2 ) for selected combustion processes](https://thumb-eu.123doks.com/thumbv2/123dok_br/17030346.233018/32.918.43.669.217.377/molecular-hydrogen-monoxide-isotopic-signatures-selected-combustion-processes.webp)