*e-mail: [email protected]
Effect of Carbon Dioxide and Temperature on Passive Film
Parameters of Superduplex Stainless Steel
Emandro Vieira da Costaa, Thiago José Mesquitab, Ariane Ferreiraa,
Ricardo Pereira Nogueirab, Ivan Napoleão Bastosa*
aPolytechnic Institute − IPRJ, Rio de Janeiro State University – UERJ,
CEP 28625-570, Nova Friburgo, RJ, Brazil
bLaboratoire d’Electrochimieet de Physicochimie des Matériaux et des Interfaces–LEPMI, Grenoble
INP – Grenoble Institute of Technology, Université de Savoie, UMR5279 CNRS, Chambéry, France, Université Joseph Fourier – UJF, BP 75, 38402 St Martin d’Hères, France
Received: November 27, 2012; Revised: January 17, 2013
Superduplex stainless steel has been frequently employed in new sites of Brazilian Pre-Salt. In these environments, chloride concentration, temperature and carbon dioxide are normally present in higher levels than those at sea water at room temperature. In these conditions, it is expected that the passive films of stainless steel also show modifications. To better understand such modifications, samples of superduplex stainless steel UNS S32750 were submitted to electrochemical impedance measurements in brine media, at two temperatures and under presence/absence of carbon dioxide. The electrochemical impedance results were initially tested using the Kramers-Kronig transform and subsequently fitted by equivalent circuit employing constant phase elements - CPE. Moreover, to quantify the effect of each factor (temperature, chloride, carbon dioxide and microstructure) on the equivalent circuit, their parameters were tested applying statistical analysis. Significant effect of carbon dioxide and temperature was found on related parameters of passive film for heat-treated samples.
Keywords: superduplex stainless steel, electrochemical impedance, equivalent circuit, carbon dioxide, heat-treatments
1. Introduction
Commercial companies face challenging situations when exploiting oil and gas in offshore fields whose access is difficult and the environment may be extremely aggressive. Hydrocarbon sources existing on Brazilian Pre-Salt, for example, present temperature and salinity, besides harmful gas, in which the use of ordinary carbon steels become unfeasible since the corrosion effect is intensified by the local conditions. Another aggressive factor is the presence of carbon dioxide that promotes the pH reduction due to the H2CO3 formation1 and it well-known to be a major problem in corrosion behavior of iron based alloys2-6. An alternative is the use of corrosion resistant alloys like superduplex stainless steel that exhibit high corrosion resistance and good mechanical properties2. Such alloys have thin passive film, essentially constituted by Cr2O3, cohesive and self-regenerative, which is responsible for the excellent corrosion resistance7. The superduplex stainless steel shows, in addition to excellent pitting resistance number, small grain of austeno-ferritic microstructure and alloy elements as Cr, Mo, N and Ni, which assure superior properties8. Nevertheless, the heat-treatments used during the production of equipments may cause the precipitations of deleterious intermetallic components like sigma phase, making the steel more susceptible to localized corrosion2.
To better understand the passive film behavior of superduplex stainless steel at different conditions of environment and microstructure, measurements of electrochemical impedance spectroscopy (EIS) were performed. Such technique comprises applying a small amplitude potential excitation signal to the interface at different frequencies and registering the corresponding linear current response.The ratio between the Fourier or Laplace transforms of the applied perturbation and response signal defines the impedance9. Once the experimental diagrams of electrochemical impedance are obtained, it is possible to fit them with the help of equivalent electric circuits, EEC, comprising elements like resistors, capacitors and others. The overall electrical impedance of these EECs hence matches those of experimental electrochemical measurements. Moreover, each element from equivalent circuit must be related to physical aspects of the studied sample, if possible. In the present paper, the parameters of equivalent circuit were evaluated in order to investigate the effects of temperature, carbon dioxide, salinity and heat-treatment on the passive film of UNS S32750 stainless steel.
2. Material and Methods
Table 1. Numbers 1 and 2 stand for the two heat-treatments performed at 800°C for 15 minutes or 2 hours respectively. Table 2 presents the nominal chemical composition of UNS S32750. Figure 1 shows the microstructures of heat-treated stainless steels during 15 minutes (a) and 2 hours (b). Sample of Figure 1a (15 min) presents incipient intergranular sigma precipitates that were clearly observed at the alpha/gamma interface, while sample 1b (2 hours) reveals considerable amount of sigma phase.
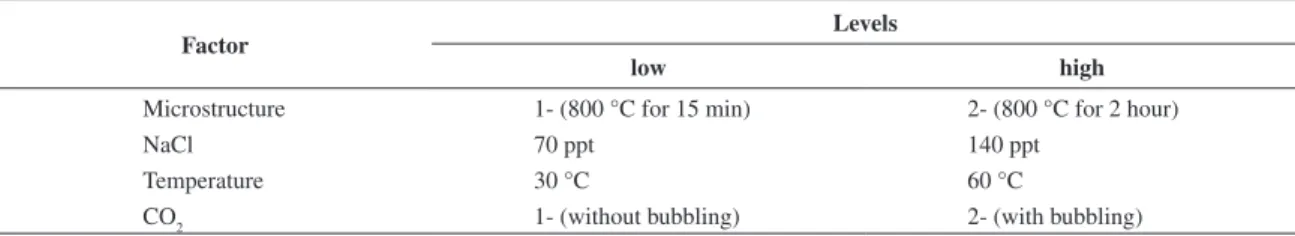
The first heat-treatment simulates welding processes and the second mechanical hot-work process1. For the CO
2 factor, number 1 represents the absence of gas whilst number 2 its presence. The NaCl factor comprises the electrolytic solution of sodium chloride used in concentrations of 70 and 140 ppt (parts per thousand, simulating the high concentration of chloride that can be found in regions of the Brazilian Pre-Salt layer). Finally, the working temperatures were 30 and 60 °C thermostated thanks to a double wall electrochemical cell.
2.1.
Kramers-Kronig transforms
The increase of EIS technique use in diverse systems results in the appearance of a vast variety of spectra, making it difficult to evaluate, by simple inspection, if the results are valid or contains some experimental errors. The Kramers-Kronig (KK) transformations are performed to validate EIS experimental according to four conditions10. The condition of
causality demands that the system response is only sensible to the imposed perturbation; the linearity implies the use of sufficiently small amplitudes, about 10 mV, to assure tha tresponse is independent of perturbation amplitude but linear; the stability requires that the system return to its initial condition when the perturbationis ceased; and finally, the impedance must be a continuous function with finite values to any frequency, including frequencies close to zero or infinite.
If the four conditions above are obeyed, then the following Kramers-Kronig equations are valid10.
2 2
0
( ) ( )
2
( ) ( ) im im
re re
xZ x Z
Z Z dx
x
∞ − ω ω
ω = ∞ +
π ∫ − ω (1)
2 2
0
( ) ( ) 2
( ) re re
im
Z x Z
Z dx
x
∞ − ω
− ω
ω = π ∫ − ω (2)
2 2
0
ln ( ) 2
( ) Z x dx
x
∞ ω
θ ω = π∫ − ω (3)
Where ω is the angular frequency (ω= 2πf) and the others are defined as usual for EIS.
Equations 1, 2 and 3 allow recalculating the components of impedance values from the EIS experiments results and therefore evaluate their validity. In the present paper the
Table 1. Experimental conditions.
Factor
Levels
low high
Microstructure 1- (800 °C for 15 min) 2- (800 °C for 2 hour)
NaCl 70 ppt 140 ppt
Temperature 30 °C 60 °C
CO2 1- (without bubbling) 2- (with bubbling)
Table 2. Chemical composition of UNS S32759 stainless steel (%mass)8.
C Cr Ni Mo N Mn S P Si Cu
0.020 24.6 6.68 3.8 0.26 0.83 0.001 0.026 0.34 0.25
EIS300 Electrochemical Impedance Spectroscopy software was used for KK analysis.
2.2.
Equivalent circuit for stainless steel
After some fitting attempts of impedance diagrams using different equivalent circuit models, the one that better represented the experiments results is shown in Figure 2 and was already performed in literature to represent stainless steels interface11,12. This circuit was implemented with in ZView 3.2c software. A constant phase element (CPE) circuitry was utilized, and its individual impedance formula is represented in Equation 4
1 ( )
CPE
Z
j αQ
=
ω (4)
Where α and Q are CPE parameters and j is the imaginary coefficient. The physical meaningof this element changes according to α values. If α = 1 CPE behaves like a capacitor and the parameter Q is then equivalent to a capacitor C. When α < 1 the system shows a behavior that has been frequently attributed to metal surface heterogeneity13 even if several other causes for CPE behavior to appear have been proposed14. When α = 0.5 CPE is equivalent to Warburg element that is performed to represent diffusion processes, and if α = 0 CPE behaves like a resistor11,12.
The meaning of elements used in equivalent circuit is related hereafter according to literature11,12. R
Ω represents
the electrolyte resistance, Q1 represents the capacitive behavior of passive film and R1 the resistance of ionic flux, Q2 represents the capacitive behavior of the metal interface and R2 the charge transfer resistance.
2.3.
Statistical analysis
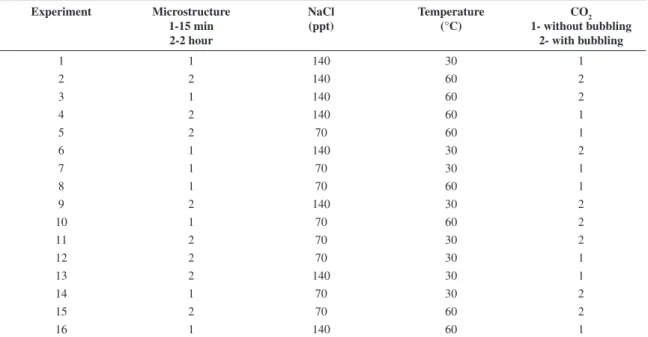
In order to optimize the evaluation process of experimental results, the Statgraphics Centurion XVI software was used to perform the full factorial analysis of the 24 orthogonal experimental design. The microstructure and CO2 factors were classified as qualitative and the NaCl and temperature factors were classified as quantitative, as shown in Table 1. The statistical analysis reveals the individual effects, as well as its synergisms, and the significances. The experimental runs were entitled as 1 to 16 according to their conditions, as presented in Table 3.
3. Results and Discussion
The results of KK analysis suggested that the EIS experiments obeyed the four necessary conditions to validate the electrochemical impedance measurements since the associated errors were acceptable. The values of goodness of fit provided by software were between 17 × 10–6 for experiment 4 and 455 × 10–6 for experiment 14. Figure 3
Table 3. Experimental running.
Experiment Microstructure 1-15 min 2-2 hour
NaCl (ppt)
Temperature (°C)
CO2 1- without bubbling
2- with bubbling
1 1 140 30 1
2 2 140 60 2
3 1 140 60 2
4 2 140 60 1
5 2 70 60 1
6 1 140 30 2
7 1 70 30 1
8 1 70 60 1
9 2 140 30 2
10 1 70 60 2
11 2 70 30 2
12 2 70 30 1
13 2 140 30 1
14 1 70 30 2
15 2 70 60 2
16 1 140 60 1
graphically depicts the KK results by Bode and Nyquist diagrams taking experiment 9 as an example since the goodness of its fit falls by the middle of the determined range (288 × 10–6). The residual errors from real and imaginary impedances are dependent on frequency15 but were small and fluctuated around zero which qualitatively corroborates the goodness of the results.
Besides the similarity between the experimental data and KK fitting observed on Bode and Nyquist diagrams, was also noted, in all experiments, that the residuals errors from real and imaginary impedances were higher in low frequencies between 10–3 and 10–2 Hz. This behavior is due to the passive film evolution and could be normally expected.
The equivalent circuit from Figure 2 was able to fit the EIS experimental results with good precision. The χ2 (chi-square)
deviation values presented order-of-magnitude of 10–4 as shown in Table 3 and are in accordance with literature11. In Figure 4 are presented the Bode and Nyquist diagrams of equivalent circuit fitting for experiment 1. For the sake of conciseness, the other diagrams are not showed.
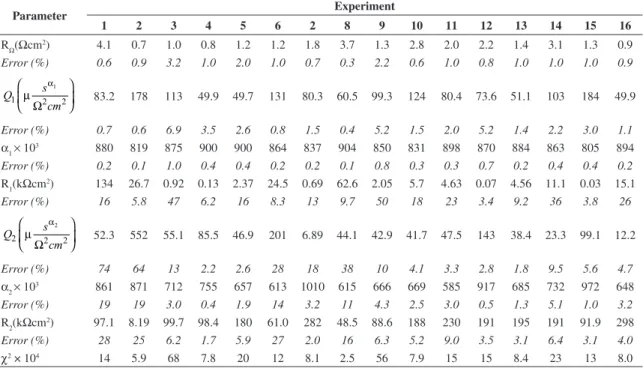
Table 4 summarizes the fitting values of parameters used in equivalent circuit and the respective errors for the 16 experiments. The RΩ, Q1 and α1 parameters presented the smallest errors and maintained such values low in all performed fitting. The other parameters showed, in average, error values slightly higher, notwithstanding in some situations such values had been considerable higher as the Q2 parameter of experiment 1 and 2, and R1 for experiment 9.
To a significance level of 5% the factorial analysis exhibited statistically significant variation to Q1, α1 and
Table 4. Fitting of equivalent circuit parameters.
Parameter Experiment
1 2 3 4 5 6 2 8 9 10 11 12 13 14 15 16
RΩ(Ωcm2) 4.1 0.7 1.0 0.8 1.2 1.2 1.8 3.7 1.3 2.8 2.0 2.2 1.4 3.1 1.3 0.9
Error (%) 0.6 0.9 3.2 1.0 2.0 1.0 0.7 0.3 2.2 0.6 1.0 0.8 1.0 1.0 1.0 0.9
1
1 2 2
s Q
cm
α
µ
Ω
83.2 178 113 49.9 49.7 131 80.3 60.5 99.3 124 80.4 73.6 51.1 103 184 49.9
Error (%) 0.7 0.6 6.9 3.5 2.6 0.8 1.5 0.4 5.2 1.5 2.0 5.2 1.4 2.2 3.0 1.1
α1 × 10
3 880 819 875 900 900 864 837 904 850 831 898 870 884 863 805 894
Error (%) 0.2 0.1 1.0 0.4 0.4 0.2 0.2 0.1 0.8 0.3 0.3 0.7 0.2 0.4 0.4 0.2
R1(kΩcm2) 134 26.7 0.92 0.13 2.37 24.5 0.69 62.6 2.05 5.7 4.63 0.07 4.56 11.1 0.03 15.1
Error (%) 16 5.8 47 6.2 16 8.3 13 9.7 50 18 23 3.4 9.2 36 3.8 26
2
2 2 2
s Q
cm
α
µ
Ω
52.3 552 55.1 85.5 46.9 201 6.89 44.1 42.9 41.7 47.5 143 38.4 23.3 99.1 12.2
Error (%) 74 64 13 2.2 2.6 28 18 38 10 4.1 3.3 2.8 1.8 9.5 5.6 4.7
α2 × 10
3 861 871 712 755 657 613 1010 615 666 669 585 917 685 732 972 648
Error (%) 19 19 3.0 0.4 1.9 14 3.2 11 4.3 2.5 3.0 0.5 1.3 5.1 1.0 3.2
R2(kΩcm
2) 97.1 8.19 99.7 98.4 180 61.0 282 48.5 88.6 188 230 191 195 191 91.9 298
Error (%) 28 25 6.2 1.7 5.9 27 2.0 16 6.3 5.2 9.0 3.5 3.1 6.4 3.1 4.0
χ2 × 10⁴ 14 5.9 68 7.8 20 12 8.1 2.5 56 7.9 15 15 8.4 23 13 8.0
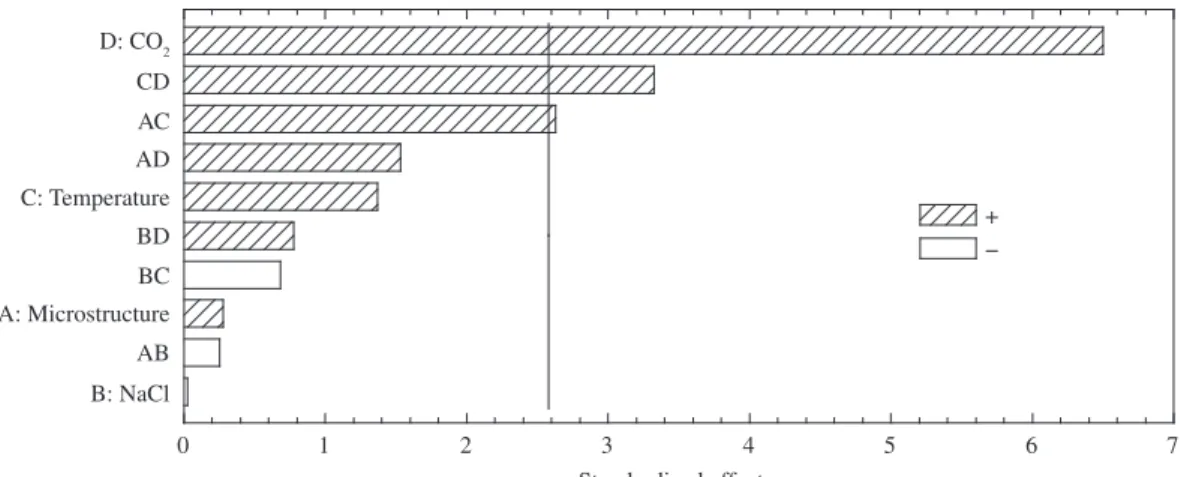
α2 variables. In Figures 5, 6 and 7 are shown the results of statistical analysis to these parameters by the standardized Pareto chart. The significance of factors and the synergisms are presented in decreasing order. The factors whose significance values reach the vertical standardized line are classified as significant. Moreover, the label indicates how each factor influences a given variable. In this analysis, the variable effect that increase the factor significance value is described as positive, and the opposite behavior is identified as negative. In Figure 5, for example, if the CO2 level increases, the variable Q1 raises its value. The microstructure, NaCl, temperature and CO2 factors were respectively represented as A, B, C and D.
Figures 5 and 6 suggest that the carbon dioxide influences the passive film. Indeed, it clearly appears that it alters only the significant values of Q1 and α1 parameters which are related to the passive film behavior. Thus, Q1 parameter (Figure 5) under CO2 effect was about 2.5 times higher than the threshold value to be considered statistically significant.
The temperature/CO2 (labeled CD) and microstructure/ temperature (AC) synergisms were also classified as significant in Figure 5, even if their significant values to these parameters were not so intense than CO2. In Figure 6 the temperature/CO2- CD synergism presented a significant value comparable to CO2 for α1, but with a negative effect. This result is in good agreement with some recent findings in the literature showing that Q and α values are inversely and intrinsically coupled, that is, an increase (conversely decrease) in Q is mutually compensated by a decrease (increase) in alpha14 as it appears from Figures 5 and 6. Finally, Figure 7 indicates that the temperature/CO2 and microstructure/temperature synergisms are significant to α2.
Table 4 depicts the statistical analysis results. The Q1 parameter values were substantially higher in CO2 presence that, according to the literature12, indicates an increase of surface film defects. Indeed, capacitance is proportional to the film permittivity that increases with the presence of defects. Moreover, the increment of temperature
Figure 5. Significance analysis of parameter Q1.
intensified the CO2 effect on Q1. This information may be better observed in Figure 8 in which are represented the Q1,2/Q1,1 ratio values as a function of temperature, where Q1,2 represents the Q1 parameter measured in CO2 presence, and Q1,1 represents the same parameter measured in the same conditions of microstructure, NaCl and temperature, but in CO2 absence.
As all Q1,2/Q1,1 ratio values are higher than unit, then for all cases Q1,2> Q1,1 meaning that the presence of carbon dioxide was deleterious to passive film. Moreover, all curves present positive inclinations, so that the increment of temperature from 30 to 60 °C resulted in the increase of Q1,2/Q1,1 ratio, intensifying the deleterious effect of CO2. Besides, the higher linear slope suggests that the raise of temperature was more aggressive to microstructure 2, which contains higher microstructural heterogeneity and presents higher sensibility. It is noteworthy that the statistical orthogonal design considers Figure 6. Significance analysis of parameter α1.
Figure 7. Significance analysis of parameter α2.
linear the factor effect, as depicted in Figure 8. Thus, each data point represents an average of eight experiments with a given factor at a single level.
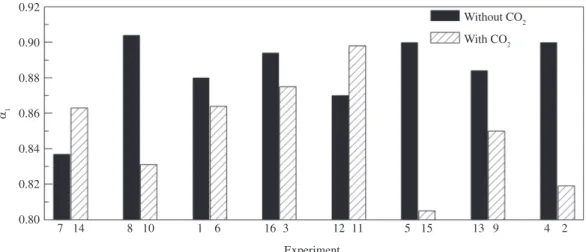
Another parameter that presented interesting behavior relative to CO2 presence/absence was α1, whose values were lower in most of experiments containing the gas. Such behavior is represented in Figure 9 and it was a priori expected. Indeed, since the presence of CO2 induces a proliferation of defects upon the film, hence increasing the heterogeneity distribution, this is effectively expected to appear in the form of smaller values of alpha, which means, larger deviations from the “ideal” capacitance predicted for “perfect” films.
While α1 values remained within 0.8 and 0.9, α2 presented more variable values, ranging from 0.6 to 1. Thus the latter average was lower than α1, as shown in Table 4. Such result suggests that at the global metallic-electrolyte interface, with passive film defects, can be influenced by diverse phenomena. Therefore, the global impedance is hardly represented by a simple equivalent circuit when a parallel diffusion across the film defect occurs, and α2 values would be close to 0.5. Moreover, Q2, RΩ, R1 and R2 factors did notexhibited statistically significant variation to a significance level of 5%.
An additional effect of bubbling CO2 is the reduction of pH, approximately from 7 to 41. This reduction changes the valence of certain metals, as nickel, and chiefly the molybdenum. For high chloride content and moderate
temperature, Wang et al16 have remarked the strong stability of Mo(III) for large pH range at 80 °C. This solubility can worse the film properties from 30 to 60 °C as observed in Figure 8.
It is worth noticing that in the present work we were interested in identifying which variables can, isolated or couple to others, be considered as harmful parameters for the corrosion performance of heat-treated stainless steel in these media, regardless the theoretical reaction models behind it. Therefore, the comparison with theoretical reaction models is beyond the aims of the present paper.
4. Conclusion
The electrochemical impedance spectroscopy diagram analysis of heat-treated superduplex stainless steel UNS S32750 indicates that carbon dioxide presence is harmful to the studied passive film. The gas presence increases the defects on steel passive layer and makes it more heterogeneous. Moreover, this deleterious effect is intensified at higher temperature thus the combination of these two factors, CO2 and temperature, further reduces the protective characteristics of films tested by electrochemical impedance and fitted by constant phase element circuit.
Acknowledgements
The authors acknowledge the financial support of CNPq, CAPES and FAPERJ Brazilian agencies.
Figure 9. Effect of CO2 on α1 parameter.
References
1. Mesquita TJ, Nogueira RP and Bastos IN. Factorial design applied to corrosion of superduplex stainless steel. Latin
American Applied Research. 2011; 41:311-315.
2. Bastos IN, Tavares SSM, Dalard F and Nogueira RP. Effect of microstructure on corrosion behavior of superduplex stainless steel at critical environment condition. Scripta
Materialia. 2007; 57:913-916. http://dx.doi.org/10.1016/j.
scriptamat.2007.07.037
3. Amri J, Gulbrandsen E and Nogueira RP. Pit growth and stifling on carbon steel in CO2-containing media in the presence of
HAc. Electrochimica Acta. 2009; 54:7338-7344. http://dx.doi. org/10.1016/j.electacta.2009.07.061
4. Nesic S, Postlethwaite J and Olsen S. An electrochemical model for prediction of corrosion of mild steel in aqueous carbon dioxide solutions. Corrosion. 1996; 52:280-294. http://dx.doi. org/10.5006/1.3293640
5. Nyborg R. Overview of CO2 corrosion models for wells and pipelines. In: Proceedings of the Corrosion; 2002; Denver. Houston: NACE International; 2002. paper n. 02233.
Electrochemistry Communications. 2008; 10:200-203. http:// dx.doi.org/10.1016/j.elecom.2007.11.028
7. Magnabosco R. Influence of microstructure on electrochemical
behavior of stainless steel UNS S31803 (SAF 2205). [Thesis].
São Paulo: University of São Paulo; 2001. (in Portuguese).
8. Tavares SSM, Pardal JM, Lima LD, Bastos IN, Nascimento AM and Souza JA. Characterization of microstructure, chemical composition, corrosion resistance and toughness of a multipass weld joint of superduplex stainless steel UNS S32750. Materials Characterization. 2006; 58:610-616. http:// dx.doi.org/10.1016/j.matchar.2006.07.006
9. Orazem ME and Tribollet B. Experimental Methods. In: Electrochemical impedance spectroscopy. Nova Jersey: Wiley; 2008. p. 427-445. http://dx.doi.org/10.1002/9780470381588.ch22 10. Orazem ME and Tribollet B. The Kramers-Kronig
Relations. In: Electrochemical impedance spectroscopy. Nova Jersey: Wiley; 2008. p. 109-128. http://dx.doi. org/10.1002/9780470381588.ch22
11. Luo H, Dong CF, Li XG and Xiao K. The electrochemical behaviour of 2205 duplex stainless steel in alkaline solutions with different pH in the presence of chloride. Electrochimica
Acta. 2012; 64:211-220. http://dx.doi.org/10.1016/j.
electacta.2012.01.025
12. Hirschorn B, Orazem ME, Tribollet B, Vivier V, Frateur I and Musiani M. Determination of effective capacitance and film thickness from constant-phase-element parameters.
Electrochimica Acta. 2010; 55:6218-6227. http://dx.doi.
org/10.1016/j.electacta.2009.10.065
13. Kocijan A, Merl DK and Jenko M. The corrosion behaviour of austenitic and duplex stainless steels in artificial saliva with the addition of fluoride. Corrosion Science. 2011; 53:776-783. http://dx.doi.org/10.1016/j.corsci.2010.11.010
14. Cordoba-Torres P, Mesquita TJ, Devos O, Tribollet B, Roche V. and Nogueira RP. On the intrinsic coupling between constant-phase element parameters α and Q in electrochemical impedance spectroscopy. Electrochimica Acta. 2012; 72:172-178. http:// dx.doi.org/10.1016/j.electacta.2012.04.020
15. Boukamp BA. Practical application of the Kramers-Kronig transformation on impedance measurements in solid state electrochemistry. Solid State Ionics. 1993; 63:131-141. http:// dx.doi.org/10.1016/0167-2738(93)90261-Z
16. Wang P, Wilson LL, Wesolowski DJ, Rosenqvist J and Anderko A. Solution chemistry of Mo(III) and Mo(IV): Thermodynamic foundation for modeling localized corrosion. Corrosion
Science. 2010; 52:1625-1634. http://dx.doi.org/10.1016/j.