Experimental continuously reinforced concrete
pavement parameterization using nondestructive
methods
Parametrização de pista experimental de pavimento
de concreto continuamente armado através de método
não destrutivo
a School of Engineering, Department of Transportation Engineering, University of São Paulo, São Paulo – SP, Brazil.
Received: 05 Nov 2014 • Accepted: 18 Jan 2016 • Available Online 21 Mar 2016
Abstract
Resumo
Four continuously reinforced concrete pavement (CRCP) sections were built at the University of São Paulo campus in order to analyze the pave-ment performance in a tropical environpave-ment. The sections short length coupled with particular project aspects made the experipave-mental CRCP
cracking be diferent from the traditional CRCP one. After three years of construction, a series of nondestructive testing were performed - Falling Weight Delectometer (FWD) loadings - to verify and to parameterize the pavement structural condition based on two main properties: the elastic -ity modulus of concrete (E) and the modulus of subgrade reaction (k). These properties estimation was obtained through the matching process
between real and EverFE simulated basins with the load at the slab center, between two consecutive cracks. The backcalculation results show
that the lack of anchorage at the sections end decreases the E and k values and that the longitudinal reinforcement percentage provides additional
stifness to the pavement. Additionally, FWD loadings tangential to the cracks allowed the load transfer eiciency (LTE) estimation determination across cracks. The LTE resulted in values above 90 % for all cracks.
Keywords: concrete pavement, consitnuous reinforcement, delections, backcalculation, load transfer eiciency.
Quatro seções experimentais de pavimento de concreto continuamente armado (PCCA) foram construídas no campus da Universidade de São
Paulo com a inalidade de analisar o desempenho deste tipo de pavimento em clima tropical. A curta extensão das seções aliada a aspectos especíicos de projeto izeram com que o PCCA experimental apresentasse um padrão de issuração bastante distinto dos PCCA tradicionais. Passados três anos da construção, realizou-se uma série de testes não destrutivos – aplicações de Falling Weight Delectometer (FWD) – para veriicar e parametrizar a condição estrutural do pavimento com base em dois fatores principais: o módulo de elasticidade do concreto (E) e o módulo de reação do subleito (k). A estimativa das propriedades foi obtida através da equiparação de bacias reais com bacias simuladas pelo programa EverFE para a carga aplicada no meio da placa formada por duas issuras. Os resultados da retroanálise mostram que a falta de an
-coragem no inal das placas diminui os valores de E e k e que a porcentagem de armadura proporciona um adicional de rigidez ao pavimento. Adicionalmente, aplicações de carga tangenciais às issuras possibilitaram a determinação da eiciência de transferência de carga (LTE) entre issuras. A LTE resultou em valores acima de 90% para todas as issuras.
Palavras-chave: pavimento de concreto, armadura contínua, delexões, retroanálise, eiciência de transferência de carga.
L. S. SALLES a
J. T. BALBO a
1. Introduction
Over the past 20 years, the evaluation of pavements by Falling Weight Delectometer (FWD) became the main non-destructive
analysis method of operational pavements. Factors such as no need for material removal (destruction) and relatively user-friendly
equipment explain the success of this methodology [1]. The de -termination of pavement properties through backcalculation
al-gorithms based on delection measurements has also become a
routine operation in the study and evaluation of road structures.
However, one should perform a very careful process both in the choice of the backcalculation method and in the equalization of real (ield) and theoretical delection basins. Warns have been is -sued of disastrous parameterization results if failures occur in the
backcalculation process [2].
For concrete pavements, a study compared the three most common models used for backcalculation models based on inite element, and concluded that the logarithm based on the “ininite slab” pres
-ents more accurate results than the “single slab” one. The “nine-slab” model presents correlation values between the real and the theoretical delections very similar to those of the “ininite slab”, al -though the former process has a much more complex methodology
than the latter. Therefore, the authors’ recommendation for general
studies is the use of “ininite slab” model because of its easier ap
-plicability and that the of “nine-slab” model should only be performed for speciic cases that require a more detailed approach [3].
The work described here presents the entire backcalculation pro-cess of an experimental continuously reinforced concrete pave-ment (CRCP) in order to parameterize the four sections and to esti-mate the elastic modulus of concrete (E) and modulus of subgrade
reaction (k). The relation of these parameters with very speciic as
-pects of this pavement type is discussed. For the backcalculation, a inite element model with nine slabs called EverFE was used. Additionally, the delection analysis made it possible to calculate the load transfer eiciency (LTE) across cracks for all the cracks in the pavement. The LTE afects the performance of both
jointed-plain concrete pavements (JPCP) and CRCP; and can be a good indicator of early structural problems on the slab that could lead to
future failures [4]. In JPCP, a low LTE can lead to excessive spall -ing on the transverse joints and the development of longitudinal
cracks; in the CRCP, LTEs below 70% are routinely found on slabs with punchouts failures [5].
1.1 Short experimental CRCP
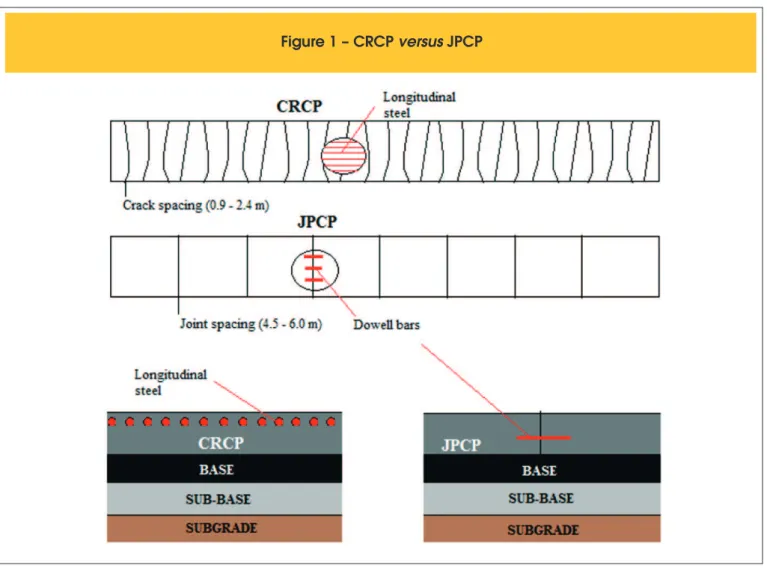
The CRCP is a concrete pavement without contraction joints: a
continuous slab with only a constructive joint when the concrete
pouring stops. The major diference from JPCP is the presence
of a high reinforcement ratio slightly above the slab neutral axis
whose sole purpose is to keep the inevitable cracks, caused by the concrete shrinkage, strongly tight. As a result of this tightening action, the cracks are imperceptible to the user and load transfer eiciency is highly satisfactory due to aggregate interlocking. Thus, there is not a cracking control or induction as it is in JPCP, because
there is a whole steel structure designed to maintain the slab
struc-tural and functional integrity once the random cracking begins [6]. Figure 1 shows the basic diferences between the traditional CRCP
and JPCP.
In 2010, an experimental CRCP was built at the USP campus in
São Paulo. The idea was to evaluate the slab behavior under a
tropical climate, as well as to develop a new technology for bus corridors and stops in Brazil. To simulate a bus stop, the experi
-mental CRCP sections are only 50 m in length and 5.05 m wide, a short length in relation to traditional CRCP with more than 300 m in length between constructive joints. Also, there was no anchor -age system at the end of the slabs; the sections were free to move
during the concrete curing. Those diferences impacted the short CRCP crack behavior; there were less cracks than expected and, therefore, a greater crack spacing [7]. The study of dynamic de
-formations with diferent operating speeds showed stresses below the concrete strength, indicating a good structural performance of the slab [8]. The design of the short CRCP was a 240 mm thick concrete slab over a 60 mm asphalt concrete base over a 300 mm dry macadam sub-base. The only diference between the sections was the amount of longitudinal steel: section 1 has 0.6%, section 2, 0.7%, section 3, 0.5% and inally section 4 with less steel at 0.4%; more details and construction aspects can be found elsewhere [9].
2. Falling Weight Delectometer (FWD)
test methodology
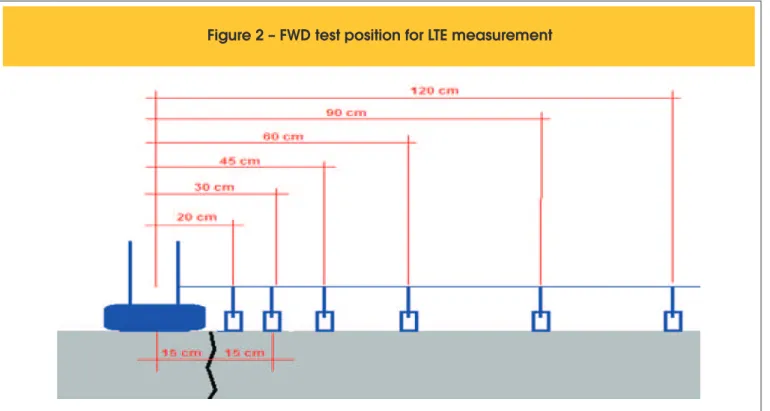
To determine the LTE across cracks, the simplest and most rou
-tinely applied method is the one introduced by Shahin in 1985 [10], in which the load transfer percentage is determined by the relation between the symmetrical delections at the loaded slab (δ1) and at the unloaded slab (δ2). For this, the FWD plate must
be positioned tangentially to the crack so that at least two
sen-sors are equally distanced from the slab, one at the loaded slab
and the other at the unloaded slab. The calculation is performed
by Equation 1.
(1)
2
1
100%
=
´
LTE
d
d
While a study held in JPCP joints indicated a minimum LTE of 75% as an indication of pavement good structural performance [10], another work showed, again in JPCP joints, that for new pavements without dowel bars, the LTE varied between 70 and 100%, and that for new pavements with dowel bars, the lower limit was upgraded to 80% [11]. The author considers a LTE lower than 70% unacceptable. For CRCP, LTE below 70% is also con
-sidered problematic [5].
Since the sensor device coniguration was 0, 200, 300, 450, 600, 900 and 1200 mm, and the load plate had a 300 mm di
-ameter (irst sensor), it was decided to use the delections mea
-sured by the sensor at points 0 and 300, as shown in Figure 2.
more detailed delection reading, which a lower load could not provide due to the high stifness of a concrete pavement with such steel ratios. Also, tests were performed in the middle of the slabs, between consecutive cracks, in order to analyze the de
-lection basins and to determine essential parameters, through backcalculation, to study slab performance such as the concrete
modulus of elasticity (E) and subgrade reaction module (k). As
section 1 has no visible cracks yet, the FWD tests at this sec -tion were conducted 5 meters from each edge and then with a
10-meter spacing. Since each stretch has a width of 5.05 m, the test point was always in the middle of the width, i. e., 2.525 m from the road center axis. Figure 3 encodes each point as a
crack (F) or slab (P) in all sections.
2.1 Backcalculation methodology
The consistent simulation of the slab structure behavior with a theory by means of strains or stresses of the actual structure is
a quite suitable backcalculation concept. For such, the theoreti -cal model (analyti-cal or numeri-cal) must be able to represent the
pavement geometric coniguration and the loading parameters employed. Once all the necessary elements are provided, the
theoretical simulation thus relies on a search through successive
approximations, for a theoretical response with suicient level
of representation of the real answer. The most usual method of
checking the quality of these approaches is the analysis of the
squared error between the theoretically calculated delections and actual measured delections in the ield. Equation 2 dictates
this method.
(2)
(
)
2Σ
=
Field-
Theoreticali i
SquaredError
d
d
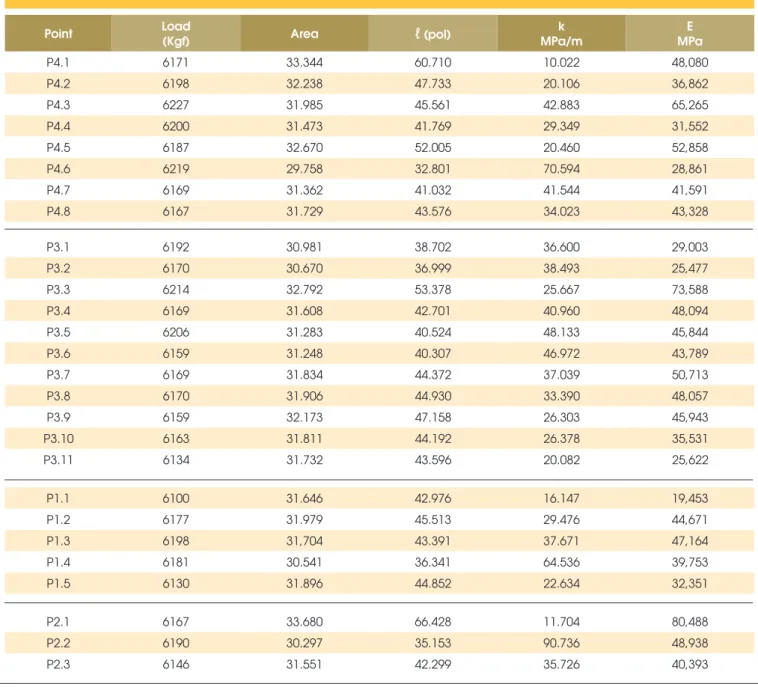
E and k are known to range with the pavement age, which may make measured values during construction quality control not rep
-resentative, for example. To estimate the input values of k and E based on the delections obtained, studies by Hall [12] and Crovetti [13] are used herein. In the irst research, the structural answer
analysis of innumerous concrete pavement sections based on the
slab radius of relative stifness (ℓ) concept deined the following relation (Equation 3 and Equation 4) between this parameter and the ield delections [12].
(3)
4.38700936
1812.279133
2.55934
é
æ
-
ö
ù
ç
÷
ê
è
ø
ú
ê
ú
=
-ê
ú
ê
ú
ë
û
AREA
ln
,
(4)
30 60 90
0 0 0
2
2
6 1
æ
ö
=
ç
+
+
+
÷
è
ø
AREA
d
d
d
d
d
d
The parameter AREA is the delection basin area normalized by the maximum delection in relation to a FWD load applied onto a 300 mm diameter plate. It is worth highlighting that the concept be -hind the study is based on loadings in the slab center. The
knowl-edge of ℓ allows using the Westergaard equations for the load in the slab center to determine the values of k and E [13]. To this end, Equation 5 and Equation 6 are used.
(5)
22 0
1
1
.
0.67278436 .
8. .
2
2.
ì
é
ù
ü
ï
æ ö
æ ö
æ ö
ï
=
í
+
ç ÷
ê
ç ÷
-
ú
ç ÷
ý
è ø
ë
è ø
û
è ø
ï
ï
î
þ
P
a
a
k
ln
d
,
p
,
,
(6)
(
2)
43
12 1
-
. .
=
k
E
h
m
,
Where:
P = FWD loads (lbf) a = FWD plate radius (pol) µ = Poisson ratio
h = slab thickness
Note that the model presented has its application ield limited to ininite slabs with loads in its center. It should also be noted that for k-values, the calculated numbers refer to a static load; how
-ever, the FWD is a dynamic load; thus, the actual values should
be higher than the estimated ones. Table 1 shows the estimated values of k and E according to the methodology described above. Note that only slab center FWD points were selected for the analy-sis. These values will be used as the initial input in the software for the backcalculation process.
2.1.1 The EverFe software
First presented in 1998, the EverFe, now in version 2.24, allows numerical simulations of load tests by inite element. Using the software, it is possible to simulate the real tests in order to verify
the values of E and k.
Although the model was speciically developed for JPCP, it is pos -sible to simulate other concrete slabs structures knowing their
geo-metric conigurations. The software can simulate up to three layers
(each with its own characteristics and parameters) and transverse and longitudinal joints between slabs; the maximum number of
slabs is nine. In addition, the software allows a number of vehicle axle conigurations and loads that satisfactorily contemplates the traic conditions currently found in highways [14].
To simulate the experimental CRCP, irstly, the sections geometric coniguration was informed. The cracks were simulated as joints; a
slab is considered the space between consecutive cracks (joints);
hence, section 3 has eleven slabs, for example. Section 1 was simulated as a single slab with ive FWD loading points. For the
cracked sections, aiming to provide the continuous pavement con
-iguration, the prior and posterior slabs to the analyzed slab were
considered for each P point.
Some considerations regarding the simulation:
n Along with the concrete slab, it was chosen to simulate only the
base layer. When simulating with or without the granular
sub-base layer, it was observed that the efect on the delections
was negligible;
n The resilience modulus of the asphalt concrete base was based on the analyses of two studies that indicate a relatively high modulus to asphalt layers isolated (between two layers) because it is less exposed to thermal variations than the
sur-face layer [15] [16];
n The values concerning the slab-base friction were set at 10
each, just to not let them null; again, in the simulations it was
observed that a three-value variation on a scale of 1 to 100
does not cause signiicant changes in the delection;
n Regarding the slab thermal gradients, the temperature during
the FWD test was 20 ° C on a very cloudy day. According to
the equations developed during a thermal research in São Pau
-lo, the thermal gradient between top and bottom should be of 7°[17]. Applying this value to EverFE, the slab sufers such a se
-vere warping that delections turned negative; even decreasing this value to 2 ° C, the resulting delections were only matched with the ield delections with an E larger than 200MPa, which is
very unlikely in the concrete applied. The software is believed to
present some errors concerning the thermal efects. Therefore, the thermal diferential used was zero;
n As the longitudinal reinforcement on the CRCP has no load
transferring function – its only purpose is to keep the cracks closed –, the cracks (joints) were considered to have no rein
-forcement [18]. The only crack input was the crack width and the crack stifness based on the crack width [19].
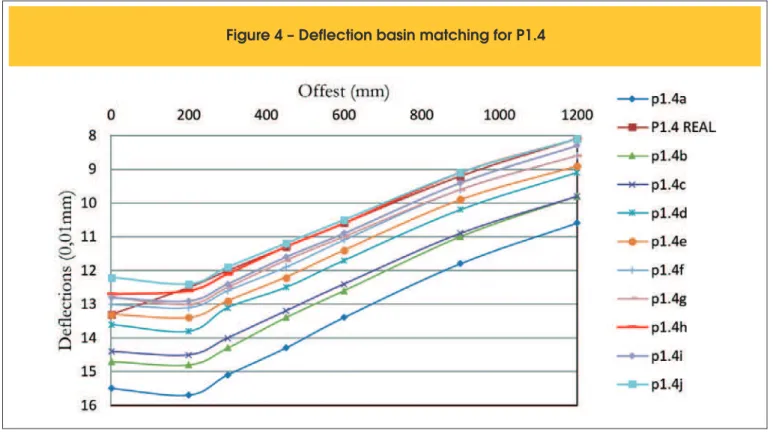
Based on the estimated E and k shown in Table 1, backcalcula -tion attempts for an approximate value of E and a value twice the estimated k were initiated. It is known that increasing the value of
k and E makes the structure stifer, reducing the delections. With each attempt, the percentage error and the squared error were an
-alyzed, until the lowest possible error was obtained, this being the most appropriate and representative of the ield test basin. It was clearly seen in all the basins matching that k was more inluential in the last three delection sensors; on the other hand, the E modiied delections of the irst three sensors more intensely. After this ind
-ing, the process changed to irst ix a value of k that corresponds to a very low error for the sensors at 600, 900 and 1200 mm, and then the E was ranged until the 0, 200 and 300 mm sensors were adequate. An example of this matching process can be found in Table 2 and in Figure 4. In the case presented, try number P1.4h was the one that best represented the ield data.
3. Results and discussions
The delections in the slabs center allowed the delection basin layout shown in Figure 5. Firstly, we note that the lower maximum delection occurs at the longer slab formed between cracks, P2.2
in section 2 center. This can be explained by the section higher
ratio of reinforcement which gives it greater stifness. The largest maximum delections - values above 25x10-2 mm – were always
at these points elucidates this fact; near the edge, the slab is freer
to move and it is not uncommon to feel a vertical displacement when a heavy vehicle access or exit the stretch. Despite its
in-creased reinforcement ratio in relation to sections 3 and 4, sec
-tion 1 presents point (P1.1) with the largest maximum delec-tion (38x10-2 mm) - much larger as compared to the second largest, the
P4.1 point (section 4) with 31,4x10⁻² mm; this happens because
there is a settlement law in the interlocked pavement near the
joint with the experimental CRCP. This failure caused faulting and
breaking in the slab corner as shown in Figure 6. At this point, the vertical “bump” is more easily noticed. It is also interesting to note
that the two points with the largest displacements are those where
the vehicles access the experimental CRCP, which suggest a more
advanced concrete deterioration due to the vertical impact at these
points. As for the shape, except for the P1.1 basin, all the basins seem a typical outline for rigid pavements with a smooth delection
decrease through sensors.
Delections at the crack also enabled the delection basins layout as seen in Figure 7. The graph analysis shows the non-occurrence of very high maximum delections, as expected; cracks are fur
-ther from the edge than the inal and initial slabs, which makes the displacements due to lack of anchorage less inluential. Despite the lower values, the two highest maximum delections are, again, close to the edge (F3.10 and F4.1). No signiicant increase in de
-lections was noticed when comparing the measures taken at the crack and in the slabs center – in some cases, the crack delec -tions were even smaller. A study showed in a JPCP that joints
with-out dowel bars presented much higher delections than joints with dowel bars [20]. Even though the CRCP joints (cracks) do not have dowel bars, the cracks small width added to the tightening strength provided by the longitudinal reinforcement, which increases the stifness, decrease delections even in a physical discontinuity.
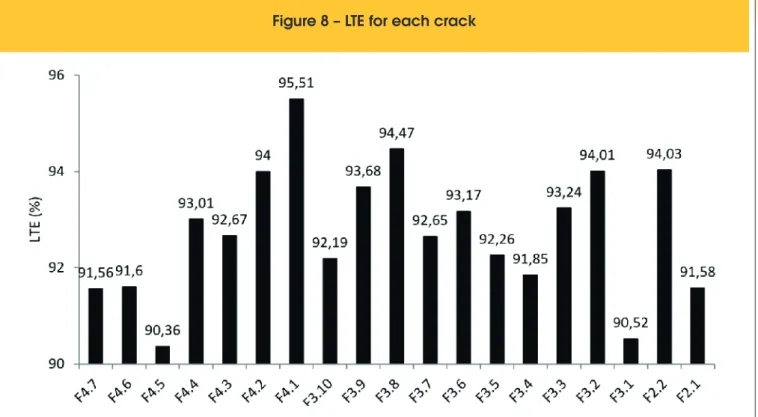
3.1 Load transfer eiciency across cracks
The FWD loading tangential to the crack provided equidistant de
-lections; the use of Equation 1 allowed the LTE calculation. Figure 8 illustrates the LTE value for each crack. Figure 8 allows the fol
-lowing indings:
n All cracks showed LTE over 90% (average 92.7%);
Table 1 – Estimated parameters for slab center FWD loadings
Point Load
(Kgf) Area
ℓ
(pol)k MPa/m
E MPa
P4.1 6171 33.344 60.710 10.022 48,080
P4.2 6198 32.238 47.733 20.106 36,862
P4.3 6227 31.985 45.561 42.883 65,265
P4.4 6200 31.473 41.769 29.349 31,552
P4.5 6187 32.670 52.005 20.460 52,858
P4.6 6219 29.758 32.801 70.594 28,861
P4.7 6169 31.362 41.032 41.544 41,591
P4.8 6167 31.729 43.576 34.023 43,328
P3.1 6192 30.981 38.702 36.600 29,003
P3.2 6170 30.670 36.999 38.493 25,477
P3.3 6214 32.792 53.378 25.667 73,588
P3.4 6169 31.608 42.701 40.960 48,094
P3.5 6206 31.283 40.524 48.133 45,844
P3.6 6159 31.248 40.307 46.972 43,789
P3.7 6169 31.834 44.372 37.039 50,713
P3.8 6170 31.906 44.930 33.390 48,057
P3.9 6159 32.173 47.158 26.303 45,943
P3.10 6163 31.811 44.192 26.378 35,531
P3.11 6134 31.732 43.596 20.082 25,622
P1.1 6100 31.646 42.976 16.147 19,453
P1.2 6177 31.979 45.513 29.476 44,671
P1.3 6198 31,704 43.391 37.671 47,164
P1.4 6181 30.541 36.341 64.536 39,753
P1.5 6130 31.896 44.852 22.634 32,351
P2.1 6167 33.680 66.428 11.704 80,488
P2.2 6190 30.297 35.153 90.736 48,938
n The crack with the lowest LTE (90.52%) is F3.1, positioned at the end of section 3; however, strangely, the crack with the highest LTE (95.51%) also lies on a section edge - section 4 in that case. Delections were quite large in this position as seen in Figures 5 and 7; however, more or less displacement does not seem to inluence the crack load transferring potential.
n As some researchers stress, the crack spacing inluence was
not observed in the LTE. Figure 9 shows the relationship be
-tween the LTE and the crack spacing of loaded and unloaded crack. No trend is veriied, i.e., very large crack spacing as those
presented by section 2 are not harmful to the load transfer;
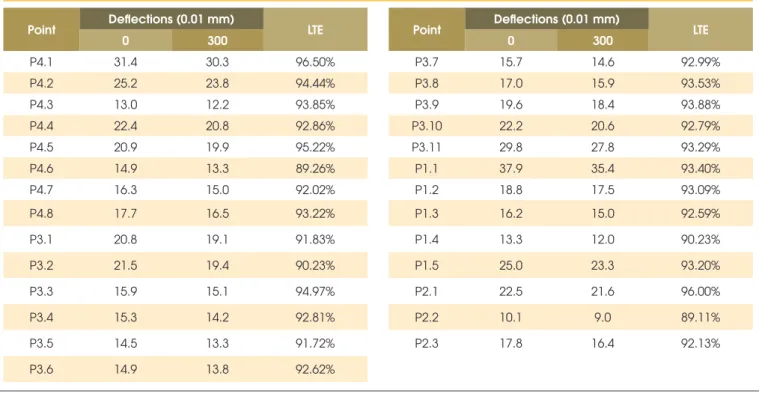
n Another aspect is that when simulating a crack at the P points
(slabs center) and calculating the LTE for this ictitious crack,
the values are very similar to those of Figure 8; this means that
Table 2 – Deflections matching process for point P1.4
Try
Deflections (0.01 mm) 0 200 300 450 600 900 1200 Error
(%) Total
Error² File E (MPa) k
(MPa/m) 13.3 12.5 12.0 11.3 10.6 9.2 8.1
1 p1.4a 35,000 120
Error(%) 15.5 16.5% 15.7 25.6% 15.1 25.8% 14.3 26.5% 13.4 26.4% 11.8 28.3% 10.6
30.9% 180.06% 54.54
2 p1.4b 35,000 130
Error(%) 14.7 10.5% 14.8 18.4% 14.3 19.2% 13.4 18.6% 12.6 18.9% 11.0 19.6% 9.8
21.0% 126.10% 27.08
3 p1.4c 38,000 Error(%)
130 10.5% 14.4 18.4% 14.5 19.2% 14.0 18.6% 13.2 12.4 17.0% 10.9 18.5% 9.8
21.0% 114.20% 21.84
4 p1.4d 38,000 140
Error(%) 13.6 2.3% 13.8 10.4% 13.1 9.2% 12.5 10.6% 11.7 10.4% 10.2 10.9% 9.1
12.3% 66.03% 7.64
5 p1.4e 38,000 145
Error(%) 13.3 0.0% 13.4 7.2% 12.9 7.5% 12.2 8.0% 11.4 7.5% 9.9 7.6% 8.9
9.9% 47.70% 4.20
6 p1.4f 38,000 150
Error(%) 13.0 2.3% 13.1 4.8% 12.6 5.0% 11.9 5.3% 11.1 4.7% 9.6 4.3% 8.6
6.2% 32.60% 1.83
7 p1.4g 40,000 150
Error(%) 12.8 3.8% 13.0 4.0% 12.5 4.2% 11.7 3.5% 11.0 3.8% 9.6 4.3% 8.6
6.2% 29.76% 1.48
8 p1.4h 38,000 160
Error(%) 12.7 4.5% 12.6 0.8% 12.1 0.8% 11.3 0.0% 10.6 0.0% 9.1 1.1% 8.1
0.0% 7.23% 0.39
9 p1.4i 40,000 155
Error(%) 12.8 3.8% 12.9 3.2% 12.4 3.3% 11.6 2.7% 10.9 2.8% 9.4 2.2% 8.3
2.5% 20.42% 0.83
10 p1.4j 40,000 160
Error(%) 12.2 8.3% 12.4 0.8% 11.9 0.8% 11.2 0.9% 10.5 0.9% 9.1 1.1% 8.1
0.0% 12.82% 1.26
regarding load transfer, the short CRCP cracking behaves as a continuous structure. The simulated LTE data are shown in Table 3.
3.2 Backcalculation analysis
Before any analysis, it should be clear that, although the concrete used was the same for all sections, provided by the same supplier, the construction happened in diferent days for each section and it is know that concrete, a heterogeneous material, can present diferent properties even in a small volume. In addition, construc -tive problems such as exudation and segregation of fresh concrete may happen. All these variables are aggravated by the pouring
and vibration of the material, which is certainly not homogeneous in situ. These factors are inluential on the FWD test results, which may consequently afect the basin matching during the backcal
-cutation. With these presuppositions in mind, the E and k results
are presented for all P points in table 4.
In spite of the factors discussed above, of the 27 basins analyzed,
only three cases (P3.3, P2.1 and P1.1) could not ind a satisfactory
theoretical basin match according to the criteria presented. This validates the FWD testing. An extra explanation for these three
cases could be that during the FWD test, the loading plate was
not uniformly placed on the surface due to the presence of very
hard aggregates, which can lead to uneven pressures. This is very likely to have occurred in P3.3. However, for the P2.1 and P1.1 slabs, because of its location in the sections longitudinal edge, the
software used may be assumed not to have perfectly simulated the
slab anchorage system – or lack of it.
By analyzing the values of k and E, it appears that, except for the P4.4 and P4.6, the nearest from the edge, the lowest values for both parameters are presented; and more, especially at the slabs edge where vehicles access the sections, the minimum values
were found. This fact is easily explained by the absence of an
an-choring system, which means that there is greater displacement at the edges and also due to this displacement, a larger deterioration
of the concrete and the structure as a whole at these points.
Excluding these minimum values inluenced by the edge, there is
an E variation from 34,000 to 38,000 MPa for section 1; 25,000 to 42,000 MPa for section 3; and 25,000 to 45,000 MPa for section
4. This variation is common and expected in large volumes of
con-crete as a pavement slab. When checking the smallest squared
error, the most representative values for each section are 38,000 MPa for section 1; 35,000 MPa for section 2; 38,000 MPa for sec
-tion 3; and 25,000 MPa for sec-tion 4. For sec-tion 2, as there are only three P points, the most representative ended up being the
A
B
Figure 6 – Concrete deterioration at the transversal edge
Figure 8 – LTE for each crack
!
versus
LTE
closest to the edge; furthermore, the value of 60,000 MPa (near
the slab center) is very high for the concrete used. An FWD testing
error could also have occurred in this case, which generated lower delections. However, it is not entirely wrong to suppose that sec -tion 2 presents a more rigid structure due to the large amount of
reinforcement steel, since even the edge P points resulted in E in the magnitude of 30,000 MPa.
Concerning k, the parameter variation, excluding the values near the edge, resulted in 95 to 160 MPa/m (Section 1); 85 to 135 MPa/m (Section 3); 70 to 155 MPa/m (Section 4). Ioannides [21] states that
the modulus of subgrade reaction is not an intrinsic property of the
soil, but a representation of the structure support as a whole. Thus, it
is perfectly normal for a complex structure with several layers of dif-ferent materials to present the variations mentioned. Values denote
a fairly stif base on the subgrade; a research found for a JPCP with a lean concrete base, in an area close to the short CRCP, values between 60 and 125 MPa/m [20]. The sections are better represent
Table 3 – Fictitious LTE in the slab center
Point Deflections (0.01 mm) LTE
0 300
P4.1 31.4 30.3 96.50%
P4.2 25.2 23.8 94.44%
P4.3 13.0 12.2 93.85%
P4.4 22.4 20.8 92.86%
P4.5 20.9 19.9 95.22%
P4.6 14.9 13.3 89.26%
P4.7 16.3 15.0 92.02%
P4.8 17.7 16.5 93.22%
P3.1 20.8 19.1 91.83%
P3.2 21.5 19.4 90.23%
P3.3 15.9 15.1 94.97%
P3.4 15.3 14.2 92.81%
P3.5 14.5 13.3 91.72%
P3.6 14.9 13.8 92.62%
Point Deflections (0.01 mm) LTE
0 300
P3.7 15.7 14.6 92.99%
P3.8 17.0 15.9 93.53%
P3.9 19.6 18.4 93.88%
P3.10 22.2 20.6 92.79%
P3.11 29.8 27.8 93.29%
P1.1 37.9 35.4 93.40%
P1.2 18.8 17.5 93.09%
P1.3 16.2 15.0 92.59%
P1.4 13.3 12.0 90.23%
P1.5 25.0 23.3 93.20%
P2.1 22.5 21.6 96.00%
P2.2 10.1 9.0 89.11%
P2.3 17.8 16.4 92.13%
Table 4 – Backcalculated E and k
Section 2 Section 3
Point P2.1 P2.2 P2.4 P3.1 P3.2 P3.3 P3.4 P3.5 P3.6 P3.7 P3.8 P3.9 P3.10 P3.11
E
(MPa) 30000 60000 35000 25000 25000 30000 35000 42000 38000 42000 42000 28000 28000 25000
k
(MPa/m) 80 200 105 95 95 120 130 135 135 115 105 100 85 60
Error² 17.23 0.16 0.11 0.37 0.90 3.60 0.22 0.23 0.20 0.44 0.27 0.44 0.48 0.82
Section 2 Section 3
Point P1.1 P1.2 P1.3 P1.4 P1.5 P4.1 P4.2 P4.3 P4.4 P4.5 P4.6 P4.7 P4.8
E
(MPa) 12000 35000 34000 38000 28000 25000 27000 45000 25000 30000 28000 32000 30000
k
(MPa/m) 53 95 120 160 70 53 70 145 85 85 155 125 115
Error² 17.18 0.53 0.43 0.39 1.12 0.96 0.29 0.22 0.21 0.56 0.24 0.29 0.27
4. Conclusions
By analyzing the delection basin in the slab center points, the larger delection was observed to occur near the pavement lon
-gitudinal edge. As the sections do not have an anchoring system,
the slab has free edges which cause a greater vertical displace-ment when the slab is loaded. The basins obtained tangential to the cracks showed similar results to those of slab center; again
the largest delections were near the edges. This proves that even
without dowel bars at the cracks (joints) the CRCP behaves as a
continuous structure. The LTE across cracks showed a very sat -isfactory performance of the sections. All the cracks presented a
value higher than 90%, including those near points that had large delections. No inluence of the reinforcement ratio and the cracks
spacing in LTE were visible. By simulating a crack in the slab cen
-ter points, the ictitious LTE was veriied to be very similar to the actual LTE at cracks. This shows that albeit cracked, the pave
-ment behaves as a single structure. The backcalculation process, despite the many simpliications adopted, resulted in a variation of the E and k parameters compatible for most basins. It is clear that, due to the lack of an anchorage system, the delections in the lon
-gitudinal edges of the sections were very large and, consequently,
E and K were lower at these points. Section 2 presents greater k
and E even for points closer to the edge in a direct inluence of the steel amount in the slab stifness. For Section 1 edge, a settlement presented by interlocked pavement near the experimental CRCP, resulted in fast concrete deterioration, which was proved by the
5. Acknowledgements
The authors are very grateful to the State of São Paulo Research Foundation (FAPESP) for their support to the research developed at the University of São Paulo aiming to develop designs and
construction techniques for concrete pavements in the country, through process #98/11629-5 and CAPES - Ministry of Education – for the scholarship provided to the irst author.
6. References
[1] BAYRAK, M. B.; CEYLAN, H. Neural network-based ap
-proach for analysis of rigid pavement systems using delec -tion data. Transporta-tion Research Record: Journal of the
Transportation Research Boar, Nº 2068, 2008.
[2] KUTAY, M. E.; CHATTI, K.; LEI, L. Backcalculation of dy
-namic modulus mastercurve from falling weight delectom
-eter surface delections. Transportation Research Record: Journal of the Transportation Research Boar, Nº 2227, 2011. [3] SETIADJI, B. H.; FWA, T. F. Consideration of inite slab size
in backcalculation analysis of jointed concrete pavements. Transportation Research Record: Journal of the
Transporta-tion Research Boar, Nº 2005, 2007.
[4] KHAZANOVICH, L.; GOTILF, A. Evaluation of joint and crack load transfer inal report. Federal Highway Administration, FHWA-RD-02-088, Washington D.C., 2003.
[5] ZOLLINGER, D. G.; BARENBERG, E. J. Field investiga -tion of punchout distress in continuously reinforced concrete pavements in Illinois. Transportation Research Record:
Jour-nal of the Transportation Research Board, Nº 1286, 1990a. [6] KOHLER, E.; ROESLER, J. Active crack control for con
-tinuously reinforced concrete pavements. Transportation Research Record: Journal of the Transportation Research
Boar, Nº 1900, 2004.
[7] SALLES, L. S.; BALBO, J. T.; PEREIRA, D. Crack pattern
characterization in a short experimental continuously
rein-forced concrete pavement. 2013 International Journal of Pavements Conference, São Paulo, 2013.
[8] SALLES, L. S.; BALBO, J. T.; PEREIRA, D. Experimental stresses analysis with diferent load speeds in a short contin -uously reinforced concrete pavement. Proceedings of the 8th
International DUT-Workshop on Research and Innovations
for Design of Sustainable and Durable Concrete Pavements, Prague, 2014.
[9] BALBO, J. T.; MASSOLA, A.; PEREIRA, D.; SALLES, L. S.
(In portuguese) Aspectos estruturais de um PCCA de
ex-tensão reduzida em São Paulo. Anais do 54º Congresso Brasileiro do Concreto, Maceió, 2012.
[10] SHAHIN, M. Y. Use of the falling weight delectometer for the non-destructive delection testing of jointed concrete airield pavements. 3rd International Conference on Concrete Pave
-ment Design and Rehabilitation, Purdue University, 1985. [11] VANDENBOSSCHE, J. M. Efects of slab temperature pro
-iles on the use of falling weight delectometer data to moni -tor joint performance and detect voids. Transportation
Re-search Board Annual Meeting, Washington D. C., 2007. [12] HALL, K. T. Performance, evaluation and rehabilitation of as
-phalt-overlaid concrete pavements. Ph.D. Thesis. University
of Illinois, 1991.
[13] CROVETTI, J. A. Design and evaluation of jointed concrete
pavement systems incorporating open-graded permeable
bases. Ph. D. Dissertation, University of Illinois, 1994. [14] DAVIDS, W. EverFE: Software for the 3D Finite Element
Analysis of Jointed Plain Concrete Pavements. Disponível em at http://www.civil.umaine.edu/everfe, 2004.
[15] SVADISANT, T.; SCHORSCH, M.; BALADI, G. Y.; PINYO
-SUNUN, S. N. Mechanistic analysis of top-down cracks in
asphalt pavements. Transportation Research Record:
Jour-nal of the Transportation Research Board, Nº 1809, 2002. [16] KIM, W.; LABUZ, J. F.; DAI, S. Resilient modulus of base
course containing recycled asphalt pavement. Transporta-tion Research Record: Journal of the TransportaTransporta-tion
Re-search Board, Nº. 2005, 2007.
[17] BALBO, J. T.; SEVERI, A. A. Thermal gradients in concrete
pavements in tropical environment. Experimental appraisal. Transportation Research Record: Journal of the
Transporta-tion Research Board, Nº. 1809, 2002.
[18] ZOLLINGER, D. G.; BARENBERG, E. J. Mechanistic de -sign considerations for punchout distress in continuously reinforced concrete pavement. Transportation Research
Record: Journal of the Transportation Research Board, Nº. 1286, 1990b. [2] TAYLOR. H. F. W. Cement Chemistry. Lon
-don: Thomas Telford. 2ed. 1997. 459 p.
[19] JEONG, J. H.; ZOLLINGER, D. G. Characterization of stif -ness parameters in design of continuously reinforced and jointed pavements. Transportation Research Record:
Jour-nal of the Transportation Research Boar, Nº 1778, 2001. [20] COLIM, G. M.; BALBO J. T.; KHAZANOVICH, L. Efects
of temperature changes on load transfer in plain concrete
pavement joints. Ibracon Structures and Materials Journal, Vol. 4, Nº 3, 2011.
[21] IOANNIDES, A.M. CEE 607 – Pavement design: supple