Simultaneous effect of irradiance and temperature
on biochemical composition of the microalga
Pavlova lutheri
Ana P. Carvalho&Cristina M. Monteiro& F. Xavier Malcata
Abstract The biochemical composition of microalgae can be modulated through the environmental conditions prevailing during growth. The simultaneous effects of irradiance and temperature on the biochemical composition of Pavlova lutheri were evaluated using an experimental star factorial design. Five levels were tested for each parameter (temper-ature, 10, 14, 18, 22 and 26°C; irradiance, 60, 105, 150, 195 and 240μmol photons m−2s−1), whereas the carbohydrate, protein, lipid, pigments and elementary compound contents were measured as response variables. Additionally, in order to rapidly measure parameters to define the status of the culture, the validation of the relationships between biochem-ical parameters and physiologbiochem-ical status were estimated through regression analysis. It was observed that irradiance and temperature play a major role in the determination of the biochemical composition of microalgae. Their effects are synergistic, and it can be observed that a trend in behaviour at a certain temperature can be reversed at a different temperature; therefore, when selecting the environmental conditions to a culture they must be studied in a combined fashion. Although there are consistent relationships between pigment contents and elementary compounds in cells, its linearity is influenced by the irradiance of the culture and its age; therefore, they can only be applied in specific circum-stances. On the other side, population biomass was well estimated in terms of carotenoid content, irrespective of the environmental conditions provided and the growth phase. Keywords Biochemical parameters . Irradiance .
Microalga . Physiological status . Temperature
Introduction
Microalgal cultures represent an essential and costly step in aquaculture. They are essential because they are employed to feed bivalves at all stages of growth, as well as zooplankton (rotifers, copepods and brine shrimps), which will in turn be used to feed crustaceans and fish in larval stages (Volkman et al.1989); they are a costly step, which may represent 50% of the entire hatchery management costs, because cultivation techniques require considerable human and economic investment (Ponis et al. 2006). Therefore, studies leading to a reduction in cultivation costs are essential, which may be dedicated to the optimization of the culture system (Ponis et al. 2006) or the optimization of the physical–chemical conditions to which the culture is subjected, aiming at enriching the biochemical composition of the microalga.
Regarding the latter, sufficient conditions for microalgal growth encompass both chemical substrates (e.g. macro- and micro-nutrients) and physical“substrates” (e.g. temperature and irradiance, which are in essence forms of thermal and radiant energy). In terms of physical“substrates”, light and temperature have been widely accepted as the driving factors acting on overall biochemical composition in algal cultures (Dermoun et al. 1992; Trabelsi et al. 2008). Light is essential for autotrophic organisms to obtain chemical energy, stored in reduced carbon compounds (Dubinsky et al. 1995), whereas the effects of temperature on cell cultures concern mainly two factors: one relates to the temperature dependence of the structure of cell components (especially proteins and lipids), and the other pertains to the
A. P. Carvalho
:
C. M. Monteiro:
F. X. Malcata (*) Escola Superior de Biotecnologia, Universidade Católica Portuguesa, Rua Dr. António Bernardino de Almeida, P-4200-072 Porto, Portugaltemperature dependence of reaction rates, which in turn depend on the activation energies of those reactions. As a consequence of these primary effects, there are also secondary effects on metabolic regulatory mechanisms, specificity of enzyme reactions, cell permeability and cell composition (Richmond1986).
Microalgae respond to physicochemical variations in the surrounding environment, but the nature and extent of such environmental interactions is not yet fully understood. Contributions thereto have been made available, either encompassing chemical substrates (Ayala and Bravo1984; Spektorova et al.1986), physical“substrates” (Rochet et al. 1985; Joo et al. 1998; Spolaore et al. 2006; Valenzuela-Espinoza et al.2007; Baek et al.2008) or both (Sukenik et al.1993; Vonshak et al.2000; Otero and Vincenzini2003; Araújo and Garcia2005); however, such results are often ambiguous, because of the different experimental condi-tions employed, which may exert simultaneous, yet antagonist effects (Harding et al. 1985). Besides, extrap-olations from studies using a one-variable-at-a-time (OVAT) approach do not allow the study of the possible interactions between the different factors; there is in fact evidence that some species may shift their acclimation strategies from strictly linear and independent behaviours in response to combinations of both factors (Thompson1999). Therefore, it is of great interest to experimentally establish the single and interaction effects of irradiance and temper-ature on microalgal cultures, with the final goal of maximizing its biochemical profile and concomitantly reducing costs. The microalga selected was the marine phytoflagellate Pavlova lutheri (Droop) Green (Pavlovo-phyceae), because of its extensive use in aquaculture industry (Ponis et al.2006).
The aim of this work was to evaluate the simultaneous influence of irradiance and temperature on the biochemical composition of P. lutheri, by using several combinations of irradiance and temperature, laid out as a star factorial scheme. To that end, the gross composition of the micro-alga cultured in the different conditions was analysed.
Additionally, the establishment of relationships between biochemical parameters and the physiological state of the culture was also sought, with the final goal of identifying parameters that would be easily monitored and might rapidly give indications about the current status of the culture. In fact, although there are reports on the relation-ships between the amount of chlorophyll a and the nitrogen quota, or the content of carotenoid and the carbon quota (Clark 2001), such relationships were tested for cultures submitted to variations of chemical nutrients only, rather than to variations of physical conditions. In this work we attempted to overcome this limitation, by validation or limitation of those relationships, in order to define their limits of application. Specifically, this study concerned the
validity of using pigment contents to estimate biomass and the relationship between such pigment contents and the internal amounts of elementary compounds, in microalgal cultures submitted to variations in their environmental conditions.
Materials and methods
Pavlova lutheri (SMBA 60) was obtained from the reference collection held by Instituto Português de Inves-tigação MARítima (IPIMAR), Portugal.
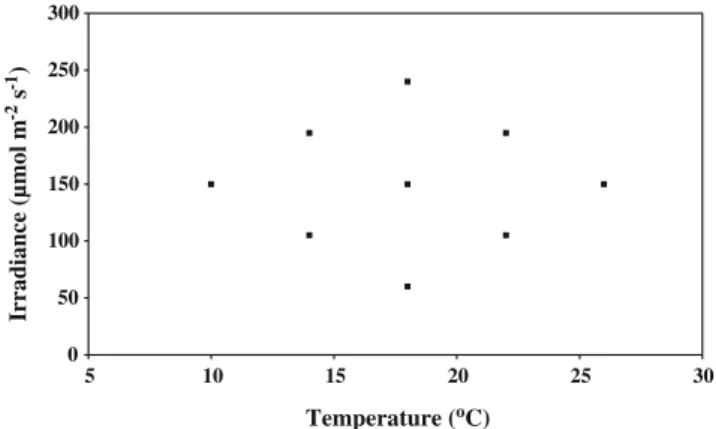
Cultures were grown in batch mode, in 250-mL Erlenmeyer flasks, with ASW culture medium modified as described elsewhere (Carvalho and Malcata2003). Culture flasks were incubated in a Gallenkamp orbital incubator (Sanyo, UK), stirred at 100 rpm and submitted to the desired temperature and light regimes (Fig. 1). The choice of levels of the factors was based on information from literature and preliminary experiments. Irradiance (Sylvania GRO-LUX® F30W lamps) was measured as Photosynthetic Active Radiation (PAR) with an LI-190SA Quantum Sensor, coupled to an LI-1000 Data Logger. Before each experiment, cultures remained at the determined experimental conditions for an adaptation period of approximately four generations. Forced aeration was not provided. Initial cell concentrations were similar in all experiments (ca. 4×10⁵ cell mL−1). Sampling was performed by random selection and recovery of, at least, three flasks in each harvesting day along the growth cycle. The various experiments were carried out in randomized order and in duplicate. Cultures were allowed to grow until either late exponential phase or early stationary phase. The experiment intended to be held at 14°C and 105 μmol photons m−2 s−1 was not performed, because it was found (from extrapolation of the other experiments) that such region was not interesting towards high values of biochemical parameters (as desired).
0 50 100 150 200 250 300 5 10 15 20 25 30 Temperature (oC) Irradiance (µmol m s ) -2 -1
Fig. 1 Experimental design, in terms of irradiance (μmol photons m−2 s−1) and temperature (°C)
Analytical assaying
Determinations of cell number were performed with a Neubauer Improved bright-line haemocytometer. Ash free dry weight was determined by filtering 10 mL of culture through pre-conditioned Whatman GF/C glass fibre filters, drying at 100°C to constant weight and heating at 550°C to eliminate the organic material.
Biochemical composition
The total protein content was assayed by the Lowry method (Lowry et al.1951), after previous hydrolysis in 2 M NaOH for 15 min in an ultrasonicator, and a further treatment at 100°C for 5 min to dissolve proteins. Bovine serum albumin was used as standard. Total carbohydrates were quantified as glucose equivalent, according to the phenol/sulphuric acid method (Dubois et al.1956). Total lipids were determined gravimetrically by the Bligh–Dyer method (Bligh and Dyer 1959). The pigment contents were estimated spectrophoto-metrically after overnight extraction with 100% acetone saturated with magnesium hydroxide carbonate at 4°C in the dark (Jeffrey and Humphrey1975). Intracellular contents of carbon, nitrogen, phosphorus and sulphur were determined with a Fisons EA1108 Elemental Analyser, via combustion of the sample followed by isothermal chromatographic analysis of the resulting gases using a thermal conductivity detector; helium was used as eluent gas, and the stationary phase was composed of Porapak.
Statistical analyses
Principal Component Analysis (PCA) of the data was performed with the XLSTAT software (Microsoft Excel, USA). Unpaired comparison of the overall dataset was performed with the software StatViewTM (Abacus Con-cepts, USA). Regression analysis was used to test for relationships among data.
Results
Due to the (intrinsic) variability of results along the growth curves, the effects of temperature and irradiance on the biochemical profiles of the microalga should be studied independently for each growth phase. Since exponential growth phase encompasses growth conditions for which there is no nutrient limitation, it is the most adequate phase to pinpoint those physical effects on growth.
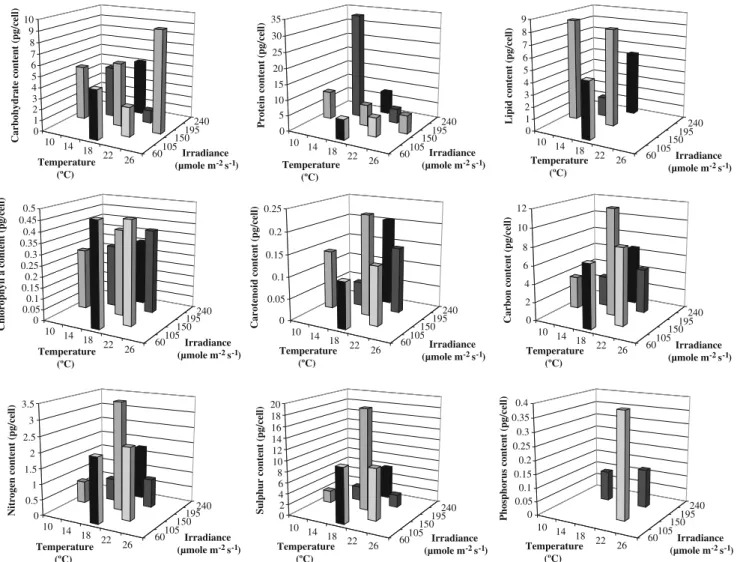
Figure 2 describes the cell quotas of biochemical and elemental compounds in the mid-exponential growth phase, at the various combinations of temperature and irradiance studied. By inspection of such figure it can be observed that
internal carbohydrate content in the exponential growth phase increases with temperature for an irradiance of 150 μmol photons m−2 s−1 whereas it decreases for an irradiance of 195μmol photons m−2s−1. Light also causes an opposite effect at the two temperatures studied: carbohydrate content increases with irradiance up to 150 μmol photons m−2s−1for a temperature of 18°C, and slightly decrease afterwards; at 22°C, carbohydrates de-crease in concentration with irradiance. The highest value of carbohydrate content obtained from these combinations of environmental parameters was 9.26 pg cell−1, in the experi-ment carried out at 26°C and 150 μmol photons m−2 s−1; such result was statistically different from the remaining.
Protein contents also showed varying trends: they decreased with increasing temperature (at the two irradi-ances tested), increased with irradiance for a constant temperature of 18°C, and decreased with irradiance for a constant temperature of 22°C. However, the observed variations among experiments performed at a constant temperature of 22°C are not statistically different among each other. Cells maximized their protein content at environmental conditions of 14°C and 195 μmol photons m−2 s−1 reaching 33.7 pg cell−1, a value significantly different from the remaining.
Lipid content in general decreased with increasing temperature, although not significantly; the response to irradiance was more inconsistent, increasing up to 150μmol photons m−2 s−1 and decreasing afterwards. The highest lipid content (8.4 pg cell−1) was obtained at 10°C and 150 μmol photons m−2s−1, not statistically different from the value obtained at 18°C under the same irradiance.
Internal quotas of carbon, nitrogen and sulphur in-creased with temperature for experiments run at constant irradiances of 150 and 195 μmol photons m−2 s−1. Regarding the influence of irradiance, it was realized that the three quotas increased with light at 18°C up to 150μmol photons m−2s−1, but decreased at 22°C. Largest amounts of carbon (11.8 pg cell−1), nitrogen (3.5 pg cell−1) and sulphur (18.6 pg cell−1) were achieved during the experiment performed at 18°C and 150μmol photons m−2s−1, whereas phosphorus (0.39 pg cell−1) was obtained at 22°C and 105 μmol photons m−2s−1.
Regarding pigments, a decrease in the contents of chloro-phyll a with irradiance has been observed, with the highest pigment content (0.47 pg cell−1) obtained at 18°C and 60μmol photons m−2s−1, although not statistically different from the value obtained at 22°C and 105 μmol photons m−2s−1. The total carotenoid content per cell increased with irradiance, reaching its maximum at 18°C and 240 μmol photons m−2 s−1, again not statistically different from the value obtained at 18°C and 150μmol photons m−2s−1. Both chlorophyll a and carotenoid contents consistently increased with temperature, irrespective of the irradiance.
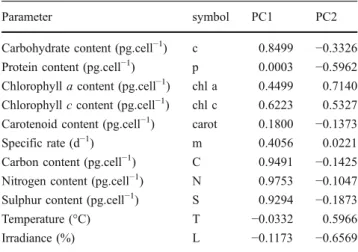
In order to screen for potential relationships between the various biochemical parameters studied, Principal Compo-nent Analysis (PCA) was carried out with the biochemical parameters obtained in the whole set of experimental conditions of light and temperature tested, and by using all the sampling points generated during the exponential, late exponential and early stationary growth phases of each experimental combination tested. PCA is a statistical technique for mapping multidimensional data into lower dimensions, with minimal loss of information. This method explains the variance of the data matrix in terms of new latent variables (called Principal Components), which are linear combinations of the initial ones—if there is a correlation between the data, a small number of Principal Components will summarize the majority of the variation within the matrix. When applying PCA to the data in terms of internal amounts per cell (i.e., quotas), two new variables (PC1 and PC2) together described 58% of the total variance
of the initial matrix, as described in Fig.3. The correlation coefficients obtained with those first two components are presented in Table 1: PC1 is controlled by the quotas of carbon, nitrogen and sulphur, as well as by carbohydrate and chlorophyll c contents; PC2 indicated correlations between the protein and chlorophyll a contents, as well as the environmental parameters (temperature and irradiance). Protein content correlated positively with irradiance and negatively with temperature, while chlorophyll a correlated inversely with irradiance and positively with temperature, which is in agreement with the results previously described. From the results of PCA, it is apparent that neither chlorophyll a nor protein content were suitable indicators of population biomass, since they are dependent on the prevailing environmental conditions. In fact, despite the realization that relationships between chlorophyll a and cell number follow a linear trend (Fig. 4), such trend depends on the actual light regime used: from the data generated,
10 14 18 22 26 60105 150195 240 0 1 2 3 4 5 6 7 8 9 10
Carbohydrate content (pg/cell)
Temperature (ºC) 10 14 18 22 26 Temperature (ºC) 10 14 18 22 26 Temperature (ºC) 10 14 18 22 26 Temperature (ºC) 10 14 18 22 26 Temperature (ºC) 10 14 18 22 26 Temperature (ºC) 10 14 18 22 26 Temperature (ºC) 10 14 18 22 26 Temperature (ºC) 10 14 18 22 26 Temperature (ºC) 0 5 10 15 20 25 30 35
Protein content (pg/cell)
0 1 2 3 4 5 6 7 8 9
Lipid content (pg/cell)
0 0.05 0.1 0.15 0.2 0.25 0.3 0.35 0.4 0.45 0.5
Chlorophyll a content (pg/cell) 0
0.05 0.1 0.15 0.2 0.25
Carotenoid content (pg/cell) 0
2 4 6 8 10 12
Carbon content (pg/cell)
0 0.5 1 1.5 2 2.5 3 3.5
Nitrogen content (pg/cell) 02
4 6 8 10 12 14 16 18 20
Sulphur content (pg/cell) 0
0.05 0.1 0.15 0.2 0.25 0.3 0.35 0.4
Phosphorus content (pg/cell)
Irradiance (µmole m s )-2 -1 60105 150195 240 Irradiance (µmole m s )-2 -1 60105 150195 240 Irradiance (µmole m s )-2 -1 60105 150195 240 Irradiance (µmole m s )-2 -1 60 105150 195240 Irradiance (µmole m s )-2 -1 60105 150195 240 Irradiance (µmole m s )-2 -1 60105 150195 240 Irradiance (µmole m s )-2 -1 60105 150195 240 Irradiance (µmole m s )-2 -1 60105 150195 240 Irradiance (µmole m s )-2 -1
Fig. 2 Cellular quotas of biochemical and elementary compounds in the mid-exponential growth phase, at various combinations of temperature and irradiance
two linear behaviours may be pinpointed, one encompass-ing the data points pertainencompass-ing to the experiments run at lower light intensities (60 and 105μmol photons m−2s−1; R2=0.959), and the other including the points obtained at the higher ones (R2=0.863). Unlike chlorophyll a, the mass content of carotenoids increases linearly with cell number, irrespectively of the light–temperature regime followed (Fig. 5; R2= 0.879); hence, this is a more accurate measurement when estimation of population biomass is sought.
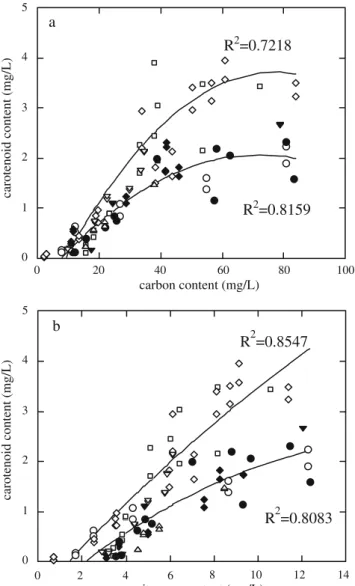
Recalling the second objective (establishment of rela-tionships between pigment contents and the internal amounts of elementary compounds) the linear relationships between extractable carotenoid and carbon, and extractable chlorophyll a and nitrogen were also studied. In what concerns the evolution of the correlation between
caroten-oid and carbon contents (Fig.6a), the linear trend that holds initially—and which is similar for all experiments— subdivides in the late exponential and stationary phases into two lines: the upper line encompasses the experiments run at 195μmol m−2s−1irradiance, whereas the lower one is associated with the remaining experiments. At lower light
Table 1 Correlations between initial variables and first two principal components, in terms of internal values
Parameter symbol PC1 PC2
Carbohydrate content (pg.cell−1) c 0.8499 −0.3326
Protein content (pg.cell−1) p 0.0003 −0.5962
Chlorophyll a content (pg.cell−1) chl a 0.4499 0.7140 Chlorophyll c content (pg.cell−1) chl c 0.6223 0.5327 Carotenoid content (pg.cell−1) carot 0.1800 −0.1373
Specific rate (d−1) m 0.4056 0.0221
Carbon content (pg.cell−1) C 0.9491 −0.1425
Nitrogen content (pg.cell−1) N 0.9753 −0.1047
Sulphur content (pg.cell−1) S 0.9294 −0.1873
Temperature (°C) T −0.0332 0.5966 Irradiance (%) L −0.1173 −0.6569 0 2 4 6 8 10 12 0 0.5x10⁷ 1.0x10⁷ 1.5x10⁷ 2.0x10⁷ 2.5x10⁷ chlorophyll a content (mg/L)
cell number (cell/mL) R2=0.9594
R2=0.8629
Fig. 4 Variation of the total amount of chlorophyll a in the culture with the total cell number, for various combinations of temperature and irradiance: filled inverted triangle 10°C, 150μmol photons m−2s−1, empty circle 26°C, 150μmol photons m−2s−1, filled diamond 18°C, 60 μmol photons m−2 s−1, empty square 14°C, 195 μmol photons m−2s−1, empty diamond 22°C, 195μmol photons m−2s−1, filled circle 22°C, 105 μmol photons m−2 s−1, empty upright triangle 18°C, 240μmol photons m−2s−1, empty inverted triangle 18°C, 150μmol photons m−2 s−1. Experimental data obtained at the lowest light intensities (60 and 105μmol photons m−2s−1) are fitted by the linear relationship Y=−0.0763+6×10⁻⁷X (R2= 0.959), whereas those obtained at the higher light intensities are fitted by the linear relationship Y=0.1959+3×10⁻⁷X (R2=0.863) 0 1 2 3 4 5 0 0.5x10⁷ 1.0x10⁷ 1.5x10⁷ 2.0x10⁷ 2.5x10⁷ carotenoid content (mg/L)
cell number (cell/mL)
R2=0.8789
Fig. 5 Variation of the total amount of carotenoid in the culture with the total cell number, for various combinations of temperature and irradiance: filled inverted triangle 10°C, 150μmol photons m−2s−1, empty circle 26°C, 150 μmol photons m−2 s−1, filled diamond 18°C, 60 μmol photons m−2s−1, empty square 14°C, 195μmol photons m−2s−1, empty diamond 22°C, 195μmol photons m−2s−1, filled circle 22°C, 105μmol photons m−2 s−1, empty upright triangle 18°C, 240 μmol photons m−2 s−1, empty inverted triangle 18°C, 150 photons μmol m−2 s−1. Experimental data are fitted by the linear relationship Y=−0.2057+2× 10⁻⁷X (R2=0.879) L T S N C m carot. chl c chl a p c -1 -0.8 -0.6 -0.4 -0.2 0 0.2 0.4 0.6 0.8 1 -1 -0.5 0 0.5 1 -- axis 1 (39% ) --> axis 2 (19% )
Fig. 3 PCA plot in terms of internal amounts of s carbohydrate, p protein (picograms per cell), chl a chlorophyll a (picograms per cell), chl c chlorophyll c (picograms per cell), carot carotenoid (picograms per cell), C carbon (picograms per cell), N nitrogen (picograms per cell) and S sulphur (picograms per cell), and m specific rate (per day), T temperature (°C) and L irradiance (μmol photons m−2s−1)
intensities, a saturation point is apparently reached, after which there is no increase in carotenoid levels despite the increase in carbon amount; conversely, at higher light intensities (195 μmol photons m−2 s−1) such saturation
point is only reached at higher carbon amounts. The highest irradiance tested was in fact 240 μmol photons m−2 s−1 (instead of 195 μmol photons m−2 s−1), but the values obtained for the biochemical parameters in the former were always small (due to the lower running time of the experiment), and thus laid in the linear part of the plot. The dependence of carotenoid content on nitrogen content (Fig. 6-b) followed a similar trend.
The behaviour observed for the dependence of chlorophyll a content on carbon content is also driven by saturation lines: the upper line pertains to the experiments run at 22°C and 105 μmol photons m−2 s−1 irradiance, 18°C and 60 μmol photons m−2s−1, and 14°C and 195μmol photons m−2s−1, whereas the lower encompasses the remaining experiments (Fig.7a). The relationship between the pigment content and the nitrogen content (Fig. 7b) does not follow a consistent trend.
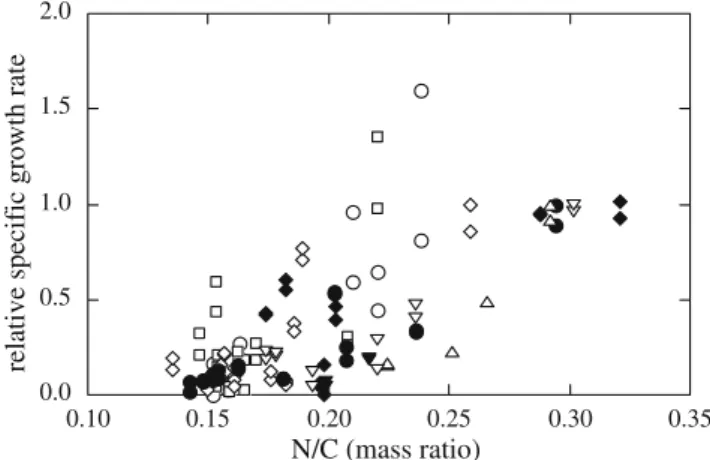
Finally, a putative linear trend was tested between the relative specific growth rate (defined as the observed specific growth rate normalized by the maximum specific growth rate) and the ratio N/C, which represents a balance between the metabolisms of N and C, integrated over the whole cellular processes (Fig. 8); nevertheless, the fitting was poor (R2=0.594).
Discussion
The biochemical composition of Pavlova lutheri was evalu-ated with respect to variations in irradiance and temperature provided during growth. Discussion will be divided in two parts, one concerning the impact of environmental parame-ters on the biochemical profile of the microalga and the second relating the biochemical parameters among each other, in order to obtain linear correlations.
Impact of environmental parameters on biochemical profiles
The inconsistent variations observed in carbohydrate content with temperature or light had already been described: Thompson and Guo (1992) reported inconsistent variation of the internal amounts of carbohydrate with temperature for P. lutheri at the mid-exponential phase, under a constant radiation of 220 μmol photons m−2 s−1. Regarding the effect of irradiance, Sukenik (1991) showed increases in carbohydrate content with light in the range 30–400 μmol photons m−2 s−1 at 25°C, and decreases at higher intensities for I. galbana. Those reports suggest the rationale that a link exists between the effects of temper-ature and light, which may lead to inverse variations in a biochemical parameter with one effect, depending on the stated value of the other effect.
0 1 2 3 4 5 0 2 4 6 8 10 12 14 carotenoid content (mg/L) nitrogen content (mg/L) R2=0.8547 R2=0.8083 b 0 1 2 3 4 5 0 20 40 60 80 100 carotenoid content (mg/L) carbon content (mg/L) R2=0.7218 R2=0.8159 a
Fig. 6 Relationship between the carotenoid content of the culture and the internal amount of a carbon or b nitrogen, for various combinations of temperature and irradiance: filled inverted triangle 10°C, 150μmol photons m−2s−1, empty circle 26°C, 150μmol photons m−2s−1, filled diamond 18°C, 60 μmol photons m−2 s−1, empty square 14°C, 195μmol photons m−2s−1, empty diamond 22°C, 195μmol photons m−2s−1, filled circle 22°C, 105μmol photons m−2s−1, empty upright triangle 18°C, 240μmol photons m−2 s−1, empty inverted triangle 18°C, 150μmol photons m−2s−1. Plot a: experimental data obtained at the lowest light intensities (60–150 μmol photons m−2s−1) are fitted by the polynomial relationship Y=−0.5165+0.0719X−5×10−4X2(R2= 0.816), whereas those obtained at the higher irradiances are fitted by the polynomial relationship Y=−1.0192+0.1232X−8×10−4X2 (R2= 0.722). Plot b experimental data obtained at the lowest irradiances (60–150 μmol photons m−2s−1) are well-fitted by the relationship Y= −0.749+0.3738X−0.0109X2
(R2=0.808), whereas those obtained at the higher irradiances are well-fitted by Y=−0.6504+0.4783X− 0.0066X2(R2=0.855)
With respect to protein, it is known that temperature influences growth of phytoplankton primarily via control of enzyme kinetics. Hence, the increase in the proportion of carbon incorporated in proteins observed when temperature decrease mainly reflects the cell requirement for more enzymes (Jorgensen and Steeman-Nielsen1965; Jorgensen 1968; Thompson and Guo 1992), which may obviously differ between species. Regarding irradiance, light limita-tion induces a deficiency in the carbon assimilated; consequently, the synthesis of chlorophyll a is stimulated in order to increase the photosynthetic capacity to fix
carbon dioxide, thus directing the assimilated carbon skeletons for pigment synthesis rather than for amino acid synthesis, as observed. Hence, it is not surprising that from the combined effects of irradiance and temperature, the highest amount of protein was obtained in the experiment performed at 14°C and 195μmol photons m−2s−1, which is the combination of environmental conditions that includes the lowest temperature and the highest irradiance tested.
Light is the driving force of photosynthesis, as well as a major issue in cell photo-acclimatization, in the course of which phytoplankton changes its physiological properties, thereby optimizing light harvesting and utilization. At low light regimes, cells maximize use of the available energy via increasing cellular pigmentation. The decrease in contents of chlorophyll a and other light harvesting pigments with increasing irradiance has been extensively described (Dubinsky et al.1995), and is consistent with our conclusions, with the highest pigment contents obtained at 60–105 μmol photons m−2 s−1 (the lowest values of irradiance tested). However, Finkel (2004) described an increase in intracellular chlorophyll a content with irradi-ance, at very low levels of light, which shifted to an inverse relationship above a threshold value, due to a saturation effect in photon harvesting. In our study, a consistent inverse relationship between irradiance and chlorophyll a was observed, because our lowest irradiance values were above the threshold value abovementioned.
Other photosynthetic pigments of this Pavlovophyceae are chlorophyll c and carotenoids, which function as accessory pigments in the photosystems, as structural components of the light harvesting complexes and as photoprotective agents (Del Campo et al. 2000), thereby
0.0 0.5 1.0 1.5 2.0 0.10 0.15 0.20 0.25 0.30 0.35
relative specific growth rate
N/C (mass ratio)
Fig. 8 Relationship between the ratio C/N and the relative specific growth rate, for various combinations of temperature and irradiance: filled inverted triangle 10°C, 150μmol photons m−2s−1, empty circle 26°C, 150 μmol photons m−2 s−1, filled diamond 18°C, 60 μmol photons m−2s−1, empty square 14°C, 195μmol photons m−2s−1, empty diamond 22°C, 195μmol photons m−2s−1, filled circle 22°C, 105μmol photons m−2 s−1, empty upright triangle 18°C, 240 μmol photons m−2s−1, empty inverted triangle 18°C, 150μmol photons m−2s−1 0 2 4 6 8 10 0 20 40 60 80 100 chlorophyll a content (mg/L) carbon content (mg/L) R2=0.781 R2=0.868 a 0 2 4 6 8 10 0 5 10 15 chlorophyll a content (mg/L) nitrogen content (mg/L) b
Fig. 7 Relationship between the chlorophyll a content of the culture and the internal amount of a carbon or b nitrogen, for various combinations of temperature and irradiance: filled inverted triangle 10°C, 150 μmol photons m−2 s−1, empty circle 26°C, 150 μmol photons m−2 s−1, filled diamond 18°C, 60 μmol photons m−2 s−1, empty square 14°C, 195μmol photons m−2s−1, empty diamond 22°C, 195μmol photons m−2s−1, filled circle 22°C, 105μmol photons m−2s−1, empty upright triangle 18°C, 240μmol photons m−2s−1, empty inverted triangle 18°C, 150μmol photons m−2 s−1. Plot a: experimental data obtained at the lowest irradiances (60–150 μmol photons m−2s−1) are well-fitted by the polynomial relationship Y=0.1044X−0.0008X2
(R2= 0.781), whereas those obtained at the higher irradiances are well-fitted by the relationship Y=−2.4811+0.2806X−0.0019X2
increasing with irradiance, also as observed. There are quite few studies concerning the effect of temperature on the internal production of pigments by microalgal cells. In our study, both the chlorophyll a and the carotenoids increased in content with temperature, a result consistently observed at all light intensities considered. Thompson (1992) also observed the general trend of chlorophyll a content to increase with temperature in eight different phytoplankton species, which suggests a common pattern of decrease in energy saturation with increasing temperature. Sukenik (1993) reported increases in both chlorophyll a and caroten-oid contents with temperature in cultures of Nannochloropsis sp., whereas Del Campo et al. (2000) described a stimulated production of lutein, a carotenoid from Muriellopsis sp., when temperature increased. A possible explanation for the latter lies on the assumption that the endogenously generated active oxygen is responsible for stimulation of carotenogenesis, which is a process observed at high temperature in Haematococcus spp. (Borowitzka 1988). The consistency of the results produced is, however, hardly coincidental, so there seems to be a relationship between temperature and internal production of photosynthetic pig-ments; further research is, nevertheless, required in order to fully clarify this issue.
One interesting conclusion from the overall data obtained is that the trend observed for the biochemical parameters versus temperature depends on the (constant) irradiance at which the experiments are conducted, and may be reversed at another irradiance; e.g., the carbohydrate amount increased with irradiance when experiments were performed at 18°C, but decreased with irradiance at 22°C. Similar behaviours were recorded for experiments per-formed at constant irradiance and varying temperatures. In an interesting study conducted outdoors with algal cultures, Vonshak (2000) described how a de-synchronization be-tween irradiance and temperature supplied to the culture resulted in a stress condition, where photoinhibition was induced at relatively low light intensities. Consequently, extrapolations from behaviours with one set of physical conditions to another should be done with care.
Relationships between biochemical parameters and physiological status
In phytoplankton studies, the possibility of using pigment contents as indicators of carbon and nitrogen contents, nutrient status and growth rate, i.e., the physiological properties (status) of the culture, have been frequently postulated. Apart from allowing a deeper knowledge on the biochemical pathways inside the cells, those indicators also permit a substantial reduction in the number of variables necessary to characterize the algal population (Davidson et al.1991).
Our analysis concerns two objectives: the validity of using pigment contents to estimate biomass, and the relationship between such pigment contents and the internal amounts of elementary compounds. The latter is time-consuming to determine, so if there is a substantiated relationship between a cellular quota of an elementary compound and a pigment (easier to quantify), the quanti-fication of pigment contents will allow the simultaneous determination of biomass and elementary compounds, with enormous savings of time and efforts.
Regarding the first objective, chlorophyll a is often used to estimate phytoplankton biomass, although this pigment is strongly influenced by incident irradiance. In fact, low irradiance induces the cells to increase their chlorophyll content, as seen before; cells exposed to high irradiance will use fewer resources for chlorophyll synthesis than for synthesizing other enzymes implicated in the dark phase of photosynthesis (Fuentes et al. 2000). Furthermore, even under constant rates of illumination, nutrient depletion causes immediate discontinuation of chlorophyll a synthe-sis, although cell division continues (until the minimum cellular content of the limiting nutrient is attained; Madariaga1992). Therefore, it is of the utmost importance to clearly establish the physical–chemical constraints for every relationship established, because distinct environ-mental factors may exert simultaneous, yet dissimilar influences on the phytoplankton metabolic pathways.
From the results depicted in Figs. 4 and 5, it can be stated that conclusions encompassing population biomass based on the content of chlorophyll a should be drawn carefully when irradiance is not held constant. As the mass content of carotenoids increases linearly with cell number, irrespectively of the light–temperature regime followed, this is a more accurate measurement when estimation of population biomass is sought.
Recalling the second objective, the linear relationships between extractable carotenoid and carbon, and extractable chlorophyll a and nitrogen (Clark et al.1999; Davidson et al. 1991) were also studied. The published results were obtained from samples collected after the logarithmic phase, in batch cultures with nitrogen or carbon as limiting or excess nutrients, under constant irradiance and temper-ature. Our study, which used various irradiances and temperature regimes during the whole growth curve, suggests that the dependence of pigment content on the internal nutrients does not seem to be influenced by the said environmental conditions, although it is influenced by the growth curve. Such behaviour seems to be related to a deficiency in light, which is noted first in the cultures submitted to lower light intensities, and is emphasized during the stationary growth phase of the cycle (which correlates to the experimental points with the highest carbon content). Hence, the conclusions previously drawn
regarding direct relationships between carotenoid content and intracellular levels of carbon and nitrogen are also valid for experiments with variable conditions of light and temperature. The behaviour observed for the dependence of chloro-phyll a content on carbon content and the relationship between the pigment content and the nitrogen content are valid for the whole growth curve rather than for only part of it, as is sometimes described in the literature.
Finally, the tentative trend tested between the relative specific growth rate and the ratio N/C, gave a poor fitting. Clark (2001) reported different behaviours for the carbon specific growth rate versus N/C for two marine diatoms in batch cultures, either C- or N-replete, depending on the nutrient being depleted; those studies, which were under-taken at constant irradiance (200 μmol photons m−2 s−1) and temperature (18°C), suggested that such a relationship may be class-specific. Our results seem to indicate that such relationships are also environmental-dependent.
Conclusion
The effects of irradiance and temperature in the biochem-ical composition of P. lutheri cells are synergistic, and it can be observed that a trend in behaviour produced at a certain temperature is reversed at a different temperature; therefore, when optimizing the environmental conditions in a culture they must be studied simultaneously.
The relationship between carotenoid content and cell numbers is independent of the environmental conditions prevailing in the culture and can thus be used to monitor cell growth. On the other side, although there are consistent relationships between pigment contents and elementary compounds in cells, its linearity is influenced by the irradiance of the culture and its age; therefore, they can only be applied in specific circumstances.
Acknowledgements A. P. Carvalho received a fellowship from the Portuguese Foundation for Science and Technology (Fundação para a Ciência e Tecnologia, FCT, Portugal; SFRH/BPD/26424/2006), funded by the POCI 2010 program, with the support of FSE (Fundo Social Europeu). C. M. Monteiro received a grant (BD/2838/93-IF) from PRAXIS XXI (FCT, Portugal).
References
Araújo SC, Garcia VMT (2005) Growth and biochemical composition of the diatom Chaetoceros cf. wighamii brightwell under different temperature, salinity and carbon dioxide levels. I. Protein, carbohydrates and lipids. Aquacult 246:405–412 Ayala JF, Bravo BR (1984) Animal wastes media for Spirulina
production. Arch Hydrobiol Suppl 67:349–355
Baeck SH, Shinji S, Kikuchi T (2008) Growth of dinoflagellates, Ceratium furca and Ceratium fusus in Sagami Bay, Japan: The
role of temperature, irradiance and photoperiod. Harmful Algae 7:163–173
Bligh WJ, Dyer WJ (1959) A rapid method of total lipid extraction and purification. Can J Biochem Physiol 37:911–917
Borowitzka MA (1988) Vitamins and fine chemicals from micro-algae. In: Borowitzka, MA, Borowitzka, LJ (eds) Micro-algal Biotechnology. Cambridge University Press, Cambridge, pp 153–196
Carvalho AP, Malcata FX (2003) Kinetic modeling of the autotrophic growth of Pavlova lutheri: study of the combined influence of light and temperature. Biotechnol Progr 19:1128–1135
Clark DR, Merret MJ, Flynn KJ (1999) Utilization of dissolved inorganic carbon (DIC) and the response of the marine flagellate Isochrysis galbana to carbon or nitrogen stress. New Phytol 144:463–470
Clark DR (2001) Growth rate relationships to physiological indices of nutrient status in marine diatoms. J Phycol 37:249–256 Davidson K, Flynn KJ, Cunningham A (1991) Relationships between
photopigments, cell carbon, cell nitrogen and growth rate for a marine nanoflagellate. J Exp Mar Biol Ecol 153:87–96 Del Campo JA, Moreno J, Rodriguez H, Vargas MA, Rivas J,
Guerrero M (2000) Carotenoid content of chlorophycean micro-algae: factors determining lutein accumulation in Muriellopsis sp. (Chlorophyta). J Biotechnol 76:51–59
Dermoun D, Chaumont D, Thebault J, Dauta A (1992) Modelling of growth of Porphyridium cruentum in connection with two interdependent factors: light and temperature. Bior Technol 42:113–117
Dubinsky Z, Matsukawa R, Karube I (1995) Photobiological aspects of algal mass culture. J Mar Biotechnol 2:61–65
Dubois M, Gilles KA, Hamilton JK, Rebers PA, Smith F (1956) Colorimetric method for determination of sugars and related substances. Anal Chem 28:350–356
Finkel ZV, Irwin AJ, Schofield O (2004) Resource limitation alters the 3/4 size scaling of metabolic rates in phytoplankton. Mar Ecol Prog Ser 273:269–279
Fuentes MMR, Fernandez GGA, Perez JAS, Guerrero JLG (2000) Biomass nutrient profiles of the microalga Porphyridium cruen-tum. Food Chem 70:345–353
Harding WW, Meeson BW, Fisher TR (1985) Patterns of photosyn-thetic carbon metabolism in light-limited phytoplankton. Mar Biol 89:121–133
Jeffrey SW, Humphrey GF (1975) New spectrophotometric equations for determining chlorophylls a, b, c1 and c2 in higher plants, algae and natural phytoplankton. Biochem Physiol Pflanz 167:191–194
Joo DS, Cho MG, Rainer B, Lee EH (1998) Growth and fatty acid composition with growth conditions for Spirulina platensis. J Korean Fish Soc 31:409–416
Jorgensen EG, Steeman-Nielsen E (1965) Adaptation in plankton algae. Ist Total Idrobiol 18S: 37–46
Jorgensen EG (1968) The adaptation of plankton algae II. Aspects of the temperature adaptation of Skeletonema costatum. Physiol Plant 21:423–427
Lowry O, Rosebrough NJ, Farr AL, Randall RJ (1951) Protein measurement with the Folin phenol reagent. J Biol Chem 193:265–275
Madariaga I, Joint I (1992) A comparative study of phytoplankton physiological indicators. J. Exp Mar Biol Ecol 158:149–165 Otero A, Vincenzini M (2003) Extracellular polysaccharide synthesis
by Nostoc strains as affected by N source and irradiance. J Biotechnol 102:143–152
Ponis E, Parisi G, Le Coz J-R, Zittelli C, Tredici MR (2006) Effect of the culture system and culture technique on biochemical characteristics of Pavlova lutheri and its nutritional value for Crassostrea gigas larvae. Aquac Nut 12:322–329
Richmond A (1986) CRC Handbook of Microalgal Mass Culture. CRC, Boca Raton, Florida
Rochet M, Legendre L, Demers S (1985) Acclimation of sea-ice microalgae to freezing temperature. Mar Ecol Prog Ser 24:187–191 Spektorova LV, Nosova LP, Goronkova OI, Albitskaya ON, Filippovskij Yu N (1986) High-density culture of marine microalgae—promising items for mariculture. 2. Determination of optimal light regime for Chlorella sp. marina under high-density culture conditions. Aquacult 55:221–229
Spolaore P, Joannis-Cassan C, Duran E, Isambert A (2006) Optimi-zation of Nannochloropsis oculata growth using the response surface method. J Chem Technol Biotechnol 81:1049–1056 Sukenik A, Wahnon R (1991) Biochemical quality of marine
unicellular algae with special emphasis on lipid composition. I. Isochrysis galbana. Aquacult 97:61–72
Sukenik A, Zmora O, Carmeli Y (1993) Biochemical quality of marine unicellular algae with special emphasis on lipid compo-sition. I. Nannochloropsis sp. Aquacult 117:313–326
Thompson PA, Guo M (1992) Effects of variation in temperature. i. on the biochemical composition of eight species of marine phyto-plankton. J Phycol 28:481–488
Thompson P (1999) The response of growth and biochemical composition to variations in daylength, temperature, and irradi-ance in the marine diatom Thalassiosira pseudonana (Bacillar-iophyceae). J Phycol 35:1215–1223
Trabelsi L, Ben Ouada H, Bacha H, Ghoul M (2009) Combined effect of temperature and irradiance on growth and extracellular polymeric substance production by the cyanobacterium Arthro-spira platensis. J Appl Phycol (in press)
Valenzuela-Espinosa E, Millan-Nunez R, Trees CC, Santamaria-del-Angel E, Nunez-Cebrero F (2007) Growth and accessory pigment to chlorophyll a ratios of Thalassiosira pseudonana (Bacillariophyceae) cultured under different irradiances. Hidro-biologica 17(3):249–255
Volkman JK, Jeffrey SW, Nichols PD, Rogers GL, Garland CD (1989) Fatty acid and lipid composition of 10 species of microalgae used in mariculture. J Exp Mar Biol Ecol 128:219– 240
Vonshak A, Torzillo G, Boussiba S, Millie DF, Kurgens P (2000) Temperature induced photoinhibition in outdoor cultures of Monodus subterraneus. Proc. 54th Annual Meeting. Phycologi-cal Society of America, San Diego, CA