BJRS
RADIATION SCIENCES
07-2A (2019) 01-09ISSN: 2319-0612
Accepted: 2019-01-23
GALLIUM-67 CITRATE USED AS A TRACER OF
ACETONE PRODUCTION ROUTES
C. H. de Mesquita, W. A. P. Calvo, P. E. Aoki, V. C. da Silva, M. I. Haraguchi, A. F.
Velo, A. G. Alvarez and M. M. Hamada
Instituto de Pesquisas Energéticas e Nucleares- IPEN/CNEN-SP. 05508-000, São Paulo, São Paulo, Brasil [email protected]
ABSTRACT
In this work the pathway of the chemical product and the kinetics parameters were evaluated in a laboratory plant settled, using 0.4 GBq (10 mL) of 67Ga citrate as radiotracer and 18 NaI(Tl) radiation detectors. The AnaComp program was used to estimate the kinetic para ameters of the acetone production. The yield of the acetone production was estimated by the percentage ratio between the areas under the curve (AUC) of the curve profiles of the final product compartment divided by the concentration found inside the chemical reactor whose result was 87% yield during the first 30 minutes of reaction.
1. INTRODUCTION
Acetone is widely used in hospitals, laboratories, cosmetics and chemical industries. In addition, it is also widely used as a solvent in several applications, such as for extraction of fats and oils in the pharmaceutical industry [1]. Commercially, acetone is most used in the production of methyl methac-rylate [MMA], methyl isobutyl ketone [MIBK] and bisphenol A [BPA] [2] in the chemical industries. In 2010, the worldwide production capacity for acetone was estimated at 6.7 million tons per year and the expectative is an increase of approximately 4% per year in its demand [2,3].
The main production methods of acetone are: oxidation of cumene, oxidation of propylene, oxidation of diisopropyl benzene, fermentation of biomass and dehydrogenation of isopropyl alcohol [4]. The cumene oxidation is now the most commonly used technology, approximately 90% of the world pro-duction, since it presents lower costs in relation to the other methods [3].
The radiotracer techniques for industrial processes evaluation have been indicated as the most prom-ising in order to evaluate the kinetic properties along all process. It is capable to obtain measurements in real conditions without interrupting the operation and non-invasive sampling. The radiotracer techniques are widely used in many industries, such as: chemical, food pharmaceutical and oil sec-tors, in order to diagnose and identify failure in their industrial process [5].
The AnaComp program (Compartmental Analysis) [6] is a computational code designed for the anal-ysis of kinetic data in terms of models. It allows the simulation and the fitting of experimental data using an iconographic language that translates to the symbology of the compartmental analysis [6]. In this work the pathway of the chemical product and the kinetics parameters were evaluated in a laboratory plant settled in our Radiation Technology Centre, using 0.4 GBq (10 mL) of 67Ga citrate as radiotracer and 18 NaI(Tl) radiation detectors. The AnaComp code [6] was used to estimate the kinetic parameters of the acetone production.
2. MATERIALS AND METHODS
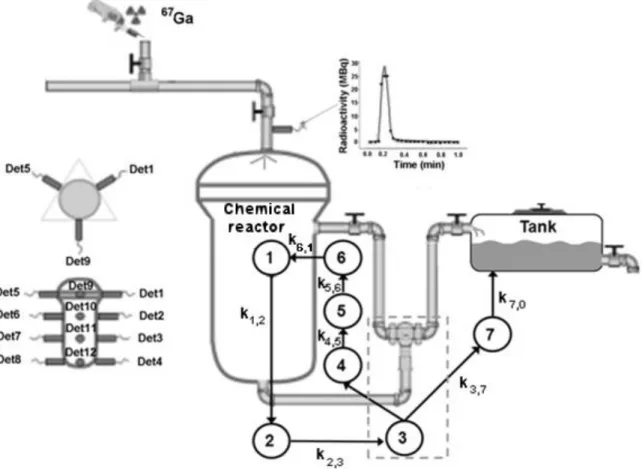
In order to study the pathway of the chemical product and the kinetics parameters of the chemical process, it was used 18 NaI(Tl) of 25 mm diameter and 50 mm thick distributed as shown in Fig. 1.
Figure 1: Scheme of the experimental process and the compartmental model.
Detector and multichannel board is shown in Fig. 2. 0.4 GBq of 67Ga citrate was used as radiotracer. This was injected into the entrance of the chemical reactor by means of a hypodermic syringe wrapped with lead for radioprotection purposes. Immediately after adding radiotracer into the system, radioactivity measurements were started on all 18 detectors, simultaneously. The count time was per-formed at 33 ms in sequential mode. The kinetic parameters, the fraction ki,j(min-1) of the contents of
the compartment i which is transferred to the compartment j in one unit of time, the residence time, equation (1), the mean time T1/2, equation (2), the arrival time of the radiotracer in each of the com-partments assumed to be the time that the maximum value of the compartment kinetic curve oc-curred. All these parameters were estimated using the AnaComp code [6]. The residence time of the tracer in each of the compartments was calculated according to equation (1) and the mean residence time was estimated by equation (2).
𝑅𝑒𝑠𝑖𝑑𝑒𝑛𝑐𝑒 𝑇𝑖𝑚𝑒 = 1 𝑘𝑖,𝑗 (1) 𝑀𝑒𝑎𝑛 𝑇𝑖𝑚𝑒 = 𝑙𝑜𝑔𝑒(2) 𝑘𝑖,𝑗 ≅ 0.693 𝑘𝑖,𝑗 (2)
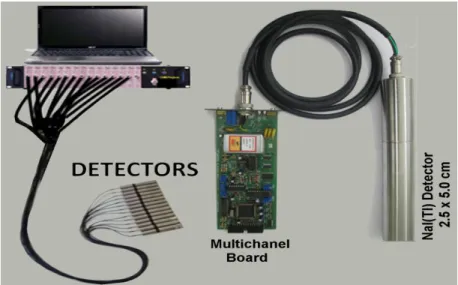
The radioactivity measurement system is shown in Fig. 2. It is constituted of 14 NaI(Tl) scintillator detectors connected to a multichannel analyzer [7]. The measurements were carried out in the win-dow range of 50 to 350 keV calibration of 67Ga spectrum.
3. RESULTS AND DISCUSSION
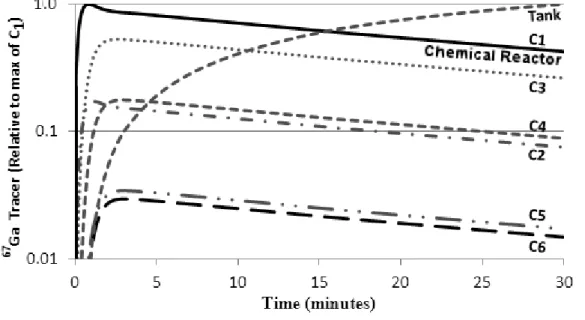
The kinetics curves for each compartments is shown in Figure 3. Most concentration of the product is present in the chemical reactor (compartment C1) until 16 minutes. After that, the reservoir tank keeps most part of the acetone produced. Although a total of seven compartments were used in this analysis, some of them, such as C5 and C6 presented very high values of transfer constants (Table 1), suggesting that they are merely tubular passages, without importance in the context of the kinetics of acetone production. Also, the same conclusions can be inferred from the half-life and residence time parameters (Table 1), which are extremely low for C5 and C6.
Figure 3: 67Ga-citrate tracer concentration at different sampling region as showed in Fig. 1.
In the present study it was necessary to introduce a relatively unusual artifice in Compartmental Analysis. In conventional procedure, it is usual to set the initial value of the compartment by a con-stant value. However, in the present study the radioactive tracer was added using a syringe and the tracer ran a relatively long distance between the injection site and the chemical reactor (Fig. 1). Therefore, the radiotracer enters in the compartment C1 with profile of a Gaussian curve defined by the function (3). Table 2 shows the time of tracer arrival in each compartment.
𝐼𝑛𝑝𝑢𝑡 𝑡𝑜 𝐶1(𝑡) = 𝐴 ∙ 𝑒−(𝜏−𝑡)
2
2∙𝜔2 (3)
where, and are presented in Table 3 and t is the respective time elapsed.
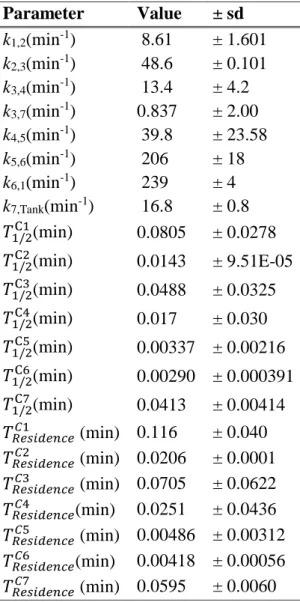
Table 1: Numerical results to the kinetic parameters for the model of Fig. 1.
Parameter Value ± sd k1,2(min-1) 8.61 ± 1.601 k2,3(min-1) 48.6 ± 0.101 k3,4(min-1) 13.4 ± 4.2 k3,7(min-1) 0.837 ± 2.00 k4,5(min-1) 39.8 ± 23.58 k5,6(min-1) 206 ± 18 k6,1(min-1) 239 ± 4 k7,Tank(min-1) 16.8 ± 0.8 𝑇1/2C1(min) 0.0805 ± 0.0278 𝑇1/2C2(min) 0.0143 ± 9.51E-05 𝑇1/2C3(min) 0.0488 ± 0.0325 𝑇1/2C4(min) 0.017 ± 0.030 𝑇1/2C5(min) 0.00337 ± 0.00216 𝑇1/2C6(min) 0.00290 ± 0.000391 𝑇1/2C7(min) 0.0413 ± 0.00414 𝑇𝑅𝑒𝑠𝑖𝑑𝑒𝑛𝑐𝑒𝐶1 (min) 0.116 ± 0.040 𝑇𝑅𝑒𝑠𝑖𝑑𝑒𝑛𝑐𝑒𝐶2 (min) 0.0206 ± 0.0001 𝑇𝑅𝑒𝑠𝑖𝑑𝑒𝑛𝑐𝑒𝐶3 (min) 0.0705 ± 0.0622 𝑇𝑅𝑒𝑠𝑖𝑑𝑒𝑛𝑐𝑒𝐶4 (min) 0.0251 ± 0.0436 𝑇𝑅𝑒𝑠𝑖𝑑𝑒𝑛𝑐𝑒𝐶5 (min) 0.00486 ± 0.00312 𝑇𝑅𝑒𝑠𝑖𝑑𝑒𝑛𝑐𝑒𝐶6 (min) 0.00418 ± 0.00056 𝑇𝑅𝑒𝑠𝑖𝑑𝑒𝑛𝑐𝑒𝐶7 (min) 0.0595 ± 0.0060
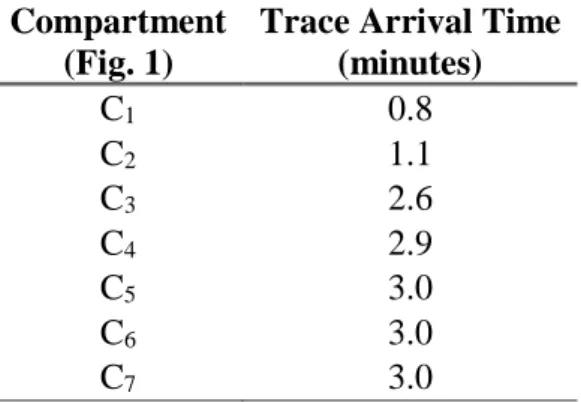
Table 2: Time of tracer arrival in each compartmental region.
Compartment (Fig. 1)
Trace Arrival Time (minutes) C1 0.8 C2 1.1 C3 2.6 C4 2.9 C5 3.0 C6 3.0 C7 3.0
Table 3: 67Ga-citrate input profile in the chemical reactor (C
1) fitted by equation (3).
Table 4 shows the values of the areas under the curves of the tracer content in the compartments C1 and holding tank. The yield of the acetone production was estimated by the percentage ratio between the areas under the curve (AUC) of the profiles of the integral of (C7/C1) resulting a value of 87% during the first 30 minutes of reaction.
Parameters of
Equation (3) Value ± SD
A 31375 ± 1647
0.1707 ± 0.00221
Table 4: Area under the curve (AUC of Cn=∫ 𝐶𝑁𝑑𝑡 𝑡
0 ) of the kinetic profile of compartments C1 and the reservoir tank C7. In the integral the value of t was assumed as t = 30 minutes to calculate AUC.
The chemical reaction yield of 87% is similar to the value described by Gonçalves and Minguita [8].
4. CONCLUSIONS
The compartmental analysis theory was useful to evaluate several parameters of the acetone chemical production. Most concentration of the product is present in the chemical reactor (compartment C1) until 16 minutes. After that, the reservoir tank keeps most part of the acetone produced. Although a total of seven compartments were used in this analysis, some of them, such as C5 and C6 presented very high values of transfer constants of k4,5 and k5,6, suggesting that they are merely a tubular pas-sages, without importance in context of the kinetics of acetone production. It was possible to obtain several kinetic informations from the chemical process, such as: half-life time, mean-time, residence-time, the yield of the chemical reaction was estimated as 87% at 30 minutes of substrate reactions using a safe and non-invasive methodology.
5. ACKNOWLEDGMENT
The authors would like to express their gratitudes to CNPq (The Brazilian National Research Coun-cil) and FAPESP (Foundation for Research Support of the State of São Paulo) for financial support, grants and fellowships.
Compartment AUC C1 (Chemical reactor) 621
C7 (Tank) 539 Yield of the acetone production
(Reaction Yield = 𝐶7𝐴𝑈𝐶
𝐶1𝐴𝑈𝐶× 100)
REFERENCES
[1] WITICOFF, H.A., REUBEN, B.G., PLOTKIN, J.S. Industrial Organic Chemicals. 3.ed. Hobo-ken, NJ: John Wiley & Sons, Inc., 848p., 2012 (ISBN 978-0-470-53743-5).
[2] ZAKOSHANSKY, V. M. The cumene process for phenol-acetone production. Petroleum Chemistry. vol. 47(4), p. 273–284, 2007.
[3] ICIS. Acetone Production and Manufacturing Process. Houston:ICIS, 2007. Available in:
https://www.icis.com/resources/news/2007/11/01/9074860/acetone-production-and-manufacturing-process/. Accessed on October 4, 2017.
[4] FORTUIN, J. P., WATERMAN, H. I. Production of phenol from cumene. Chemical Engineer-ing Science, vol. 3, p.182-192, 1958.
[5] OTHMAN, N. & KAMARUDIN, S. K. Radiotracer Technology in Mixing Processes for
In-dustrial Application, The Scientific World Journal, vol. 2014, Article ID 768604, 15 pages,
2014.
[6] MARCHESE, S.R.M., MESQUITA, C.H., CUNHA, I.I.L. AnaComp program application to
calculate 137C transfer rates in marine organisms and dose in man. J Radioanal Nucl Chem,
vol. 232, p. 233-236, 1998.
[7] Mesquita, C.H., Velo, A.F., Carvalho, D.V.S., Martins, J.F.T., Hamada, M.M. Industrial
to-mography using three different gamma ray. Flow Measurement and Instrumentation, vol. 47
p. 1–9, 2016.
[8] GONÇALVES, C.C.R. & MINGUITA, H.F. Estudo de uma planta industrial de produção de
acetona via desidrogenação do 2-propanol. Depto. de Engenharia Química. Universidade